Kava : Day trade volumeKava can show new volume on day trade volume. We will follow this coin in the coming time frames for the uptrend.
Trade

USDJPY Analysis week 23Fundamental Analysis
Tokyo's core CPI (excluding fresh food) - a key inflation gauge - rose 3.6%, higher than forecast and last month. This increases the possibility that the Bank of Japan (BoJ) will continue to raise interest rates this year, although most experts predict the BoJ will keep rates unchanged until September.
Meanwhile, the USD rose sharply after a US appeals court overturned the decision to remove most of the tariffs imposed by Mr. Trump. However, the Yen still appreciated slightly against the USD.
Technical Analysis
After consecutive declines on Friday, the pair is sideways waiting for the next development. 142.900 is the next support zone that the pair faces, this is the breakout zone and also the trendline meeting. Break this price zone must wait 141,200 for weekly support zone
145,900 last week's peak resistance zone acts as resistance for the pair's price reaction towards this week's resistance peak around 148,000

Pipping the Aussie-Swiss Bank: Day Trading Strategy UnleashedUltimate AUD/CHF Forex Heist Plan 🚨 Swing Trade Mastery for Epic Gains! 🚀
Greetings, Wealth Warriors & Market Mavericks! 👋💸
Get ready to execute a legendary heist on the AUD/CHF "Aussie vs Swissy" Forex market with our exclusive Thief Trading Style! 🎯 This meticulously crafted strategy blends technical precision and fundamental firepower to maximize your profits. Follow the plan outlined in the chart, focusing on a long entry to conquer the high-risk Yellow MA Zone—a battleground of overbought conditions, consolidation, and potential trend reversals where bearish bandits lurk. 🐻 Stay sharp, lock in profits, and trade safely! 💪🎉
Entry 📈: The heist begins! Watch for the MA pullback in the market maker’s trap zone (0.52200 OR above) to strike. Bullish riches await! Set buy stop orders above the Moving Average or place buy limit orders within the 15 or 30-minute timeframe’s recent swing low/high.
Pro tip: Set an alert to catch the breakout entry in action! 🔔
Stop Loss 🛑: Place your Thief SL at the recent swing low/high on the 4H timeframe for swing trades basis. Adjust SL based on your risk tolerance, lot size, and multiple orders.
Target 🎯: Aim for 0.54800 or make a swift exit before the target to secure your loot!
🧲 Scalpers, listen up! 👀 Stick to long-side scalps. Big players can jump in now; others, join the swing trade heist. Use a trailing SL to protect your stash. 💰
💵 AUD/CHF "Aussie vs Swissy" Forex Heist Plan (Swing Trade) is riding a bullish wave 🐂, fueled by critical market drivers. Dive into the fundamentals—Macro Economics, COT Reports, Quantitative Analysis, Intermarket Analysis, Sentiment Outlook, and Future Trends—before launching your heist. Check the linkKs for the full scoop! 🔗👉
📌 Markets move fast, so stay vigilant and adapt your analysis to the latest developments.
⚠️ Trading Alert: News & Position Management 📰🚨
News releases can shake up prices and volatility. Protect your positions by:
Avoiding new trades during news events
Using trailing stop-loss orders to lock in gains
💖 Boost our heist plan! 💥 Hit the Boost Button to supercharge our team’s strength and make stealing profits a breeze. With the Thief Trading Style, you’ll conquer the market daily with ease! 🏆🤝🎉
Stay tuned for the next epic heist plan, Money Makers! 🤑🐱👤🚀

COOLING PCE – GOLD REBOUNDS ON EXPECTATIONS OF FED POLICY EASINGIf the upcoming PCE report shows that inflation continues to cool or comes in below expectations (e.g., core PCE under 0.2% m/m), this could reinforce market expectations that the Federal Reserve (Fed) may have room to begin cutting interest rates sooner—potentially as early as September instead of year-end.
This would weaken the US dollar and push down Treasury yields, both of which typically support gold prices, as the opportunity cost of holding non-yielding assets like gold decreases.
Short-term forecast:
Gold may rebound to the $3,330 – $3,340/oz range.
A breakout above the psychological resistance level of $3,345 could signal a medium-term uptrend.
Trading volume is likely to rise as ETF funds begin accumulating positions again.
Suggested strategy:
Buy XAUUSD around the 3310 – 3313 area
Stoploss: 3300
Take Profit 1: 3325
Take Profit 2: 3335
Take Profit 3: 3345
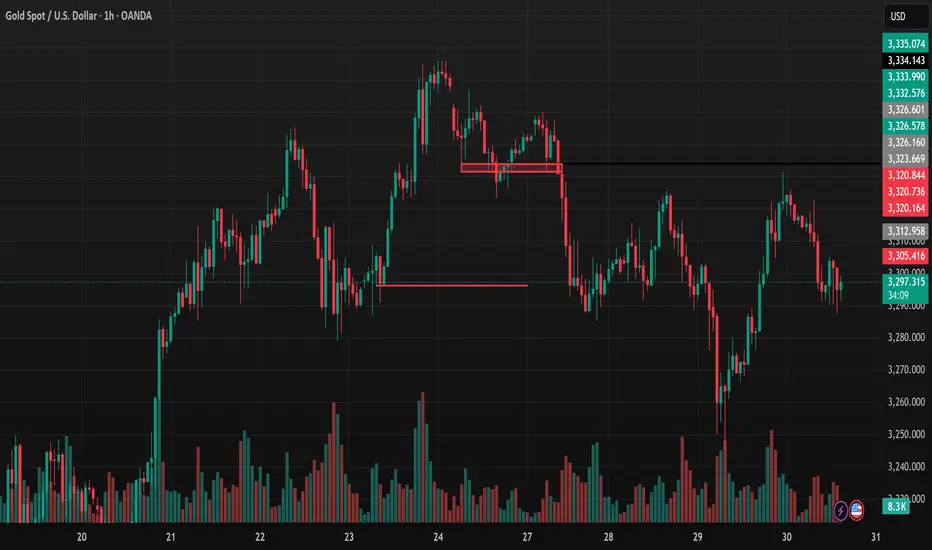
Gold prices fell below for a weekly.Gold FX:XAUUSD prices fell below $3,310 an ounce on Friday, on track for a weekly decline of more than 1%, as investors remained cautious ahead of the U.S. PCE inflation report, which could provide new insight into the Federal Reserve’s interest rate path.
On Thursday, bullion prices rose nearly 1% after a federal appeals court allowed President Donald Trump's sweeping tariffs to temporarily take effect, just one day after the U.S. Court of International Trade blocked their implementation, deeming the method used to enact them "unlawful." Meanwhile, San Francisco Fed President Mary Daly said on Thursday that policymakers could still deliver two rate cuts this year, as expected in March, but emphasized that rates should remain steady for now to ensure inflation is on track to meet the Fed’s 2% target.
XAUUSD TVC:GOLD Trading Strategy Around Price Levels:
SELL XAUUSD CAPITALCOM:GOLD around the 3326–3328 area
Stoploss: 3333
Take Profit 1: 3322
Take Profit 2: 3317
Take Profit 3: 3310
BUY XAUUSD around the 3278–3280 area
Stoploss: 3273
Take Profit 1: 3284
Take Profit 2: 3289
Take Profit 3: 3295
Note: Always set a Stoploss in all situations to ensure safety.
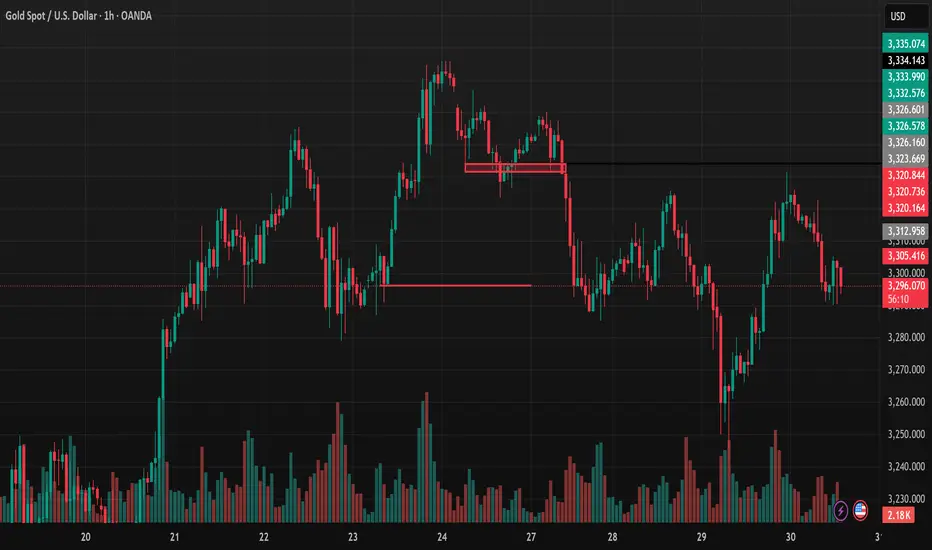
Gold Price Analysis May 30Candle D shows strong buying power on Thursday, most likely today Asia and Europe will decrease and the US session will return to the uptrend.
The bearish wave structure is heading towards 3280. This zone can be bought in Asia and Europe. In the US session, wait for the price reaction to break this zone, limit buying until the bottom of 3254.
Break 3254 confirms the downtrend and heads towards the two support zones 3238 and 3211
When the support zones bounce up, a nice bullish wave is formed and do not SELL Scalp until the 3320 zone. If you break, keep the BUY order up to 3343.

30.05.25 Morning ForecastPairs on Watch -
FX:EURUSD
A short overview of the instruments I am looking at for today, multi-timeframe analysis down to what I will be looking at for an entry. Enjoy!

Breaking News: U.S. Federal Court Blocks Trump’s Tariff PolicyOn Wednesday (local time), a U.S. federal court blocked the tariff policy announced by President Trump on April 2nd, known as "Liberation Day." The court ruled that Trump exceeded his authority by imposing broad tariffs on countries that export more goods to the U.S. than they import from the U.S.
Analysis:
This decision could ease global trade tensions in the short term, especially for major export markets to the U.S. such as China and the European Union. Investors may expect more stability in supply chains and reduced cost pressures from tariffs.
Affected Stock Groups:
Heavy industry and manufacturing companies, particularly in steel, aluminum, and chemicals, may benefit from the blocked tariffs.
Technology, electronics, and consumer goods stocks with global supply chains could see reduced risks from increased tariff costs.
Conversely, U.S.-based companies focused on domestic markets might face increased competition due to lower tariffs on imports.
Investors should closely monitor political developments and any follow-up actions from the U.S. administration to adjust their strategies accordingly.
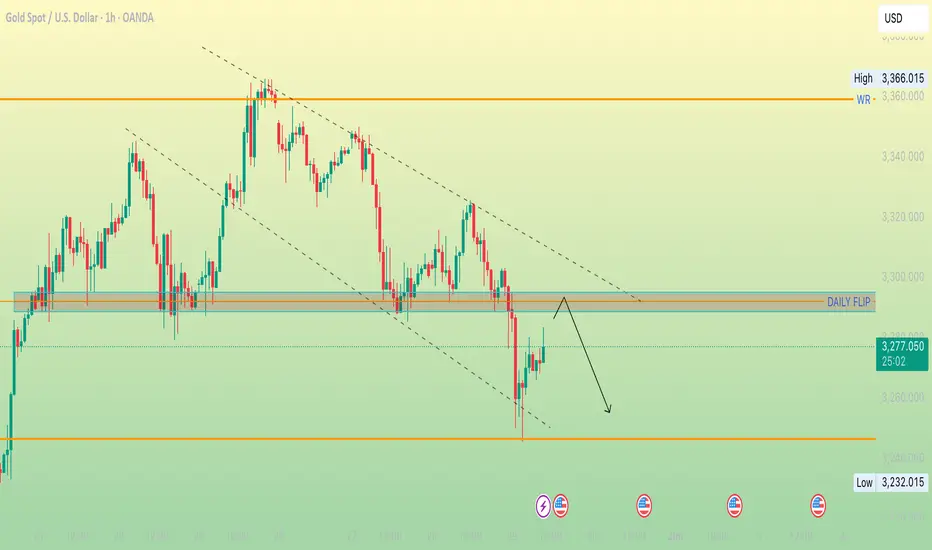
GOLD - SELLING FROM PULLBACKPrice has shown a reaction from the low around 3,245 and is now approaching a strong confluence zone around the DAILY FLIP, which acted as prior support AND now resistance. This zone coincides with the upper boundary of the descending channel.
Bias: Bearish, unless price breaks above 3,305 with strong momentum and closes outside the descending channel.
TRADE IDEA:
SELL from 3,295–3,300 (wait for bearish confirmation)
once activated, I will update SL and TP
Let me know what your opinion.
29.05.25 Morning ForecastPairs on Watch -
FX:AUDCAD
FX:EURUSD
TVC:USOIL
FX:GBPJPY
A short overview of the instruments I am looking at for today, multi-timeframe analysis down to what I will be looking at for an entry. Enjoy!

XAUUSD is currently displaying a classic upward trend structure
Welcome back, traders, to today’s gold market update!
XAUUSD is currently displaying a classic upward trend structure within a rising channel, signaling sustained bullish momentum. The price continues to form higher highs and higher lows—clear evidence that the uptrend remains intact. The recent pullback appears to be a healthy correction, potentially setting the stage for another leg higher.
At the moment, price is approaching a key support zone, marked by the lower boundary of the channel and a previous demand area. If this zone holds, it could present a strong re-entry opportunity for buyers, with the next bullish target projected around $3,450—aligning with both the midline of the ascending channel and a prior resistance level.
As long as the price remains above this support area and the rising trendline, the bullish scenario stays valid. However, a breakdown below this level could invalidate the setup and increase the likelihood of a deeper retracement.
Gold’s consolidation below $3,350 is partly due to the optimism following Trump’s decision to delay tariffs on EU goods, which has acted as a short-term drag on this safe-haven asset. Nonetheless, lingering U.S.-China trade tensions, persistent geopolitical uncertainties, expectations of Fed rate cuts, and broad weakness in the U.S. dollar continue to provide underlying support for gold in the medium term.
Thank you for tuning in, and wishing you successful and disciplined trading!
A Brief Overview of Price Patterns in TradingPrice patterns are technical analysis tools that help identify price behavior on charts to predict future trends.
Common patterns include continuation and reversal formations. Continuation patterns such as flags, triangles, and rectangles often appear during strong trends and indicate the likelihood of the trend continuing after a period of consolidation. Reversal patterns like head and shoulders, double tops and bottoms, and wedges signal potential changes in trend direction. Recognizing these patterns allows traders to optimize entry points, stop-loss levels, and take-profit targets. The clearer the pattern and the higher the timeframe it appears on, the more reliable it tends to be. However, no pattern guarantees success, so it's important to combine them with other factors like volume, support and resistance zones, and confirmation signals before making trading decisions. Each pattern has its own identifying characteristics such as shape, length, and breakout zones, so consistent observation and practice are essential. Price patterns not only assist in technical analysis but also reflect market psychology and crowd behavior. For best results, traders should combine pattern recognition with risk management and patiently wait for clear signals instead of reacting emotionally. A deep understanding of price patterns can increase the probability of success and reduce risk in the trading process.
Wishing you effective trading and strong discipline!
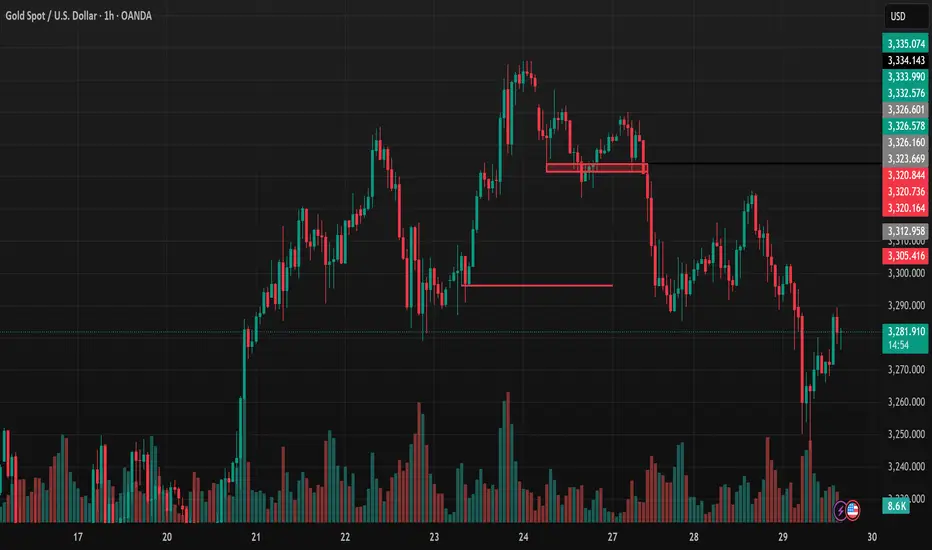
Trading Strategy (XAUUSD) – May 27, 2025The situation unfolded after President Donald Trump threatened to impose a 50% tariff on European goods starting June 1st—a move he later postponed to July 9th to allow more time for negotiations.
However, sentiment remains cautious as investors closely monitor global developments—including the growing U.S. budget deficit, ongoing trade negotiations, and geopolitical tensions in the Middle East and Ukraine—all of which could influence gold's appeal as a safe-haven asset.
Investors are currently awaiting the release of the latest FOMC meeting minutes on Wednesday and the PCE inflation data on Friday for further insight into the Federal Reserve’s interest rate outlook.
XAUUSD Trading Strategy Around Key Price Levels:
SELL XAUUSD around 3363–3365
Stoploss: 3370
Take Profit 1: 3358
Take Profit 2: 3352
Take Profit 3: 3348
BUY XAUUSD around 3326–3328
Stoploss: 3320
Take Profit 1: 3332
Take Profit 2: 3338
Take Profit 3: 3342
Note: Always set a Stoploss in all situations for safety.
Gold’s Rally Faces Exhaustion: A Technical Pause or Trend ReversTVC:GOLD Gold has been on an impressive bullish run in recent months, driven by heightened geopolitical tensions, inflationary concerns, and macroeconomic uncertainty. However, recent price action suggests that the trend may be entering a critical turning point. Despite strong underlying sentiment, gold has failed to set a new high—often a clear indication of trend fatigue and the potential start of a technical correction.
The inability to push beyond resistance signals that gold may be entering what market theorists refer to as an "exhaustion phase." In this phase, bullish momentum begins to slow down as the market runs out of buyers willing to chase higher prices. This often results in a pullback, not necessarily a full reversal, but a pause that allows the market to reset.
Volume dynamics also support this view. A decline in volume during recent rallies suggests waning conviction among buyers—a subtle but telling clue that demand may be weakening.
From a technical standpoint, if this pullback extends further, gold is likely to test a key structural support zone. This level has historically served as both resistance and support, making it significant not only technically but also psychologically for market participants. This area also aligns with several other technical confluences: a Fibonacci retracement zone (possibly the 38.2% or 50% level), trendline support, and even the potential completion point of a Bullish Bat harmonic pattern.
The Bullish Bat pattern, a well-known formation in harmonic trading, is especially worth noting. Based on precise Fibonacci measurements, it typically forecasts a reversal near the 88.6% retracement of the initial XA leg. When this pattern completes near major support and is accompanied by price action confirmation (e.g. bullish engulfing candle, divergence, or base-building), it can offer a high-probability setup for long entries.
However, technicals alone are not sufficient. A comprehensive view of the macroeconomic environment is essential. Several factors are in play: upcoming U.S. inflation data, evolving expectations around the Federal Reserve’s monetary policy, geopolitical uncertainty, and movements in real bond yields. Any of these variables can either validate or invalidate the technical setup, and traders need to stay alert to news that might affect the overall risk appetite.
From a tactical perspective, this is a time for patience. Aggressive entries without confirmation can expose traders to unnecessary risk. Waiting for clear signals near support, aligning trades with higher timeframes, and adhering to disciplined risk management will be essential for success.
In conclusion, gold is at a potential inflection point. Whether this is just a healthy correction in a broader uptrend, or the beginning of a deeper shift, remains to be seen. Both technical and fundamental perspectives are required to build a well-informed trading thesis.
I welcome your insights—whether you analyze from a chart-based or macroeconomic angle. Let’s continue the conversation, share strategies, and grow together as traders.
28.05.25 Morning ForecastPairs on Watch -
OANDA:AU200AUD
FX:GBPAUD
A short overview of the instruments I am looking at for today, multi-timeframe analysis down to what I will be looking at for an entry. Enjoy!

NZD/CHF Heist Blueprint: Snag the Kiwi vs. Franc Profits!Ultimate NZD/CHF Heist Plan: Snag the Kiwi vs. Franc Loot! 🚀💰
🌍 Greetings, Wealth Raiders! Hola! Ciao! Bonjour! 🌟
Fellow money chasers and market bandits, 🤑💸 let’s dive into the NZD/CHF "Kiwi vs. Franc" Forex heist with our 🔥Thief Trading Style🔥, blending sharp technicals and solid fundamentals. Follow the charted strategy for a long entry, aiming to cash out near the high-risk ATR zone. Watch out for overbought signals, consolidation, or a trend reversal trap where bearish robbers lurk. 🏴☠️💪 Seize your profits and treat yourself—you’ve earned it! 🎉
Entry 📈
The vault’s open wide! 🏦 Grab the bullish loot at the current price—the heist is live! For precision, set Buy Limit orders on a 15 or 30-minute timeframe, targeting a retest of the nearest high or low.
Stop Loss 🛑
📍 Place your Thief SL at the recent swing low on a 4H timeframe for day trades.
📍 Adjust SL based on your risk tolerance, lot size, and number of orders.
Target 🎯
Aim for 0.50400 or slip out early to secure your loot! 💰
Scalpers, Listen Up! 👀
Stick to long-side scalps. Got big capital? Jump in now! Smaller stacks? Join swing traders for the robbery. Use a trailing SL to lock in your gains. 🧲💵
NZD/CHF Market Intel 📊
The Kiwi vs. Franc is riding a bullish wave, fueled by key drivers. Dig into the fundamentals, macro trends, COT reports, sentiment, intermarket analysis, and future targets for the full scoop. 🔗👇
⚠️ Trading Alert: News & Position Safety 📰
News drops can shake the market! To protect your loot:
Skip new trades during news releases.
Use trailing stops to secure profits and limit losses. 🚫
Join the Heist! 💥
Support our robbery plan—hit the Boost Button! 🚀 Let’s stack cash with ease using the Thief Trading Style. 💪🤝 Stay sharp for the next heist plan, bandits! 🤑🐱👤🎉

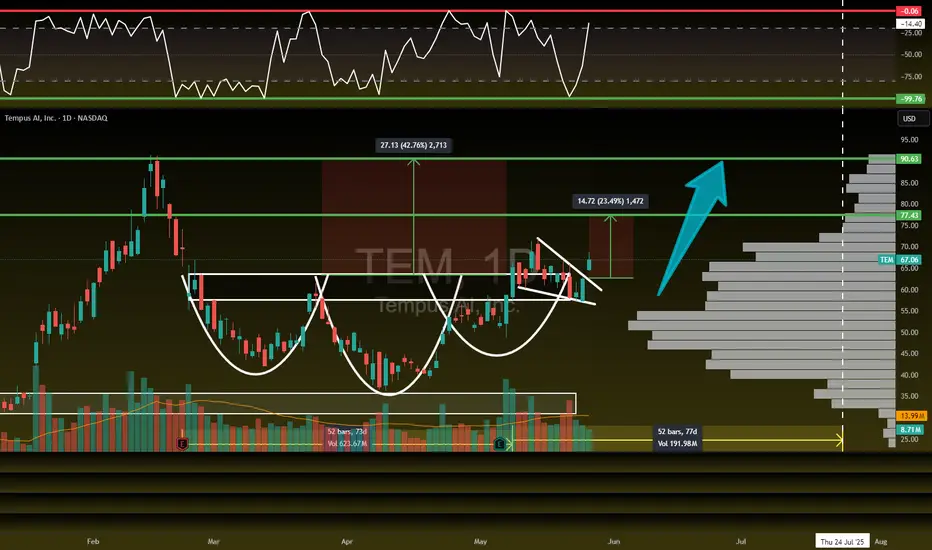
$TEM - GET READY! 30%+ UpsideNASDAQ:TEM - GET READY!
✅ Inverse H&S Breakout
✅ Falling Wedge Breakout
🎯 Targets: $77.43 & $90.63 Before August!
EUR/NZD Short and CAD/JPY ShortEUR/NZD Short
Minimum entry requirements:
• If tight non-structured 5 min continuation forms, reduced risk entry on the break of it.
• If tight structured 5 min continuation forms, reduced risk entry on the break of it or 5 min risk entry within it.
• If tight non-structured 15 min continuation forms, 5 min risk entry within it if the continuation is structured on the 5 min chart or reduced risk entry on the break of it.
• If tight structured 15 min continuation forms, reduced risk entry on the break of it or 15 min risk entry within it.
CAD/JPY Short
Minimum entry requirements:
• Tap into area of value.
• 1H impulse down below area of value.
• If tight non-structured 5 min continuation follows, reduced risk entry on the break of it.
• If tight structured 5 min continuation follows, reduced risk entry on the break of it or 5 min risk entry within it.
• If tight non-structured 15 min continuation follows, 5 min risk entry within it if the continuation is structured on the 5 min chart or reduced risk entry on the break of it.
• If tight structured 15 min continuation follows, reduced risk entry on the break of it or 15 min risk entry within it.

27.05.25 Morning ForecastPairs on Watch -
FOREXCOM:COFFEE
FX:GBPAUD
A short overview of the instruments I am looking at for today, multi-timeframe analysis down to what I will be looking at for an entry. Enjoy!

EUR/AUD Short, CAD/JPY Short and GBP/AUD LongEUR/AUD Short
Minimum entry requirements:
• If structured 1H continuation forms, 1H risk entry within it.
CAD/JPY Short
Minimum entry requirements:
• Break above area of value.
• 1H impulse down below area of interest.
• If tight non-structured 15 min continuation follows, 5 min risk entry within it if the continuation is structured on the 5 min chart or reduced risk entry on the break of it.
• If tight structured 15 min continuation follows, reduced risk entry on the break of it or 15 min risk entry within it.
GBP/AUD Long
Minimum entry requirements:
• Break below area of value.
• 1H impulse up above area of value.
• If tight non-structured 5 min continuation follows, reduced risk entry on the break of it.
• If tight structured 5 min continuation follows, reduced risk entry on the break of it or 5 min risk entry within it.
• If tight non-structured 15 min continuation follows, 5 min risk entry within it if the continuation is structured on the 5 min chart or reduced risk entry on the break of it.
• If tight structured 15 min continuation follows, reduced risk entry on the break of it or 15 min risk entry within it.
EUR/USD Short
Minimum entry requirements:
• 1H impulse down below area of value.
• If tight non-structured 5 min continuation follows, reduced risk entry on the break of it.
• If tight structured 5 min continuation follows, reduced risk entry on the break of it or 5 min risk entry within it.
• If tight non-structured 15 min continuation follows, 5 min risk entry within it if the continuation is structured on the 5 min chart or reduced risk entry on the break of it.
• If tight structured 15 min continuation follows, reduced risk entry on the break of it or 15 min risk entry within it.

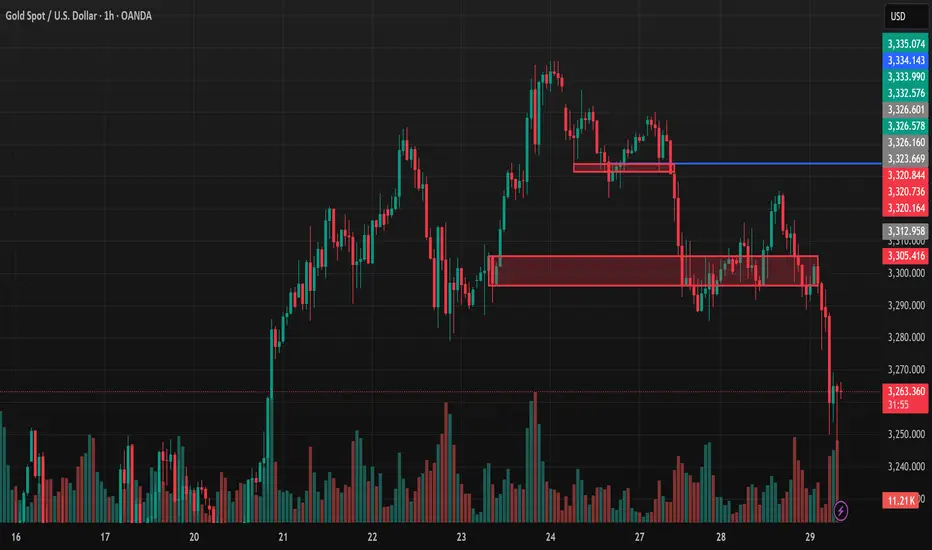
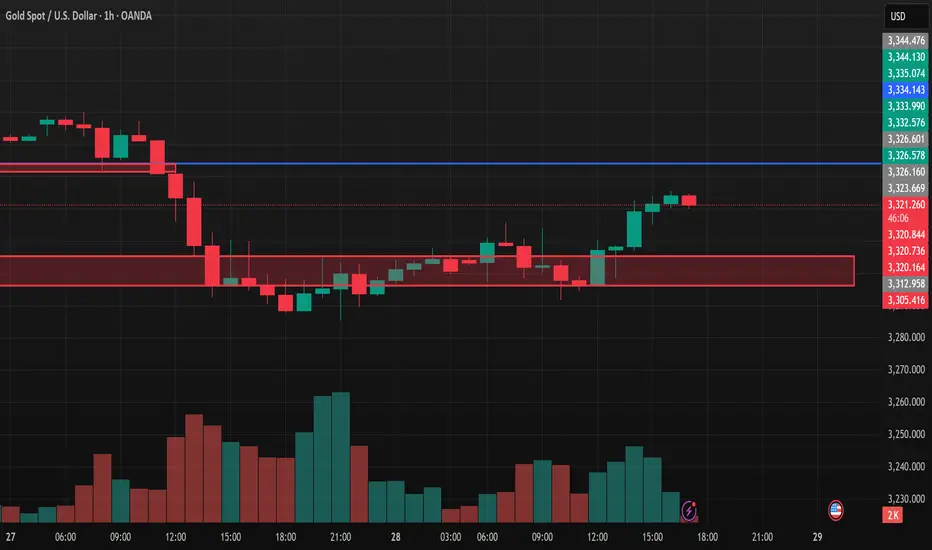
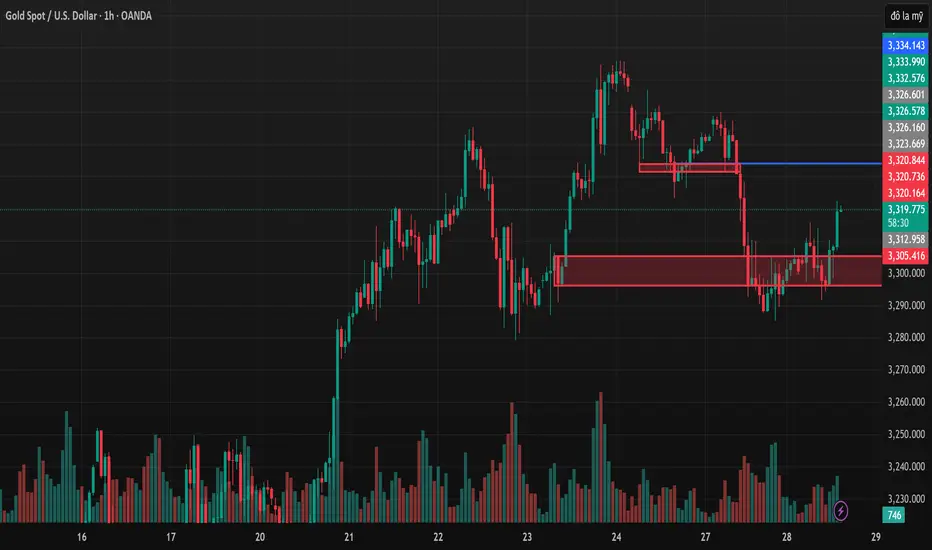
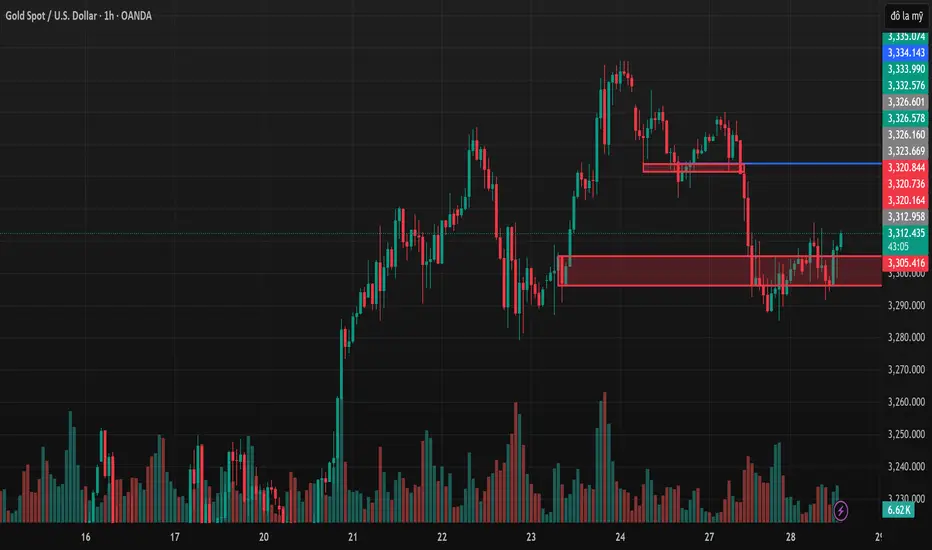
Market next move Original Analysis Summary:
Identifies a bullish structure breaking above a support area.
Projects a potential continuation to higher targets.
Suggests consolidation and bounce from support before climbing.
---
Disruptive Bearish Interpretation:
1. Lower High Possibility:
Recent price action might be forming a lower high rather than a continuation signal, signaling weakness in buying pressure.
2. Volume Imbalance:
Notice how the large green candle was followed by lower bullish volume, suggesting buying momentum is fading.
3. Breakout Trap:
The "Support area" may instead be a liquidity zone where breakout traders entered long positions and could now be trapped. A break below this area could cause a panic sell-off.
4. Trendline Respect (Rejection):
Price is currently retesting the underside of a descending trendline — a common reversal spot.

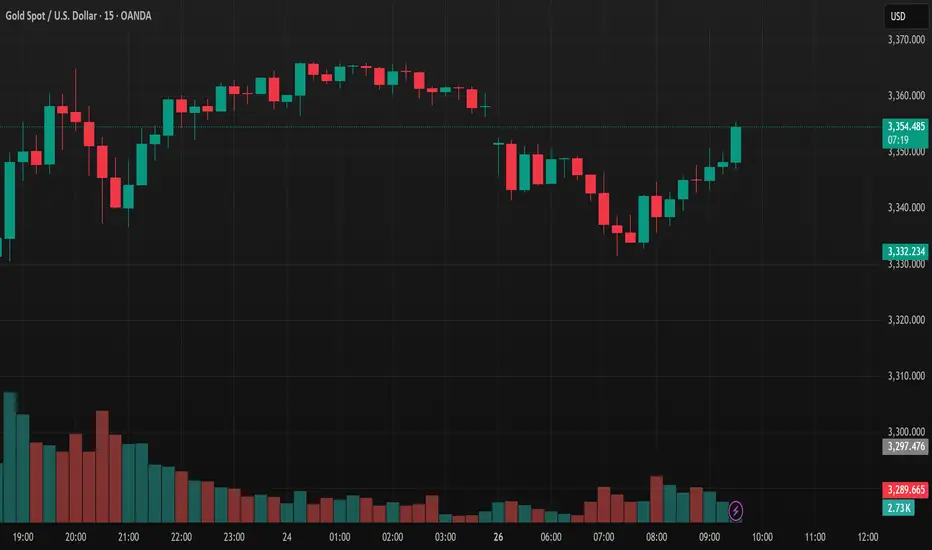
Gold Market Analysis – May 26The gold market is showing signs of a modest recovery following the recent decline, but the price action remains cautious and lacks strong momentum.
In this morning’s session, gold bounced back from the $3,320–$3,330 support area and is now hovering around $3,347, which aligns with a previously rejected resistance zone. This rebound appears technical rather than a confirmed shift in trend, as trading volume during the upward move is still relatively low, signaling buyer hesitation.
The $3,350 level is a critical resistance area. Unless we see a clean breakout above it with strong volume, any attempt to buy here may be premature. However, a confirmed break above $3,350 could open the path toward retesting $3,435 and potentially $3,500 in the medium to long term. On the other hand, failure to hold above the $3,330–$3,320 range, and especially a drop below $3,290, would likely trigger a deeper correction down to the $3,200 support.
In terms of strategy, traders looking to go long should avoid chasing current prices and wait for either a confirmed breakout above $3,350 or a pullback to the $3,320–$3,290 zone. Look for signs of bullish continuation such as higher lows and strong candle confirmation. For those considering short positions, keep an eye on the $3,350 area for bearish rejection patterns like pin bars or engulfing candles on the 4H or daily chart, but only act if clear confirmation appears—don’t guess tops.
In summary, the market is currently in a pivotal consolidation phase. How price behaves around the $3,350 level will shape the next move. While the longer-term outlook remains bullish, traders should remain patient and disciplined, avoiding impulsive entries until the market provides clear signals.
Warm regards,
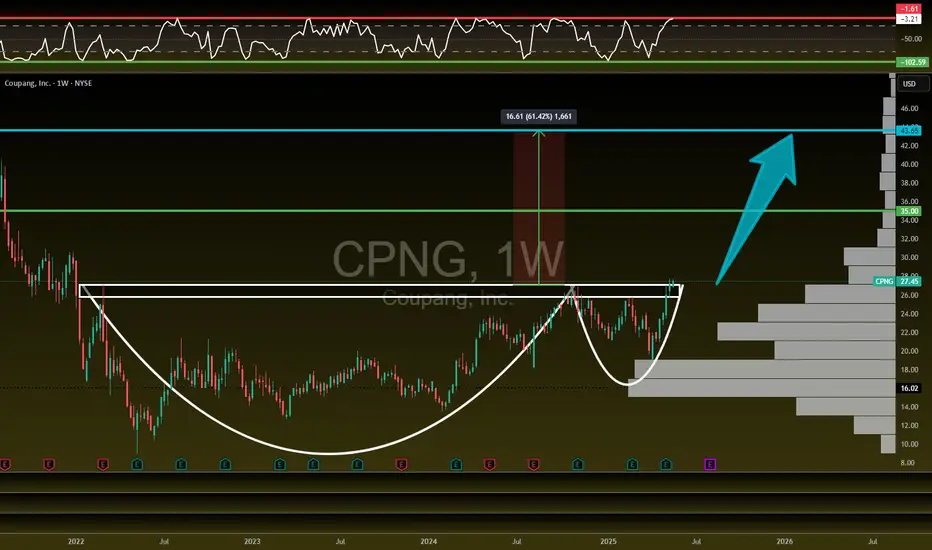
$CPNG is flying and has more room: 61% UpsideNYSE:CPNG has been on a heater! 🚀
First target is $35 🎯
CupnHandle breaking out = $43.65 📏
Looking for a pullback off the red barrier to enter this name after the breakout! 💪