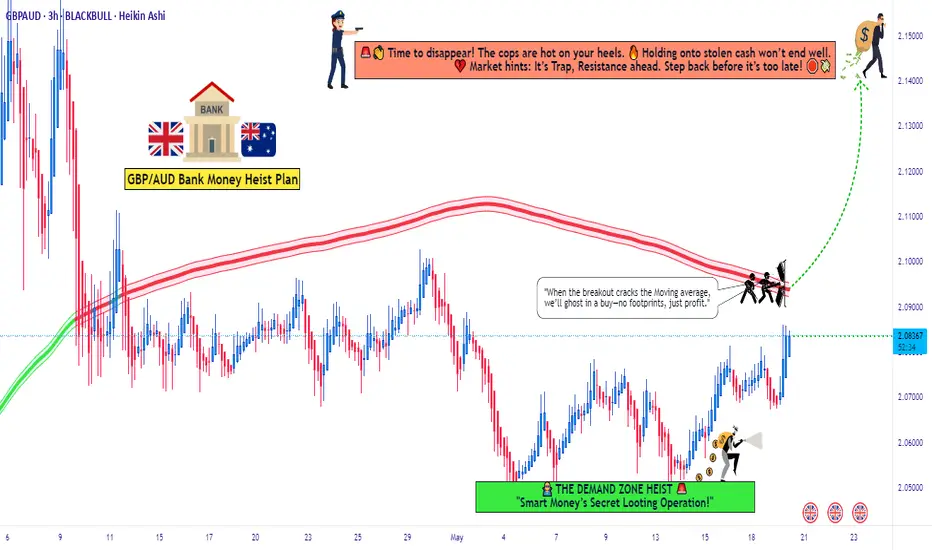
GBP/AUD Heist: Bullish Breakout Plan to Steal Profits!🌟 Pound vs. Aussie Heist: GBP/AUD Trading Plan 🚀💸
Hey Money Makers & Thieves! 🤑💰 Ready to pull off a master heist on the GBP/AUD Forex market? Based on 🔥 Thief Trading Style 🔥 blending technicals and fundamentals, here’s the plan to conquer the "Pound vs. Aussie" with a long entry strategy targeting the high-risk Red Zone. Let’s dive in! 📈🎯
Entry 📈:
The heist is live! Wait for the MA breakout at 2.10000 to strike—bullish profits are calling! 🔔
Set buy stop orders above the Moving Average for breakout entries.
Or, place buy limit orders on a 15 or 30-minute timeframe at the most recent swing low/high for pullback entries.
📌Pro tip: Set an alert on your chart to catch the breakout moment! 🚨
Stop Loss 🛑:
Protect your loot with a Thief SL at the recent swing low/high on the 4H timeframe (2.07400).
Adjust SL based on your risk, lot size, and number of orders. Stay sharp! 🔍
Target 🎯:
Aim for 2.14400 or exit early to secure profits before the target. Don’t get greedy! 💪
Scalpers, Listen Up 👀:
Stick to the long side for quick scalps.
Big players can jump in now; smaller traders, join the swing trade robbery with a trailing SL to lock in gains. 💰
Market Outlook 💵:
GBP/AUD is riding a bullish wave, fueled by fundamentals, macro trends, COT reports, quantitative analysis, sentiment, and intermarket dynamics. Stay updated as these can shift fast! 🌎📊
⚠️ Trading Alert: News & Position Management 📰:
Avoid new trades during news releases to dodge volatility traps.
Use trailing stop-loss orders to protect running positions and secure profits. 🚫
Latest Market Data (UTC+1, May 20, 2025, 12:02 PM BST):
Forex (GBP/AUD): Current price ~2.09850 (source: financialjuice.com).
COT Report (Latest Friday, May 16, 2025):
Non-commercial long positions increased, signaling bullish sentiment among large speculators.
Net long positions rose by 5,200 contracts (source: CFTC.gov).
Commodities & Metals: Gold and oil prices stable, supporting AUD strength but GBP bolstered by UK economic data.
Indices & Crypto: No direct impact, but risk-on sentiment in global indices supports bullish GBP/AUD bias.
💖 Boost the Heist! 💥:
Hit the Boost Button to power up our robbery team! 🤝 With the Thief Trading Style, we’re stealing profits daily. Stay tuned for the next heist plan! 🐱👤🚀
Happy trading, and let’s make that money! 💸🎉
Disclaimer: Trading involves risk. Always manage your risk and stay informed.
Trade
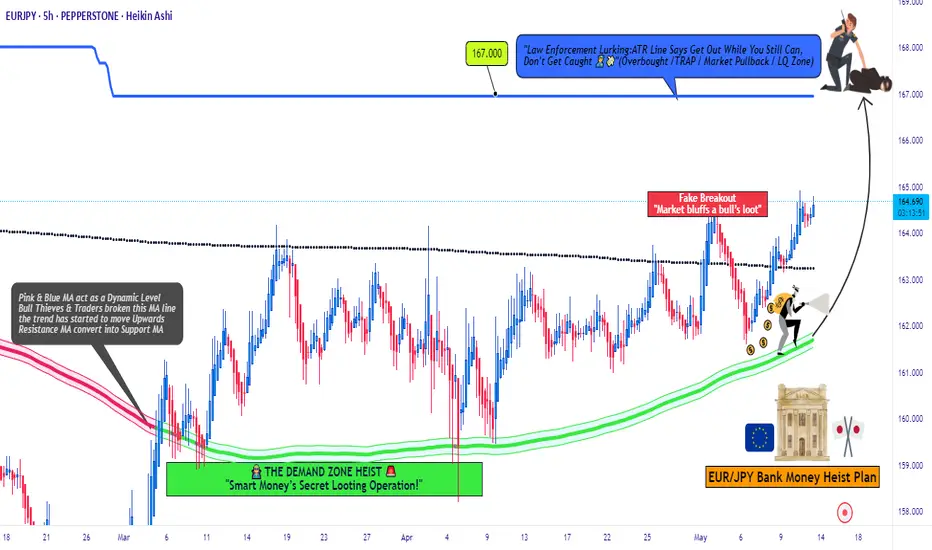
EUR/JPY "Yuppy" Heist: Sniping Swiss Profits with Thief Trading!🌍 Hello Global Traders! 🌟
Money Makers, Risk Takers, and Market Shakers! 🤑💸✈️
Dive into our EUR/JPY "Yuppy" Forex heist, crafted with the signature 🔥Thief Trading Style🔥, blending sharp technicals and deep fundamentals. Follow the strategy outlined in the TradingView chart, focusing on a long entry targeting the high-risk MA Zone. Expect a wild ride with overbought conditions, consolidation, and potential trend reversals where bearish players lurk. 🏆💰 Celebrate your wins, traders—you’ve earned it! 💪🎉
Entry 📈: The vault’s open! Grab bullish opportunities at any price, but for precision, set buy limit orders on a 15 or 30-minute timeframe near swing lows or highs for pullback entries.
Stop Loss 🛑:
📍 Place your Thief SL at the recent swing low on the 4H timeframe (163.00) for scalping or day trades.
📍 Adjust SL based on your risk tolerance, lot size, and number of open orders.
Target 🎯: Aim for 167.00
💵 EUR/JPY "Yuppy" is riding a bullish wave, fueled by key market drivers. ☝
Unlock the full picture—dive into Fundamentals, Macro Insights, COT Reports, Quantitative Analysis, Sentiment Outlook, Intermarket Trends, and Future Targets. Check 👉🌎🔗.
⚠️ Trading Alert: News & Position Management 📰🚨
News can shake the market hard. Protect your trades by:
Avoiding new entries during news releases.
Using trailing stops to lock in profits and shield running positions.
📌 Markets move fast—stay sharp, keep learning, and adapt your strategy as conditions evolve.
💖 Power up our heist! 🚀 Tap the Boost Button to amplify our Thief Trading Style and make stealing profits a breeze. Join our crew, grow stronger, and conquer the markets daily with ease. 🏆🤝❤️
Catch you at the next heist, traders—stay ready! 🤑🐱👤🤩
20.05.25 Morning ForecastPairs on Watch -
FOREXCOM:COFFEE
FX:EURUSD
FX:AUDJPY
A short overview of the instruments I am looking at for today, multi-timeframe analysis down to what I will be looking at for an entry. Enjoy!

Market next move 1. Over-Reliance on Support Zone
The analysis heavily leans on the assumption that the support zone (marked with the purple "Support" label) will hold.
However, this support has already been tested multiple times, which weakens its strength.
A break below this zone could trigger significant stop-loss hunting, leading to a bearish breakdown instead of a bullish reversal.
2. Volume Analysis Suggests Weak Momentum
The recent bounce lacks strong volume. This suggests that buying interest is not convincing at this level.
Without volume confirmation, any bullish move is less likely to sustain.
3. Lower Highs Pattern
Despite small rallies, the chart is forming lower highs, which is typically a bearish signal.
This hints at seller dominance, and the yellow bullish projection might be overly optimistic.
4. Resistance Overhead
The price is approaching a short-term resistance zone (red box), which has rejected the price previously.
Without a clear breakout above that, the bullish case is speculative.
5. Fundamental Factors Unaccounted
The chart doesn’t account for macro factors like U.S. dollar strength, interest rates, or geopolitical influences that often affect gold.
If the dollar strengthens, gold may drop, breaking the support.
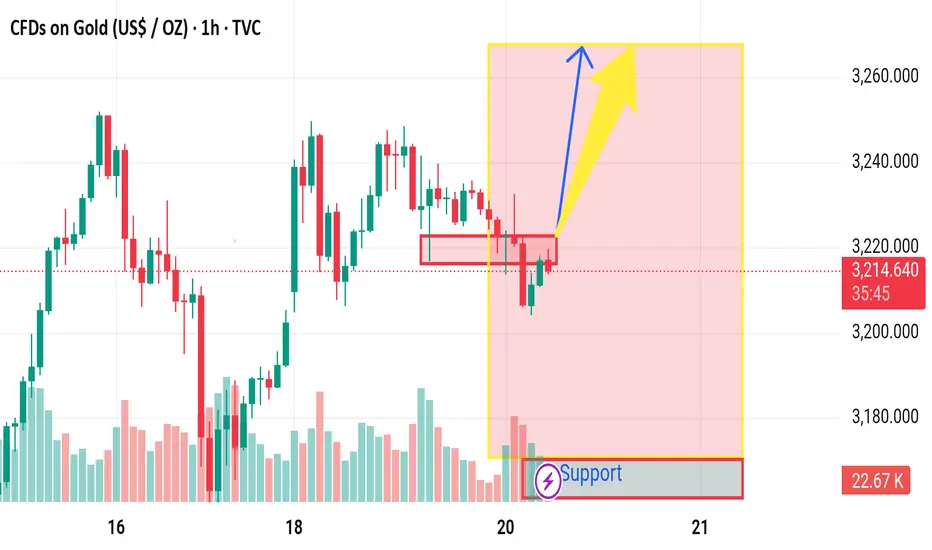
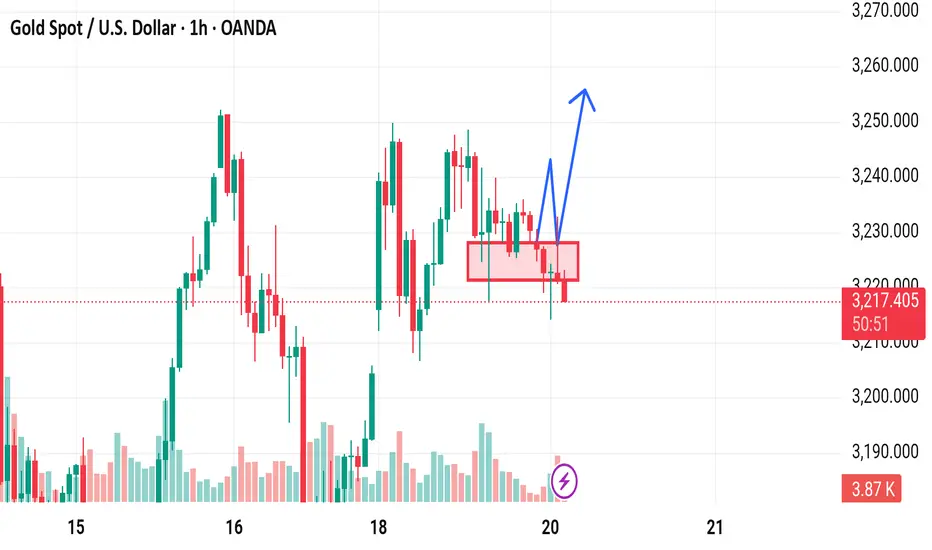
Market next move Bearish Disruption Analysis:
1. Range Weakness and Exhaustion Risk:
The price has been ranging within a tight zone, and repeated tests of the support line near 3,215–3,218 show weakening buyer pressure.
If bulls were strong, we might have already seen a breakout with momentum. Instead, there's sideways choppiness, suggesting indecision or exhaustion.
2. Lower Highs Forming:
Despite a flat support zone, price is forming lower highs, a bearish signal. Sellers are stepping in earlier on each bounce, tightening the range from the top.
3. Volume Depletion:
Volume is gradually dropping during this consolidation. If a breakout happens without a volume surge, it risks becoming a false breakout.
4. Liquidity Sweep Possibility:
Market makers might push price below the support zone (~3,215) to trigger stop-losses and accumulate orders before a potential real breakout. This would trap late buyers who enter early.
5. Bearish Scenario Path:
If price breaks below 3,215 and closes under that on decent volume, expect a move to the next demand zone near 3,200 or lower.
Downside target could be around 3,180–3,190, where the previous demand base formed on May 15.
BTCUSD buy opportunity next target The zone near 105,998 has been marked as a key resistance. BTC has previously failed to hold above this level, leading to sharp rejections.
Without strong volume confirmation, a breakout above this level may result in another bull trap.

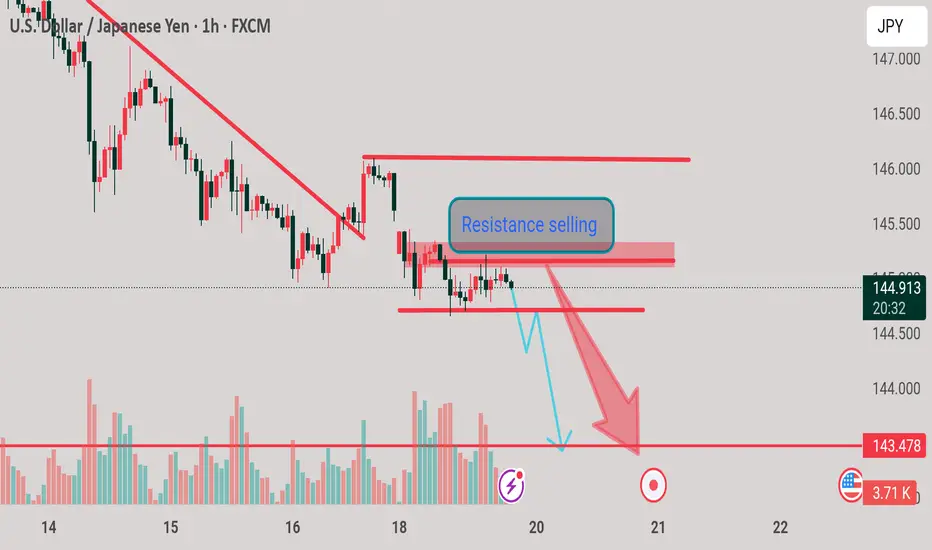
STRANGE down mode opportunity The price has repeatedly tested the lower red support band near 144.00 without breaking below it.
This could signal accumulation or demand absorption, not necessarily weakness.
GBP/JPY Short and CAD/JPY ShortGBP/JPY Short
Minimum entry requirements:
• Corrective tap into area of value.
• 4H risk entry or 1H risk entry after 2 x 1H rejection candles.
Minimum entry requirements:
• Tap into area of value.
• 1H impulse down below area of value.
• If tight non-structured 5 min continuation follows, reduced risk entry on the break of it.
• If tight structured 5 min continuation follows, reduced risk entry on the break of it or 5 min risk entry within it.
• If tight non-structured 15 min continuation follows, 5 min risk entry within it if the continuation is structured on the 5 min chart or reduced risk entry on the break of it.
• If tight structured 15 min continuation follows, reduced risk entry on the break of it or 15 min risk entry within it.
CAD/JPY Short
Minimum entry requirements:
• Corrective tap into area of value.
• 4H risk entry or 1H risk entry after 2 x 1H rejection candles.
Minimum entry requirements:
• Tap into area of value.
• 1H impulse down below area of value.
• If tight non-structured 5 min continuation follows, reduced risk entry on the break of it.
• If tight structured 5 min continuation follows, reduced risk entry on the break of it or 5 min risk entry within it.
• If tight non-structured 15 min continuation follows, 5 min risk entry within it if the continuation is structured on the 5 min chart or reduced risk entry on the break of it.
• If tight structured 15 min continuation follows, reduced risk entry on the break of it or 15 min risk entry within it.

19.05.25 Morning ForecastPairs on Watch -
FX:GBPJPY
FX:CADJPY
FOREXCOM:COFFEE
A short overview of the instruments I am looking at for today, multi-timeframe analysis down to what I will be looking at for an entry. Enjoy!

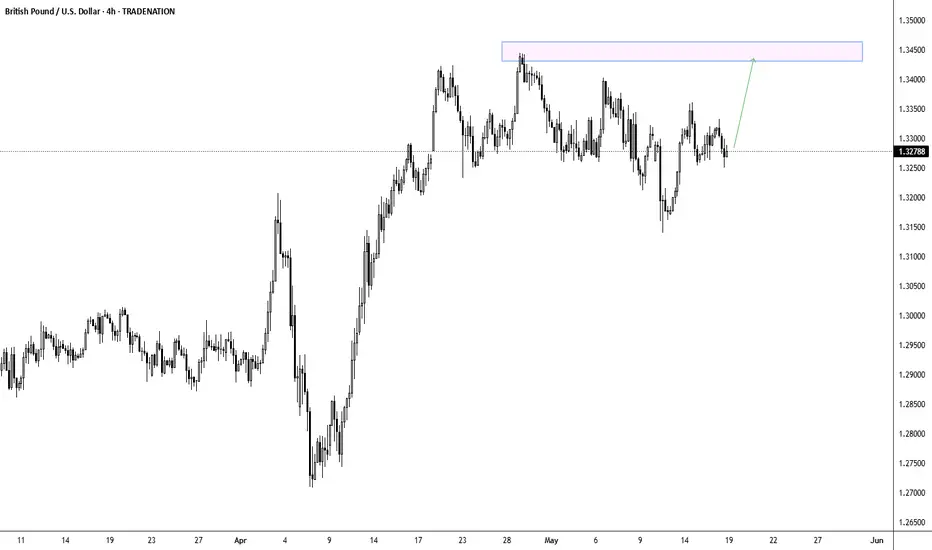
GBPUSD - Double Top Formation in Focus?The GBP/USD pair is currently trading at 1.3278, showing signs of consolidation within a well-established range after recovering from the early April lows near 1.2700. Price action over the past month has created a series of higher lows while repeatedly testing resistance in the 1.3400-1.3450 zone highlighted by the light blue rectangle. The higher probability scenario suggests that cable is likely to make another push toward this critical resistance area, potentially forming a double top with the early May peak around 1.3450. This technical formation would be significant for traders, as a successful breakout above this double top structure could trigger a substantial bullish move, while rejection might lead to a deeper correction. However, the current market structure and momentum favor an eventual upside resolution, with the green arrow indicating a potential target above 1.3450 if buyers can muster sufficient strength to overcome this formidable resistance level.
Disclosure: I am part of Trade Nation's Influencer program and receive a monthly fee for using their TradingView charts in my analysis.
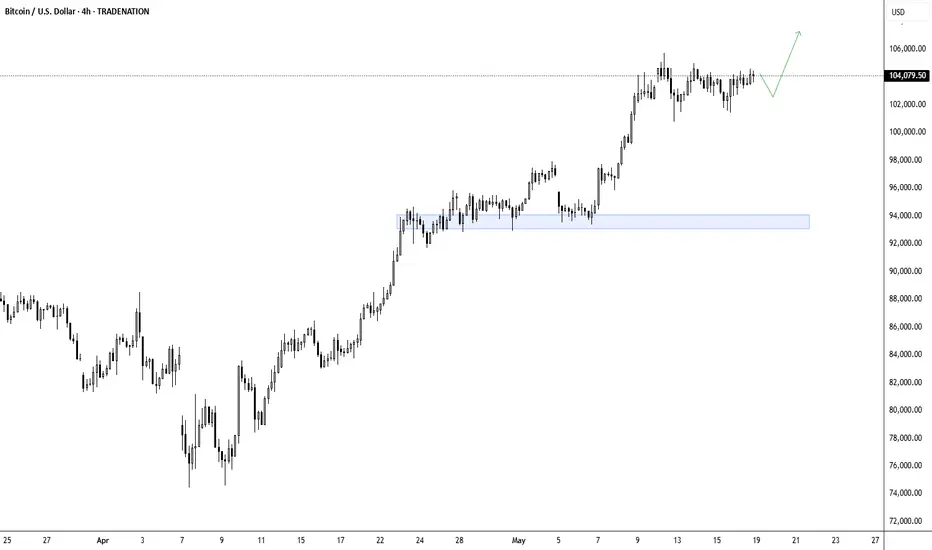
BTCUSD - Poised for New HeightsBitcoin is currently trading at $104,079.50, consolidating near all-time highs after an impressive rally from the April lows around $75,000. The price action has formed what appears to be a bullish flag pattern over the past week, suggesting a period of healthy consolidation before the next leg higher. While a short-term pullback toward the support zone highlighted in blue around $93,000-$94,000 remains possible, the higher probability scenario strongly favors a trend continuation to the upside, potentially targeting the $107,000-$108,000 range as indicated by the green arrow. The overall market structure remains decisively bullish, with Bitcoin maintaining positions above key psychological levels and showing resilience during minor corrections. Traders should view any potential dips as buying opportunities within this established uptrend, given Bitcoin's sustained momentum and the strong support zone that has formed from prior resistance levels.
Disclosure: I am part of Trade Nation's Influencer program and receive a monthly fee for using their TradingView charts in my analysis.
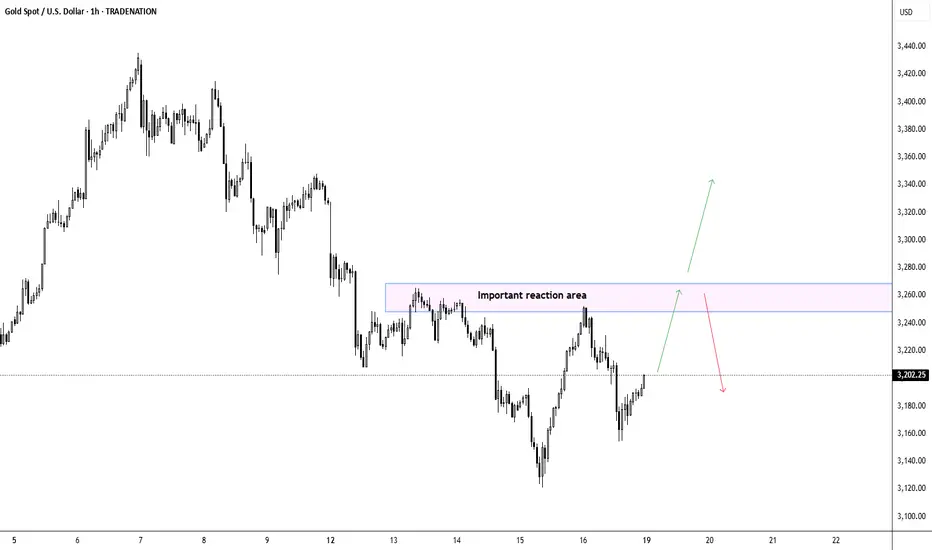
XAUUSD - Critical Reaction Zone to Determine Next Major MoveGold is currently trading at $3,202.25, showing recovery momentum after forming a recent bottom near $3,120. The price action suggests a continued upward movement toward the highlighted "important reaction area" around $3,240-3,260, which previously served as both support and resistance in mid-May. There is a high probability that price will reach this critical zone given the current bullish momentum and the established pattern of higher lows. Once gold reaches this reaction area, traders should exercise patience and closely observe how price behaves – a decisive break above could trigger an extended rally toward $3,360 as indicated by the upper green arrow, while rejection might initiate a significant correction toward $3,140 as marked by the red arrow. The market's response at this important reaction area will likely determine gold's directional bias for the next trading period, making it essential to watch for specific candlestick patterns, volume spikes, or momentum shifts before establishing new positions.
Disclosure: I am part of Trade Nation's Influencer program and receive a monthly fee for using their TradingView charts in my analysis.
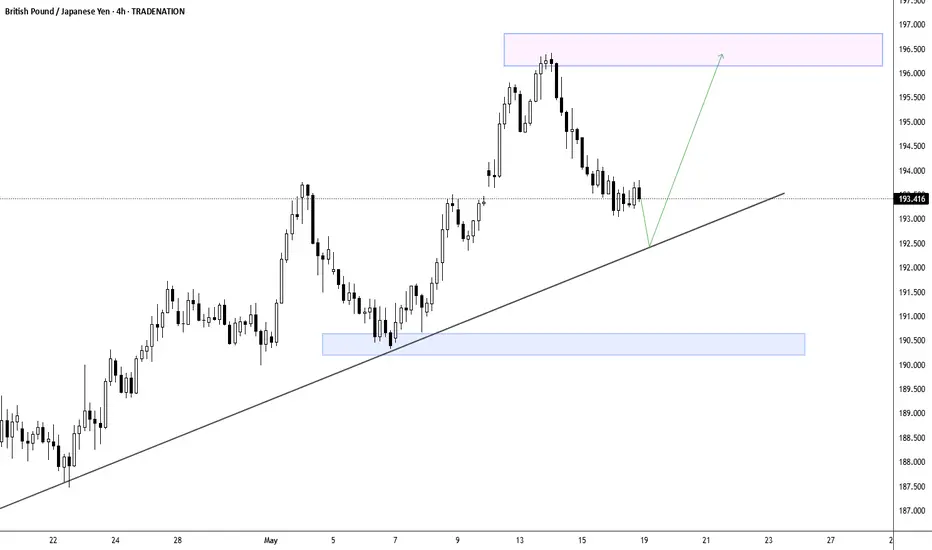
GBPJPY - Poised for Rebound at Major Trendline Support?The GBP/JPY pair is currently trading around the 193.41 level, showing consolidation after a notable correction from its recent peak of approximately 196.30. The clearly defined ascending trendline, which has supported price action since mid-April, remains the critical technical feature to monitor. As the price approaches this trendline support, traders should watch for potential bullish reactions that could propel the currency pair back toward the upper resistance zone marked by the pink rectangle near 196.50. The green arrow suggests a potential path forward with an expected bounce from the trendline followed by renewed upward momentum. However, any decisive break below this trendline would invalidate the bullish structure and possibly trigger a deeper correction toward the lower support zone around 190.50, highlighted by the light blue rectangle.
Disclosure: I am part of Trade Nation's Influencer program and receive a monthly fee for using their TradingView charts in my analysis.
USDJPY - Trendline Support to Determine Next Big MoveThe USD/JPY pair has been trading within a well-defined upward trajectory, currently testing key levels around 145.68. The diagonal trendline visible on the chart serves as a critical support level that has consistently propelled the pair higher since mid-April. Should the price respect this trendline in the coming sessions, we could see a temporary pullback before potentially rallying toward the resistance zone around 148.50, highlighted by the upper purple rectangle. However, traders should closely monitor any breaks below this trendline as it would signal a significant shift in momentum and possibly indicate a deeper correction. The pair appears to be consolidating after the recent pullback from May highs, with the trendline interaction likely determining the next directional move.
Disclosure: I am part of Trade Nation's Influencer program and receive a monthly fee for using their TradingView charts in my analysis.

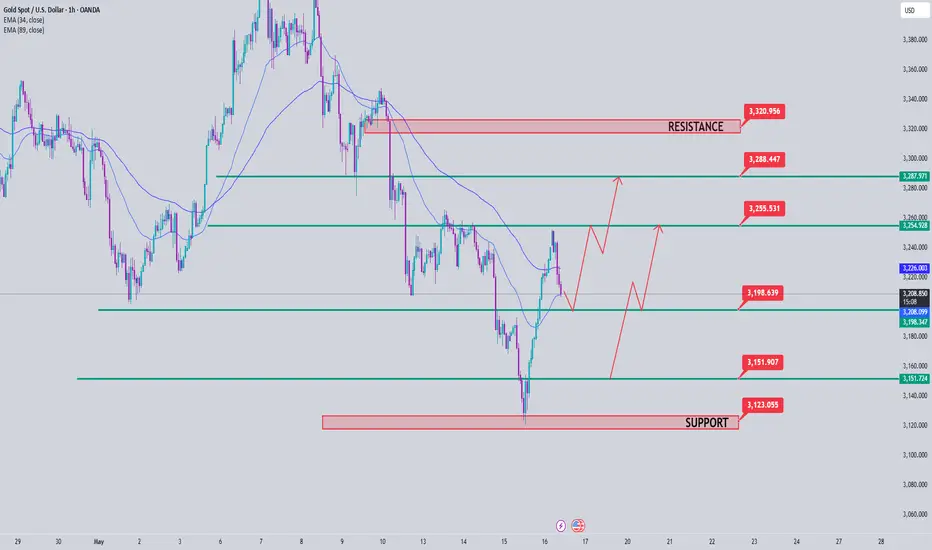
Gold Price Analysis May 16Yesterday's D1 candle pulled back within the uptrend with a liquidity sweep to 3121. Today there is unlikely to be a sell-off and the price will continue to return in the uptrend.
Today, it is better to mainly look for retest points for BUY signals.
In the immediate future, 3198 is the first BUY zone that the Asia-Europe session can consider. When breaking this zone, buy entries may not carry long TP expectations. The Breakout zone of 3153 and the bottom zone of 3125 are two important supports to prevent the gold price from a downward slide.
In the opposite direction, the Asian session resistance zone around 3254 also acts as an immediate barrier for the gold price increase. Break 3254 should not BUY until the 3288 zone before SELL Scalping can be done. The upper barrier of the Daily Frame is at 3320.
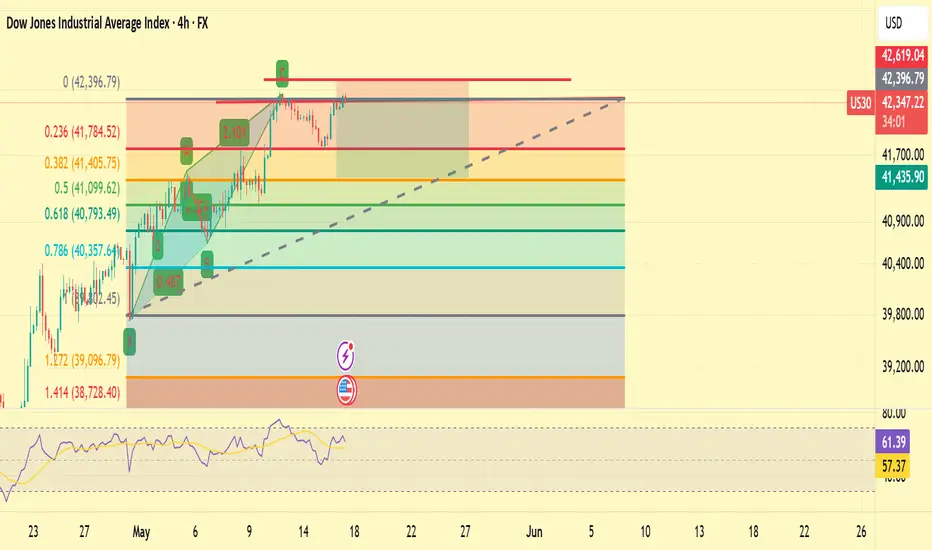
US30 SHORT1. This is the deciding factor as it is at the high created last week and should have a lot of resistance
2. M15, M30 and H1 are overbought and there is a double top with divergence
3. This is a type 2 pattern on H4 however there is a smaller pattern on M15 below
4. Stop loss of 200 pips
Global gold rises over 1% as the US dollar and US economic data Global gold OANDA:XAUUSD rises over 1% as the US dollar and US economic data weaken
Gold prices rose more than 1% on Thursday (May 15), supported by a weaker US dollar and weak US economic data, while Russian President Vladimir Putin’s absence from peace talks prompted some safe-haven buying.
At the close of trading on May 15, spot gold $TVC:XAU-AMEX:USD contracts gained 1.2% to $3,226.6 per ounce, after touching a more than one-month low earlier in the session. Gold FX:XAUUSD futures advanced nearly 1% to $3,218.70 per ounce.
The US dollar index fell 0.1%, making gold, which is priced in the greenback, less expensive for holders of other currencies.
Data showed that the US Producer Price Index (PPI) unexpectedly declined in April, while retail sales growth slowed. Earlier this week, a report showed that the Consumer Price Index (CPI) rose less than forecast in April.
The market is pricing in the expectation that the US Federal Reserve (Fed) will cut interest rates in September. Lower interest rates boost gold’s appeal as it is a non-yielding asset.
Thursday’s data added to the chances of a Fed rate cut, with more dovish expectations forming in the market.
Gold is under pressure as the US dollar strengthensGold $TVC:XAU-AMEX:USD is under pressure as the US dollar strengthens and trade optimism spreads across the market. Prices slipped slightly early Wednesday as investors took profits after a rise from last week’s lows. Although US inflation came in lower than expected, the Fed’s lack of plans to cut interest rates anytime soon keeps gold OANDA:XAUUSD from gaining momentum. At the same time, optimism about new trade agreements between the US, China, the UK, and other countries, along with hopes for peace talks between Russia and Ukraine, are reducing demand for gold as a safe-haven asset.
Technically, the overall trend looks bearish. There’s no significant rebound from the support zone, indicating that selling pressure still dominates. Currently, prices are consolidating sideways before potentially testing the 3200 level.
Key resistance levels are at 3243, 3257, and 3269, while support is concentrated around 3222 and 3200.
If prices continue to fluctuate within the current range and test the 3222-3200 support zone, the downtrend is likely to persist in the short to medium term. However, it’s important to note that the market may create short-term “short squeezes” around resistance zones to challenge traders before prices fall further.
Wishing everyone successful and effective trading!
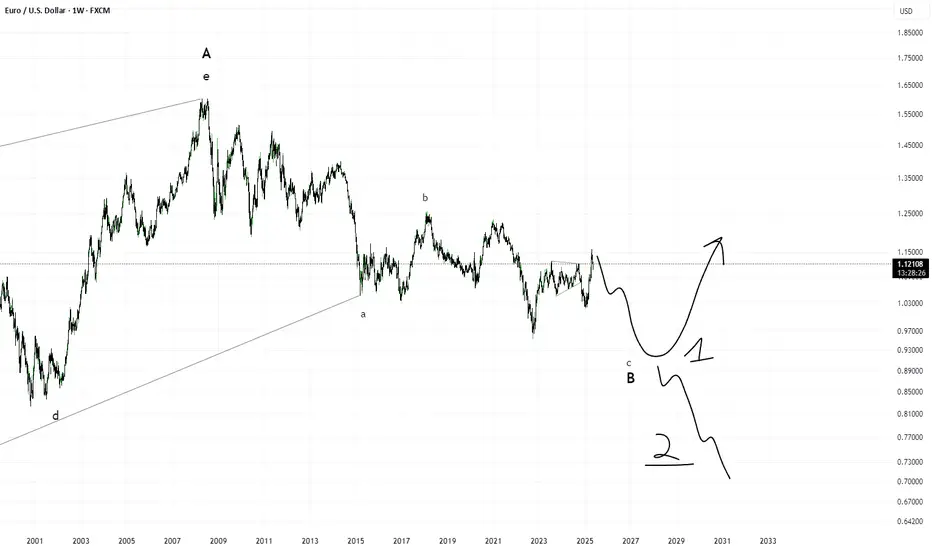
EUR IS DANGER!!!!We are in the final phase of a major correction that has been ongoing for over 10 years. Prepare for significant instability in this region!!!!!! And take care of yourselves.
The only way this scenario would be invalidated is if the 1.26 mark is crossed — which is highly unlikely.

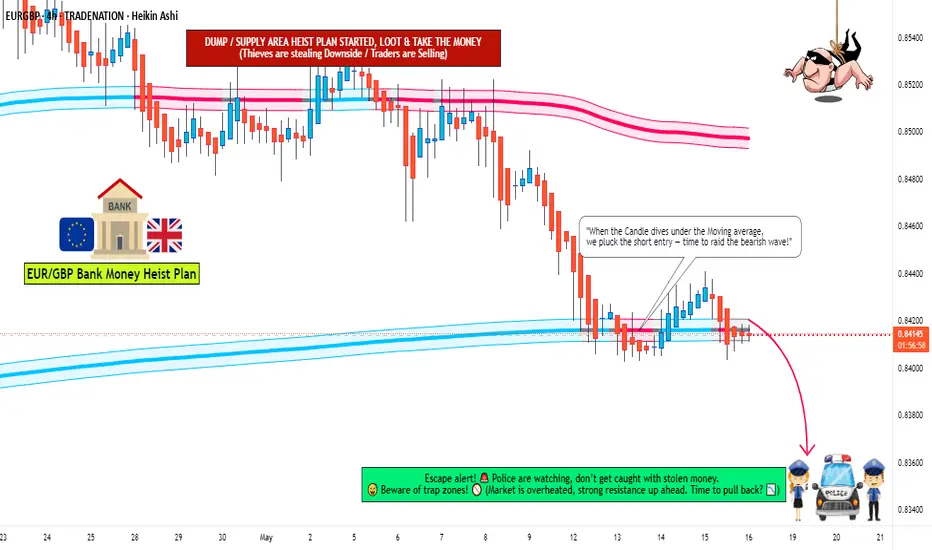
EUR/GBP Caper: Bearish Breakout Blueprint!🌍 Greetings, global money heisters! 🌟 Welcome to the EUR/GBP "Chunnel" Forex Market caper! 🤑💸
Dear traders and fortune chasers, get ready to execute our cunning plan based on the 🔥 Thief Trading Style 🔥, blending sharp technicals with savvy fundamentals. Our mission? A slick short entry targeting the high-risk Support Zone. The market’s oversold, consolidation’s brewing, and a trend reversal’s lurking—perfect for our ambush! 🏆🎯 Here’s the blueprint to steal those pips! 🚀
Entry 📈: The heist kicks off at the Major Support breakout. Lock in your sell at 0.84000 for bearish gains! 💰 For precision, set sell stop orders above the Moving Average or sell limit orders post-breakout within a 15/30-minute window near the swing low/high for pullback entries. 📌 Pro tip: Set a chart alert 🚨 to catch the breakout moment!
Stop Loss 🛑: Stay sharp, crew! For sell stop orders, hold off on placing your stop loss until the breakout confirms. 📍 Place it at the nearest swing high/low on the 4H timeframe (0.84400) for swing/day trades. Adjust based on your risk, lot size, and multiple orders. Play smart—your capital, your rules! ⚠️🔥
Target 🎯: Aim for 0.83500 or slip out early if the market whispers an escape. 🏃♂️💨
💵 Why’s the Chunnel ripe for the taking? The EUR/GBP’s in a bearish groove, driven by key market signals. Curious? Dive into the fundamentals, COT reports, sentiment, and intermarket analysis for the full scoop! 🌎🔗 Check linkk macro trends and future targets & overall score. 📊
⚠️ Trading Alert: News can shake the market like a getaway car! 📰🚗 Avoid new trades during high-impact releases and use trailing stops to lock in profits and shield your positions. Safety first, heisters! 🚫🔐
💖 Boost our heist! Hit that Boost Button 🚀 to fuel our Thief Trading crew. With daily market raids, we’re stacking pips and living the trader’s dream! 🤑🤝 Stay tuned for the next caper—more profits await! 🐱👤🎉
Happy heisting, and let’s make those charts bleed green! 💪🌟
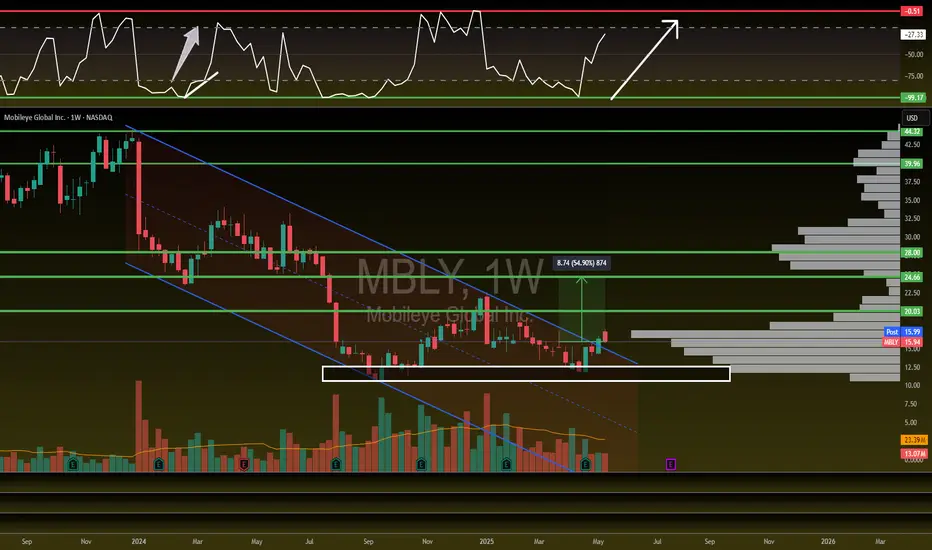
Hello...old friend $MBLY = 55%+ Upside!Hello...old friend NASDAQ:MBLY
Breaking out of Bearish weekly downtrend dating back to December 2023!
Coming back to retest...if we bounce of this retest I will be entering Mobileye in the trading portfolio.
Rising Wr$ and Buy signal on H5_L indicator. Finally volume shelf with GAP above!
Targets: $20/ $24/ $28 🎯
A wave of bargain hunting is giving short-term support to gold April’s U.S. CPI came in below expectations, cooling down hopes for Fed rate cuts. The U.S. Dollar index has also eased off its one-month high, while ongoing geopolitical concerns continue to back gold’s rise. On Wednesday morning (May 14), spot gold traded in a narrow range around $3,245 per ounce.
Inflation Data
April’s U.S. CPI rose only 0.2%, less than the expected 0.3%. This boosted gold as it doesn’t reduce the chances of Fed rate cuts, with markets still expecting cuts to continue in September. However, inflation could pick up again in the coming months due to tariff effects, so many investors still see gold as a solid hedge against inflation.
On Tuesday, both Do Nam Trung and Trump called on the Fed to cut rates.
Geopolitical Situation
Geopolitical tensions remain a strong support for gold. Talks between Ukraine and Russia are still uncertain, and although the India-Pakistan conflict has paused with a ceasefire, tensions haven’t eased much. These risks keep gold’s upside potential alive if markets face sudden shocks.
Gold Outlook
Gold faces three main challenges:
Progress in U.S.-China trade talks — even with a 90-day truce, tariffs remain in place.
Fed monetary policy — mild inflation data could pave the way for rate cuts.
Global geopolitical risks — especially the Russia-Ukraine peace talks and India-Pakistan tensions.
There’s little major economic data today. U.S. Secretary of State Rubio will attend a NATO meeting to discuss security priorities and the Russia-Ukraine war, while several Fed officials will speak, so investors should stay alert.
Technical Analysis (XAU/USD)
On the daily chart, gold is trading within a narrow range with short-term bearish pressure from the 21-day EMA. The 0.50 Fibonacci retracement near $3,228 is key support limiting further drops. If this level breaks, gold could fall toward $3,163.
For a new uptrend, gold needs to climb above the EMA21 and break through the $3,300 level.
Key levels to watch:
Support: 3,228 – 3,200 – 3,163 USD
Resistance: 3,245 – 3,292 – 3,300 USD
Wishing you a productive and successful trading day!