Market breakdown: SPY & Current TradesIn today’s update, I go over the general outlook on the indexes, focusing on SPY, Nasdaq, and Dow Jones — all still moving in bullish confluence. Even after three distribution days, there’s been no major downside move, but we are seeing drying volume, so caution is key.
I also break down some of my current trades:
A few aren't performing as expected, and that’s part of trading. We won’t win every setup, and that’s okay.
Red-marked trades have been removed from the watchlist and will be monitored closely for irrational moves. I may cut losses if needed.
Green-marked trades are still active and aligned with my criteria, so I’ll likely continue to invest in them.
Lastly, I cover a trade that recently hit my take-profit (TP), specifically KEROS, which has now also been removed from the list. ✅
Thanks for watching another one of my videos, I hope you gained value from the breakdown!
Comment below if you have questions or your own thoughts on the market.
Let’s grow together.
Tradebreakdown

+4R Tricky NZDUSD BreakdownAnother trade breakdown
☝️Do not act based on my analysis, do your own research!!
The main purpose of my resources is free, actionable education for anyone who wants to learn trading and improve mental and technical trading skills. Learn from hundreds of videos and the real story of a particular trader, with all the mistakes and pain on the way to consistency. I'm always glad to discuss and answer questions. 🙌
☝️ALL ideas and videos here are for sharing my experience purposes only, not financial advice, NOT A SIGNAL. YOUR TRADES ARE YOUR COMPLETE RESPONSIBILITY. Everything here should be treated as a simulated, educational environment. Important disclaimer - this idea is just a possibility and my extremely subjective opinion. Do not act based on my analysis, do your own research!!

➡️+5RR Trade Breakdown (4 min.)A quick breakdown of a recently called trade.. Follow, like, comment. Thank you for your support

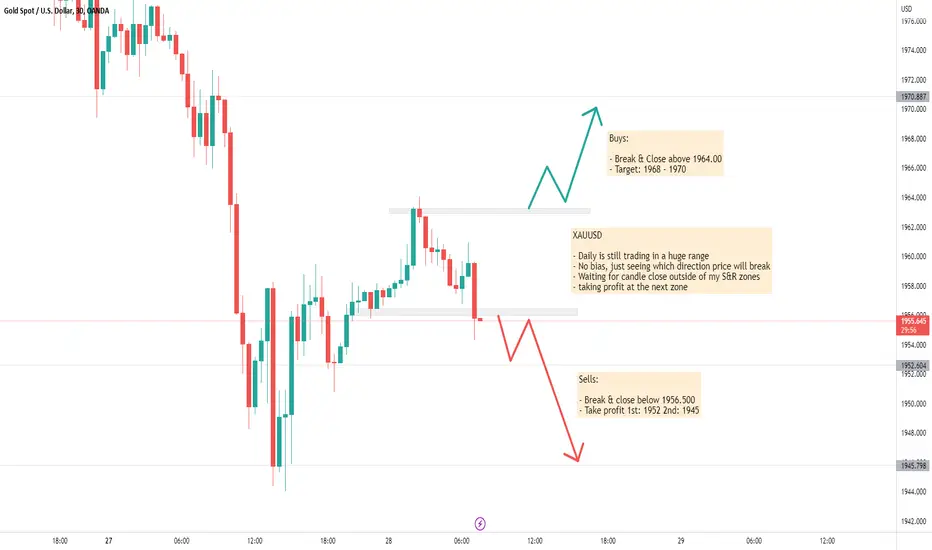
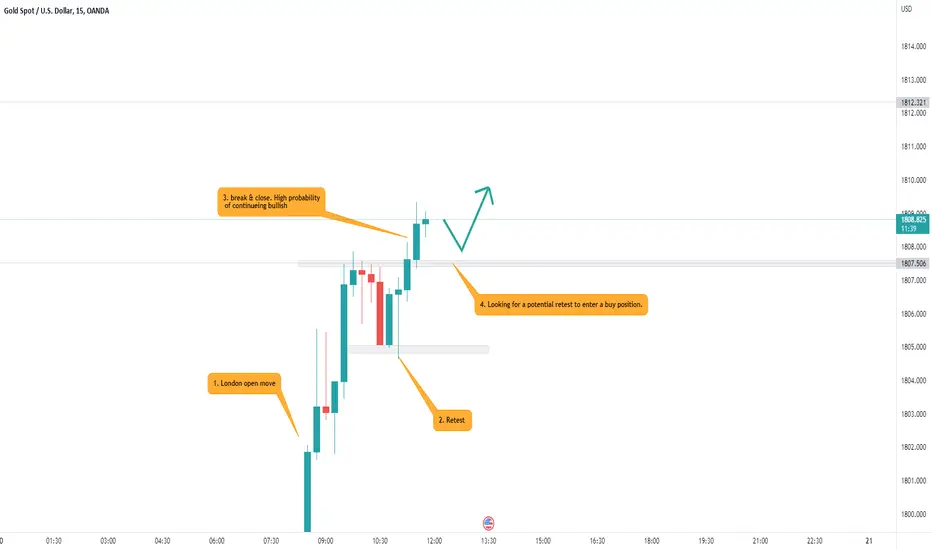
XAUUSD Pre-London 28th March 2023Summary;
- Daily is in a huge range
- Taking Scalp-Intra day trades in either direction
- Looking for breakouts using candlestick confirmations
- Taking profit at the next available zone
Note:
- Volume is key to breakout trades
- big candle body = volume
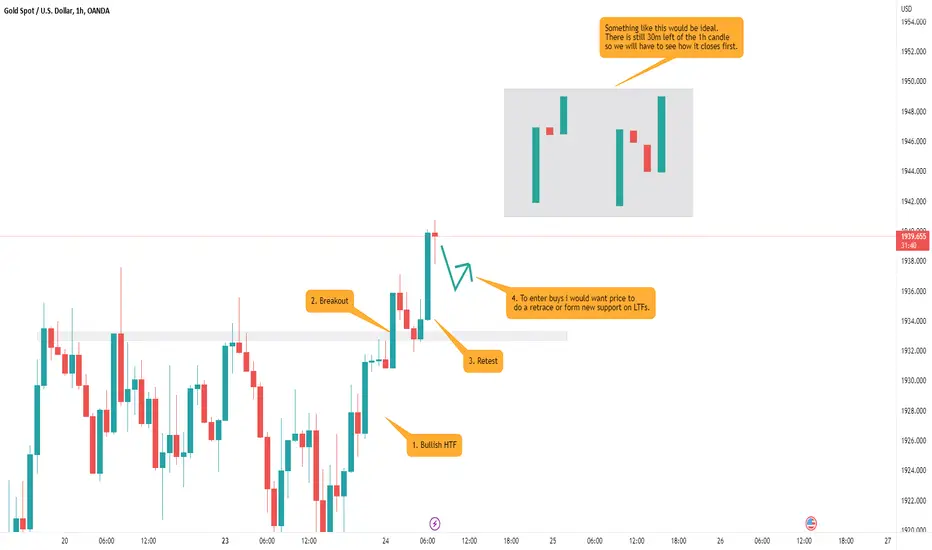
XAUUSD Pre-London Analysis (24th Jan 2023)Summary:
*HTF are bullish, looking for buys
* Need price to retrace or form new support to have a good entry
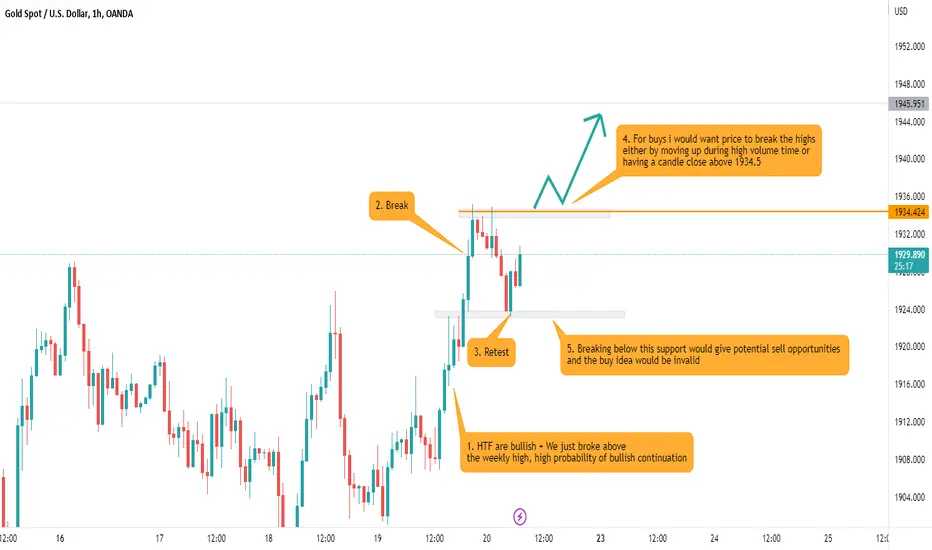
XAUUSD Pre-London Analysis (19th Jan 2023)Summary:
* HTF are bullish
* Break and retest structure
* Looking for break of the new highs for a continuation
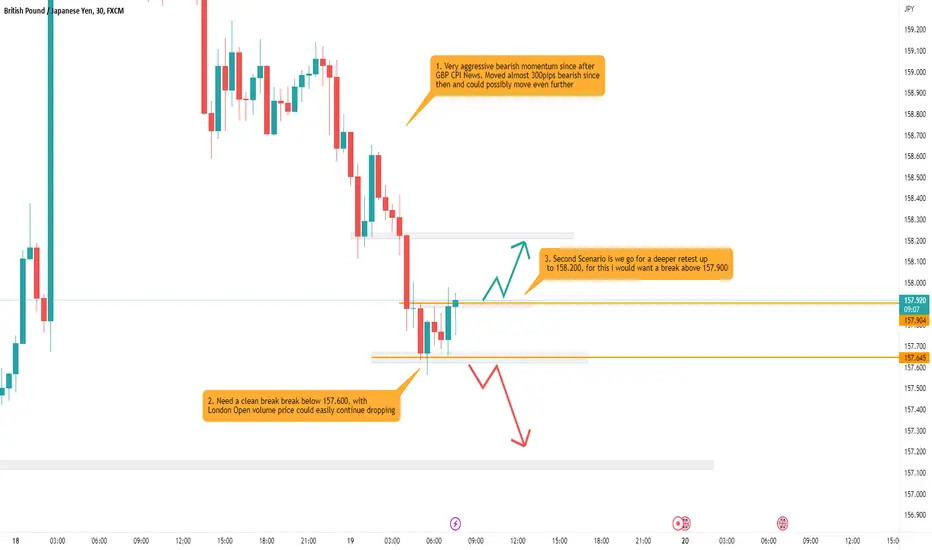
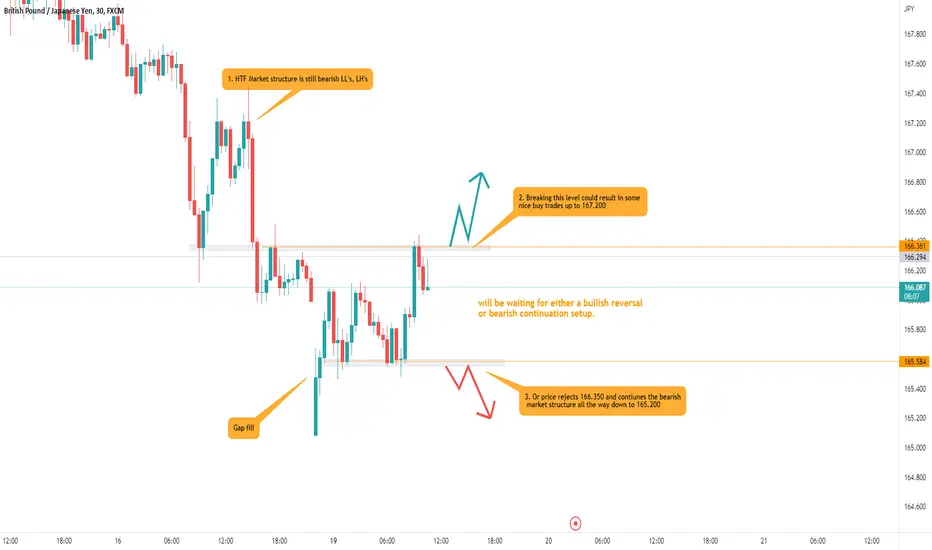
GBPJPY Pre-London Analysis (19th Jan 2023) Summary:
* Bearish since CPI News
* Already Moved 300+ Pips bearish
* We could either go for a retrace at this point or go deeper bearish.
* watch price during the next hour or two see what it does. React dont predict
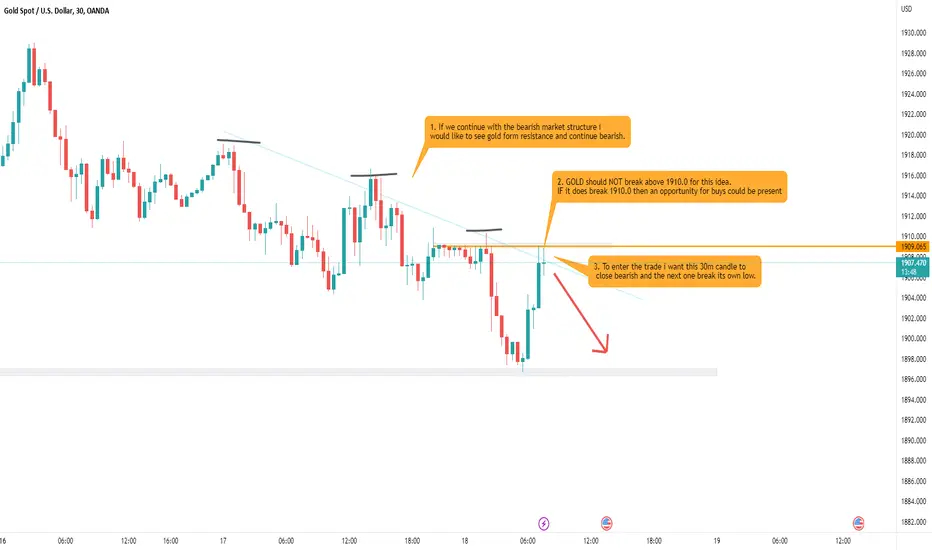
XAUUSD Pre-London Analysis (18th Jan 2023)Summary:
*Bearish Market Structure (LH,LL)
*Price is at resistance
* IF we reject this resistance & respect the bearish structure i expect gold to bearish
* IF we break above 1910.0 this idea is invalid.
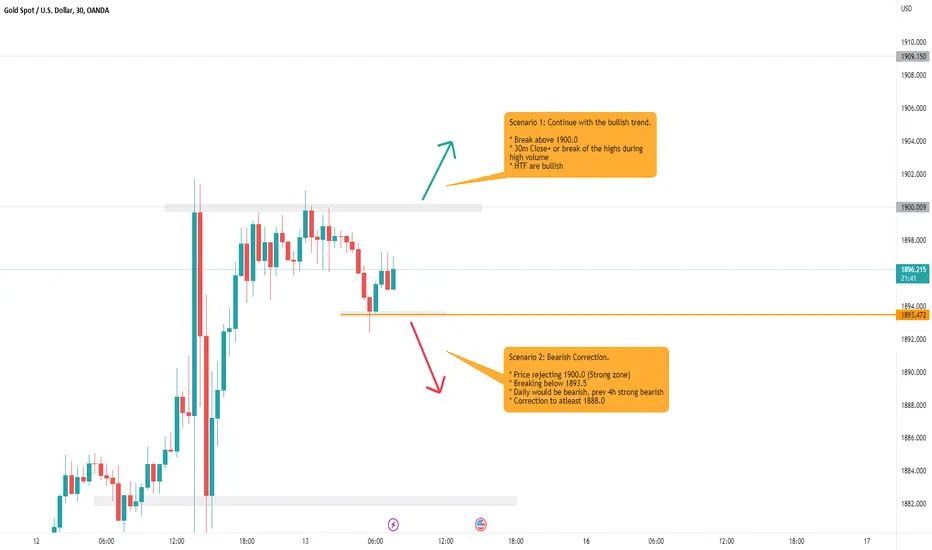
XAUUSD Pre-London Analaysis (13th Jan 2023)Summary:
* Gold has pushed up to 1900.0 which is a strong zone
* Waiting to see if we get a correction during london session
OR we break that level and continue further
* See chart for my plan & confirmations for both outcomes
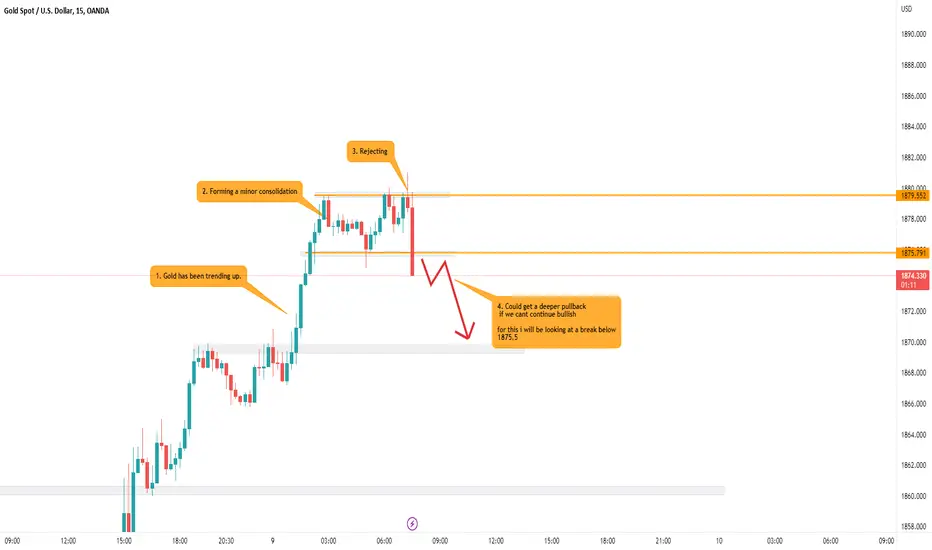
XAUUSD Pre-London Analysis (9th January 2023)Summary:
* Gold bullish on HTF
* Rejecting resistance
* 4H bearish
* Potential for a deeper retrace, if not be looking for continuation buys
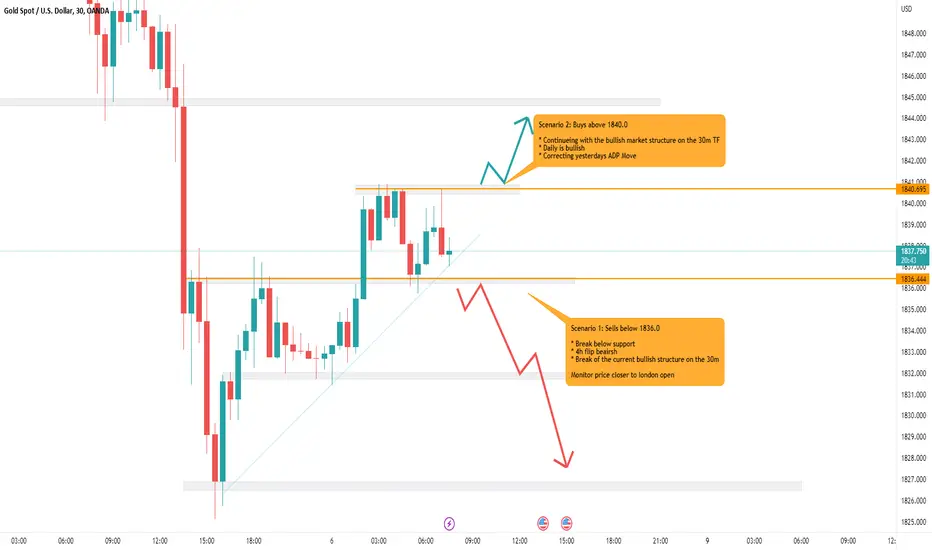
XAUUSD Pre-London Analysis (6th Jan 2023)Summary:
* LTF are forming bullish structure
* Already corrected most of ADPs Move
* Price will either break sturcture to go bearish since 1840 is a strong level
* Or price will continue to further correct the move up to 1845.0
Waiting for London Open to bring the move
NOTE: Lots of news later on today aswell
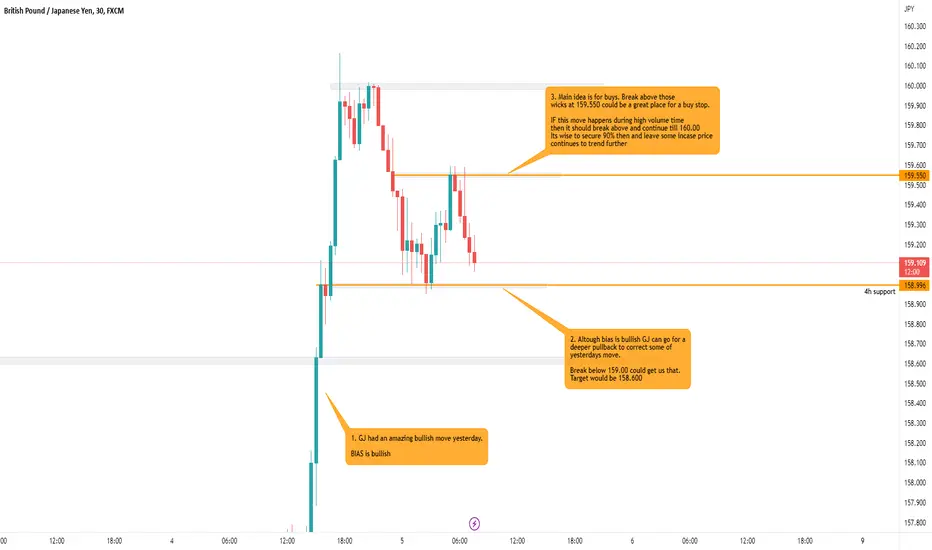
GBPJPY Pre-London Analysis (5th jan 2023)Summary:
*Bias is bullish overall, could go for a deeper pullback after yesterdays huge move
*Break above support or resistance during high volume times is what im looking for
* IF we continue bullish today then its wise to leave runners after securing 90%
XAUUSD Pre-Ny Analysis (20th Dec 2022Summary:
* Daily is bullish
* 4H just flipped bullish
* break & close above resistance
* Waiting for a entry opportunity
GBPJPY Pre-NY Analysis (19th December 2022)Summary:
*HTF are bearish
*Price is at a potential reversal point
*Looking for a break & close in either direction
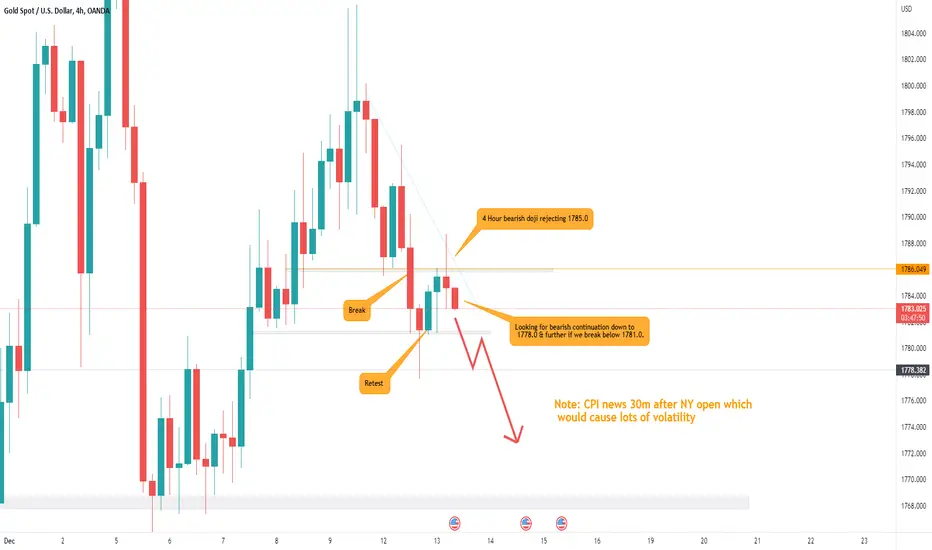
XAUUSD Pre-Ny Analysis (13th December 2022)Summary:
* HTF are pointing bearish
* 4H Just rejected resistance
* Next 4h should give the move im looking for,
if current 4h high gets broken trade is no longer valid
* CPI news coming up aswell
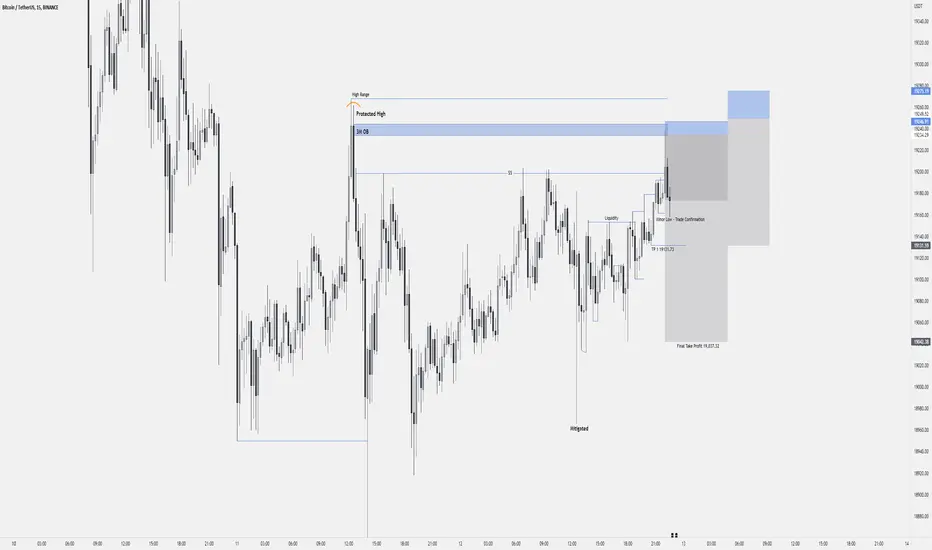
BTC Trade#BTC Short
TPS/SL
2Traders
15M - HTF
1M-3M - LTF
Waiting for Confirmation on LTF ---> going safely into the trade , no worries at all.
Worst case = Stop Loss.
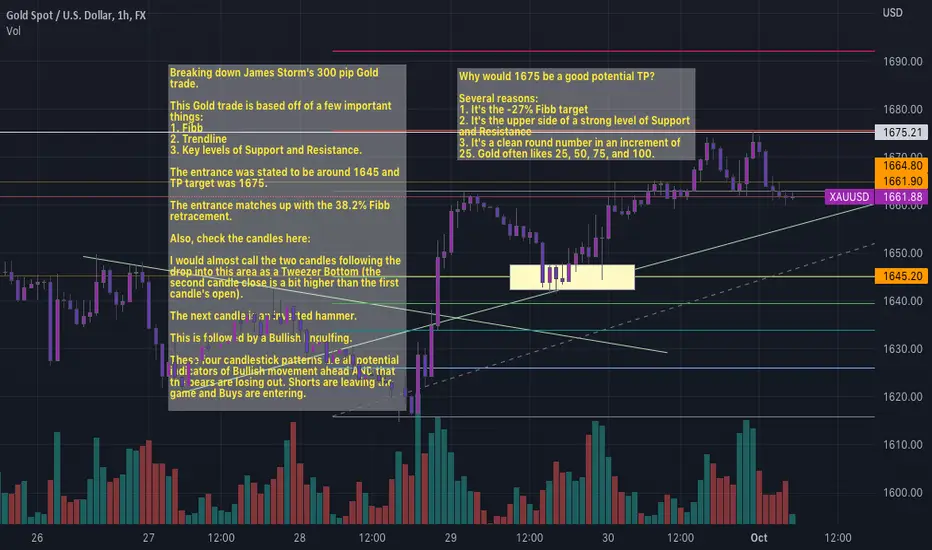
Breaking down James Storm's trade Breaking down James Storm's 300 pip Gold trade.
This Gold trade is based off of a few important things:
1. Fibb
2. Trendline
3. Key levels of Support and Resistance.
The entrance was stated to be around 1645 and TP target was 1675.
The entrance matches up with the 38.2% Fibb retracement.
Also, check the candles here:
I would almost call the two candles following the drop into this area as a Tweezer Bottom (the second candle close is a bit higher than the first candle's open).
The next candle is an inverted hammer.
This is followed by a Bullish Engulfing.
These four candlestick patterns are all potential indicators of Bullish movement ahead AND that the bears are losing out. Shorts are leaving the game and Buys are entering.
Why would 1675 be a good potential TP?
Several reasons:
1. It's the -27% Fibb target
2. It's the upper side of a strong level of Support and Resistance
3. It's a clean round number in an increment of 25. Gold often likes 25, 50, 75, and 100.
Bro's a fantastic trader.
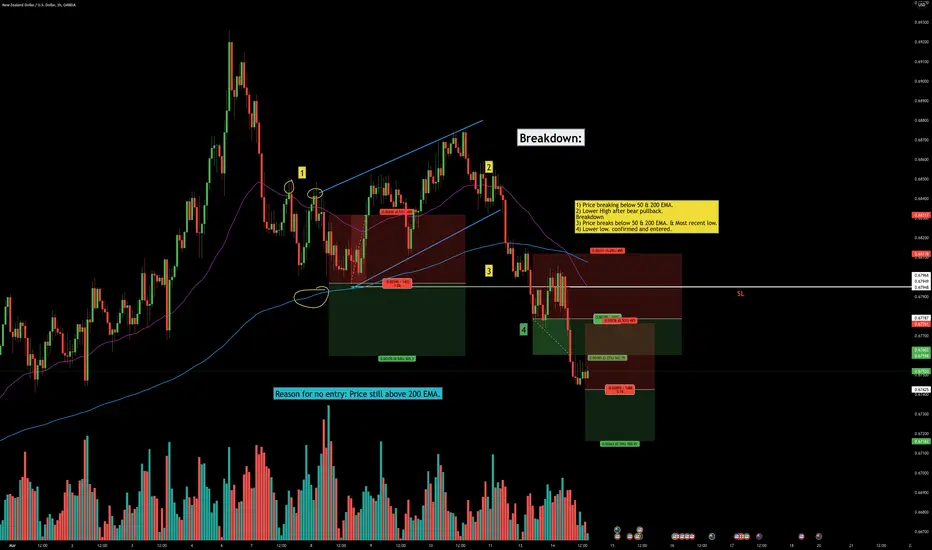
NZDUSD ShortBreakdown of NZDUSD.
First entry was no entry. Just used the short tool to gage entry levels for future entries. - Did not take that because PA stayed above 200 EMA (Light blue line).
1) Price breaking below 50 & 200 EMA.
2) Lower High after bear pullback.
Breakdown
3) Price breaks below 50 & 200 EMA. & Most recent low.
4) Lower low. confirmed and entered.
5 ) Waiting for second live entry if price creates a Lower low.
EurUsd trade breakdown and analysis analysisExplained my EU long from today taken on MFF challenge account phase 1. You have also some analysis for tomorrow.

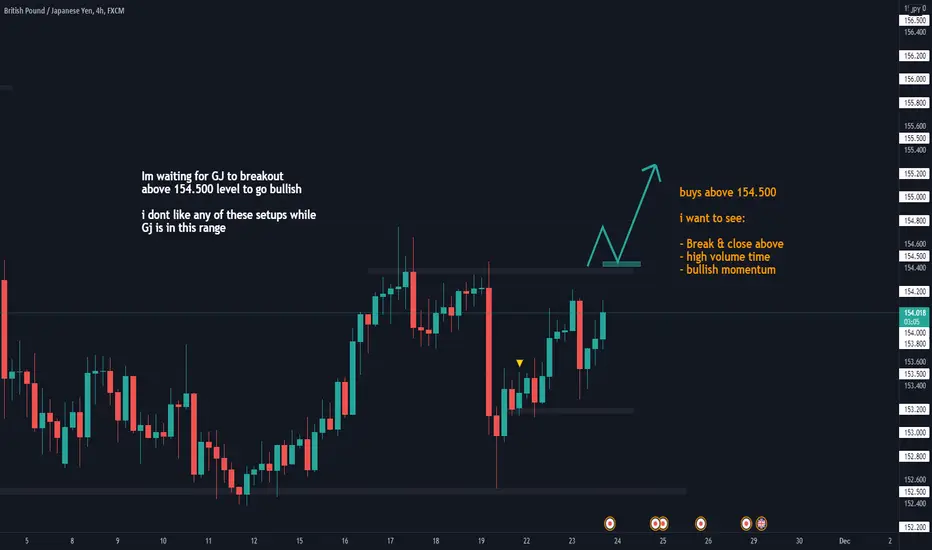
GBPJPY Analysis 23rd NovemberGJ analysis done for tomorrow's trading day (24th November).
NOTE: This analysis is done daily - pre-asian session.
for the next trading day (LONDON-NY Session)