TradeCityPro | Bitcoin Daily Analysis #141👋 Welcome to TradeCity Pro!
Let’s dive into Bitcoin analysis. Yesterday, the exact bearish scenario I told you about happened. Let’s see what opportunities the market is offering us today.
⏳ 4-Hour Timeframe
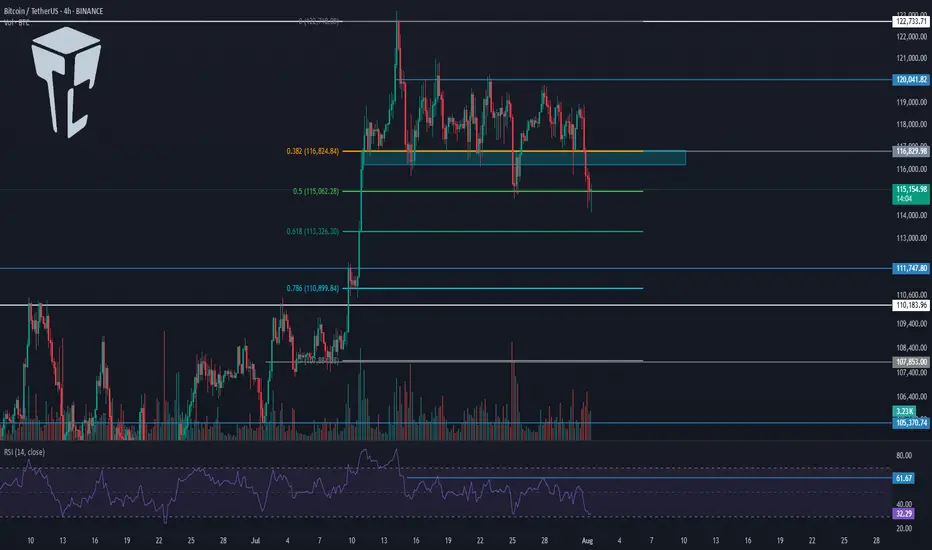
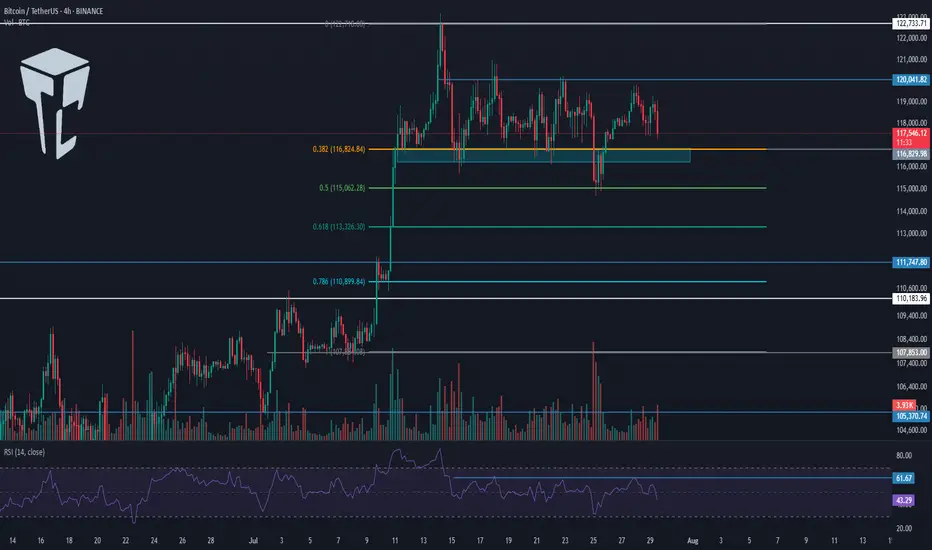
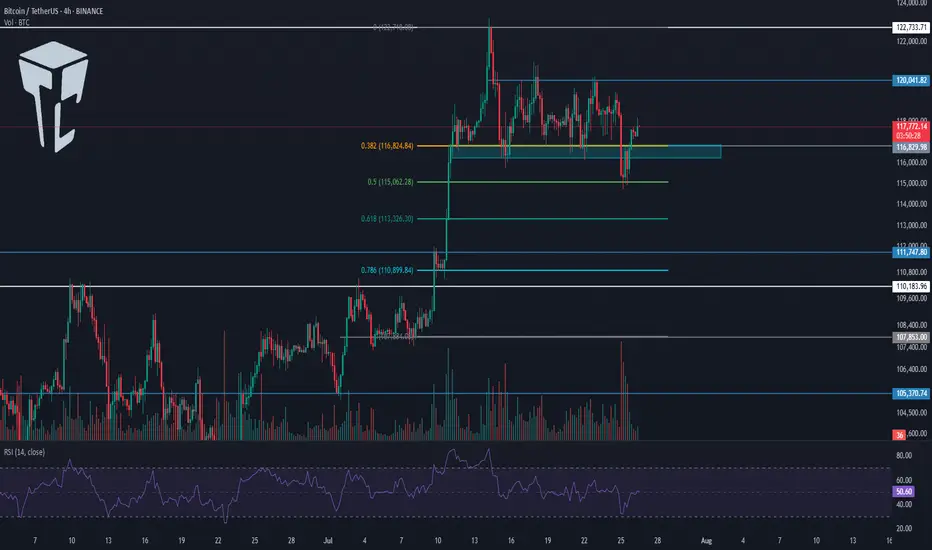
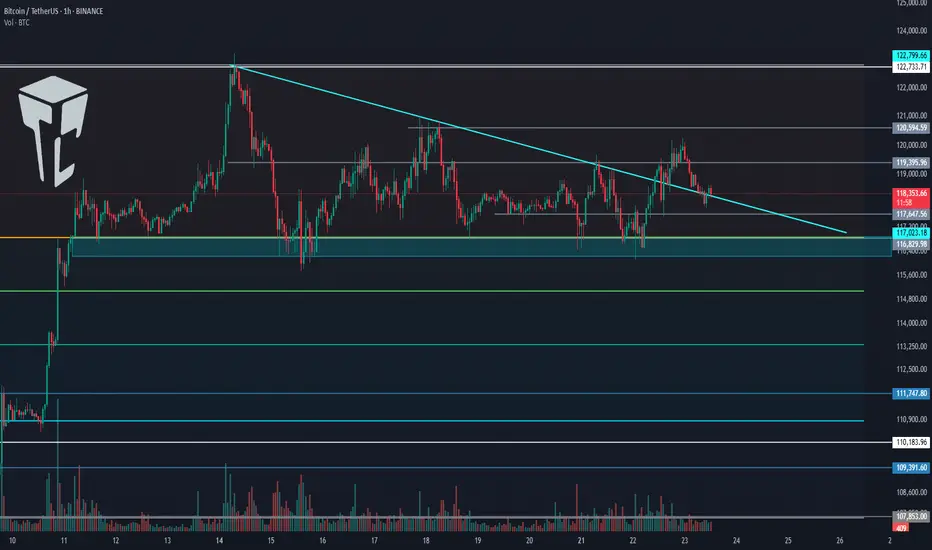
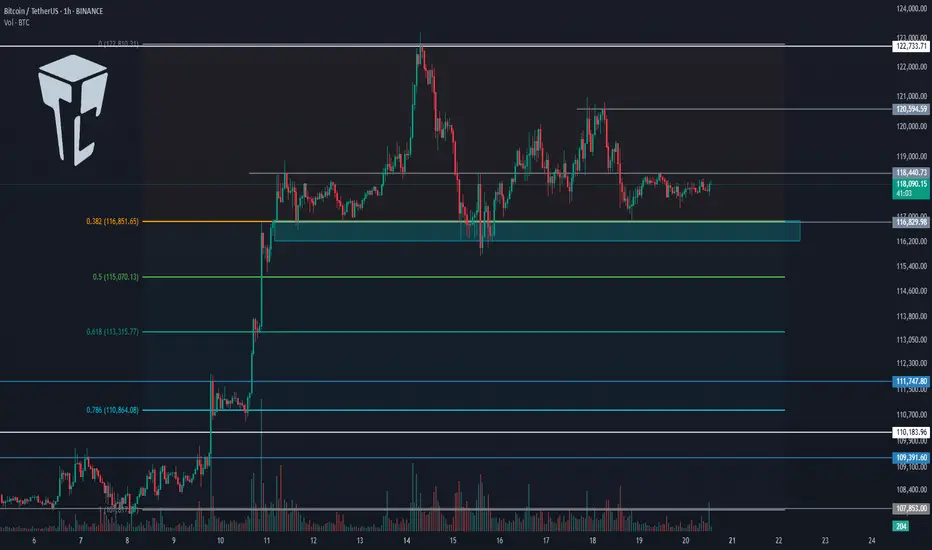
Yesterday, I mentioned that the price had tested the 116829 zone too many times and that this area had become very weak. I also said that if the price made a lower high than 120041, deeper corrections would be likely.
✔️ Another perspective I have on the market is that sometimes certain support and resistance levels simply aren’t strong enough to continue the trend.
🔑 For example, in this case — despite Bitcoin being in an uptrend across all cycles — the 116829 support couldn’t hold, and the price broke it to reach a stronger support zone, one that might be capable of continuing the trend.
📊 Right now, this is what might be happening again. Support levels like 0.5, 0.618, and 0.786 Fibonacci retracement zones could be where the next bullish leg begins.
✅ At the moment, price has reached the 0.5 Fibonacci level, and the previous strong bearish momentum has slightly weakened. If you look at the volume, momentum is still in favor of sellers, but based on the long lower wicks on the candles, we can say the bearish trend is showing signs of weakness.
💥 On the other hand, RSI is approaching 30, and in an uptrend, when RSI nears the Oversold zone, it can often be a good entry point for a long. However, we’re not acting on this yet — we’ll wait for more confirmations before opening any positions.
⭐ For now, there’s no trigger for a long position on this timeframe. A break below 115000 could act as a short trigger, but given the trend Bitcoin is in, I’m not opening any short positions at the moment.
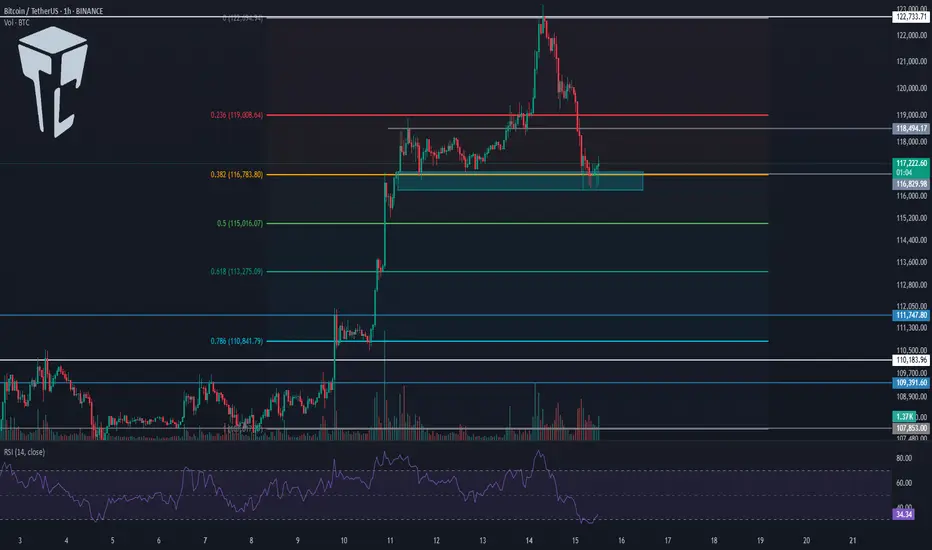
⏳ 1-Hour Timeframe
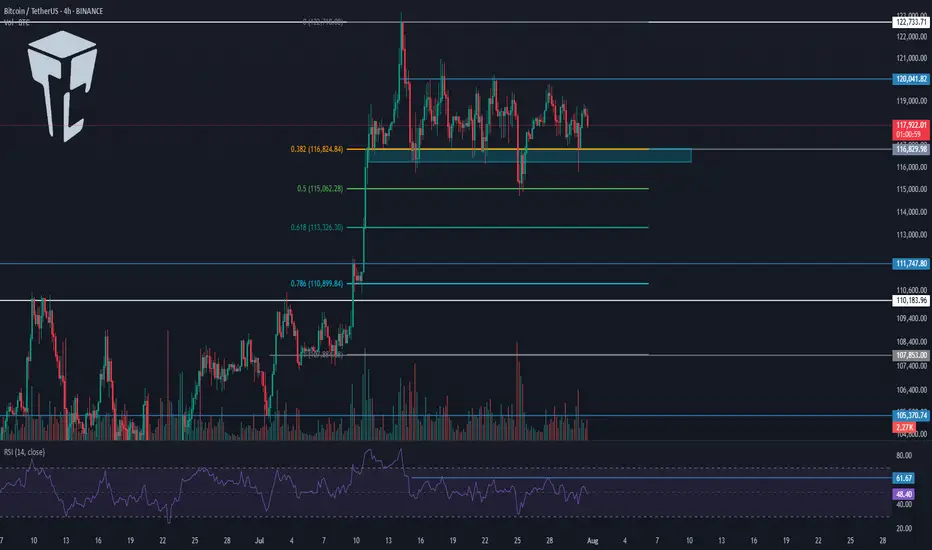
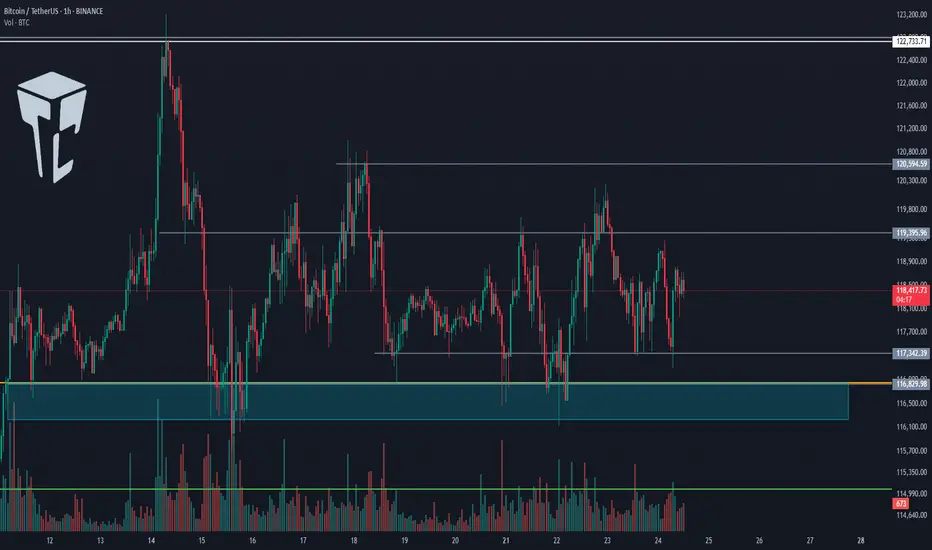
The price has dropped down to 114560, and I believe today we might enter a corrective phase. However, if the price stabilizes below 114560, the correction could continue. The next targets would be the Fibonacci levels from the 4-hour timeframe.
🔽 I won’t open a short position with the break of 114560, and I suggest you don’t take that short either.
📈 If this move turns out to be a fakeout, the first trigger we have now is at 118736, which is quite far from the current price. For this trigger to activate, we’d need to see a V-pattern form.
🔍 There are no other triggers right now. But if more range structure forms, we might consider opening a risky long on the breakout of the range top.
❌ Disclaimer ❌
Trading futures is highly risky and dangerous. If you're not an expert, these triggers may not be suitable for you. You should first learn risk and capital management. You can also use the educational content from this channel.
Finally, these triggers reflect my personal opinions on price action, and the market may move completely against this analysis. So, do your own research before opening any position.
Tradecitypro
TradeCityPro | Bitcoin Daily Analysis #140👋 Welcome to TradeCity Pro!
Let’s dive into the Bitcoin analysis. Yesterday, the interest rate decision by the US Federal Reserve was announced, and once again, just like the past few months, it remained unchanged. Let’s see what impact it had on Bitcoin.
⏳ 4-Hour Timeframe
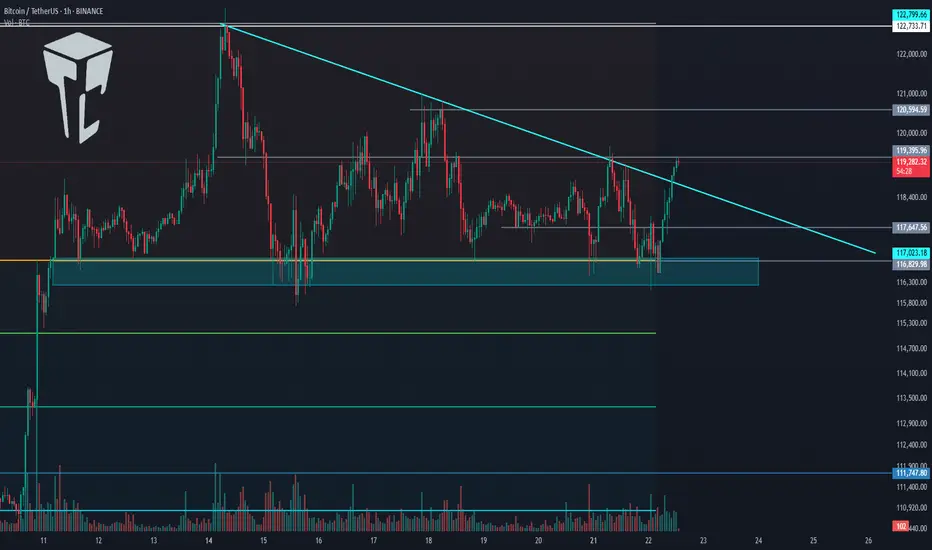
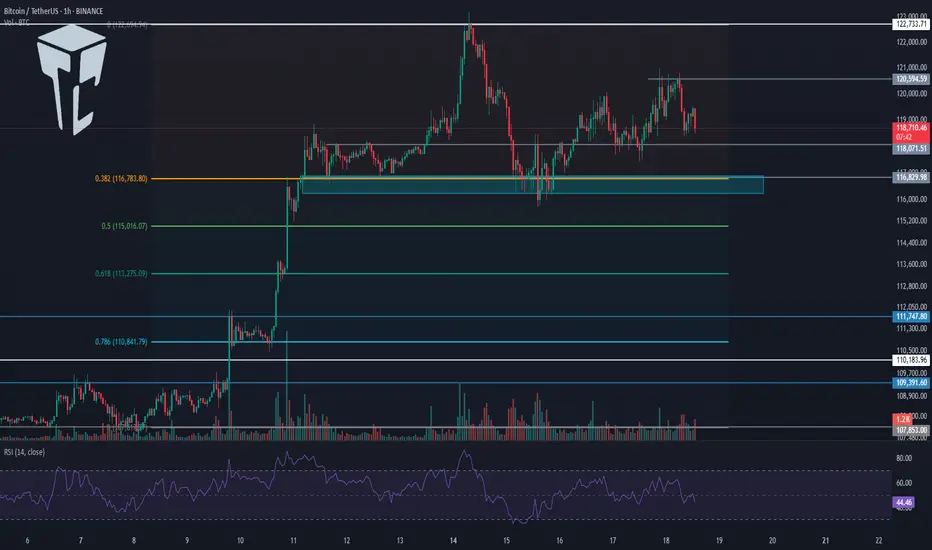
In the 4-hour timeframe, after the announcement of the unchanged interest rate and Powell’s speech, Bitcoin printed a red candle on the support zone and even wicked lower, but then recovered and the price returned back into the box.
✔️ Basically, we can say that this month’s rate decision had no real impact on the market, and Bitcoin is still moving inside its range box. The fact that the support zone wasn’t lost is a positive sign for the continuation of the trend.
⭐ But the important point is this: if the uptrend is going to continue, the price must print a higher high or at least a level equal to 120041, and in my opinion, if for any reason a lower high gets printed, the chances of breaking below 116829 significantly increase.
📊 I currently have no new position on Bitcoin, and all my entries are below 110000. But if 120041 breaks, I’ll open a long position for the next bullish wave that Bitcoin might start.
💥 A major trigger for starting a new leg is the 61.67 level on the RSI. As long as RSI remains below this level, there’s no bullish momentum in the market — and considering that the number of touches to 116829 has increased, the probability of a correction is also rising.
❌ Disclaimer ❌
Trading futures is highly risky and dangerous. If you're not an expert, these triggers may not be suitable for you. You should first learn risk and capital management. You can also use the educational content from this channel.
Finally, these triggers reflect my personal opinions on price action, and the market may move completely against this analysis. So, do your own research before opening any position.
TradeCityPro | ONDO Builds Strength Beneath Key Supply Barrier👋 Welcome to TradeCity Pro!
In this analysis, I want to review the ONDO coin for you — one of the RWA projects, currently ranked 37th on CoinMarketCap with a market cap of $2.93 billion.
📅 Daily Timeframe
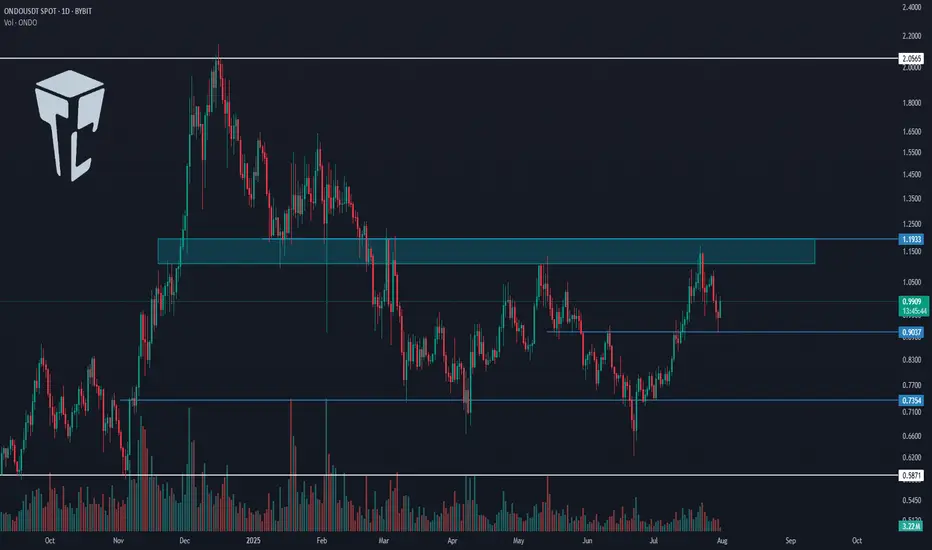
In the daily timeframe, as you can see, this coin has formed a range box between the levels of 0.7354 and 1.1933, and the price is currently sitting in the upper half of this box.
✔️ At the moment, the price is hovering around 0.9037, and it’s forming a higher low above 0.7354. If this low gets confirmed, the probability of breaking above 1.1933 increases.
⭐ The 1.1933 zone is a very significant supply level that was previously acting as support in late 2024, and after being broken, has since acted multiple times as resistance.
📊 If this area breaks, we can open a long position, or even buy this coin in spot. Personally, if this trigger is broken, I’ll open a long-term long position.
✨ The target for this position is 2.0565, and once the price reaches this level, we can take profits and consider a spot buy.
📝 Final Thoughts
This analysis reflects our opinions and is not financial advice.
Share your thoughts in the comments, and don’t forget to share this analysis with your friends! ❤️
TradeCityPro | Bitcoin Daily Analysis #139Welcome to TradeCity Pro!
Let's go over Bitcoin's analysis. Today, Bitcoin is showing some signs regarding its next move, and today could be a critical day — especially considering that U.S. interest rate data is set to be released tomorrow.
4-Hour Timeframe
Today, there’s no need to switch to other timeframes — this 4-hour chart tells us everything.
Yesterday, the price was moving toward the 120041 area, which we intended to use as a long trigger, but that didn’t happen. The price failed to stabilize above this level, and RSI was rejected from the 61.67 zone.
Currently, the price has formed a lower high compared to 120041 and is now moving toward the support area around 116000.
Selling volume has significantly increased, which is not good for the bullish trend. If this support level breaks, deeper corrections to the 0.618 or even 0.786 Fibonacci levels could occur.
I’ll take profit on my long position that I opened from below 110000 if the price stabilizes below this zone, but I absolutely won’t open any short positions for now.
In my opinion, as long as the price is above 110000, any drop or correction is simply a better entry point for a long position. However, we shouldn’t buy during a falling market — we must wait for our triggers to activate.
TradeCityPro | DOGE Faces Resistance with Altseason Tailwinds👋 Welcome to TradeCity Pro!
In this analysis, I want to review the DOGE coin for you. One of the first and most popular shitcoins in crypto, which managed to attract a very strong market cap during the previous bull run due to the hype around Elon Musk.
🔍 Currently, this coin has a market cap of $34.06 billion and ranks 8th on CoinMarketCap.
📅 Daily Timeframe
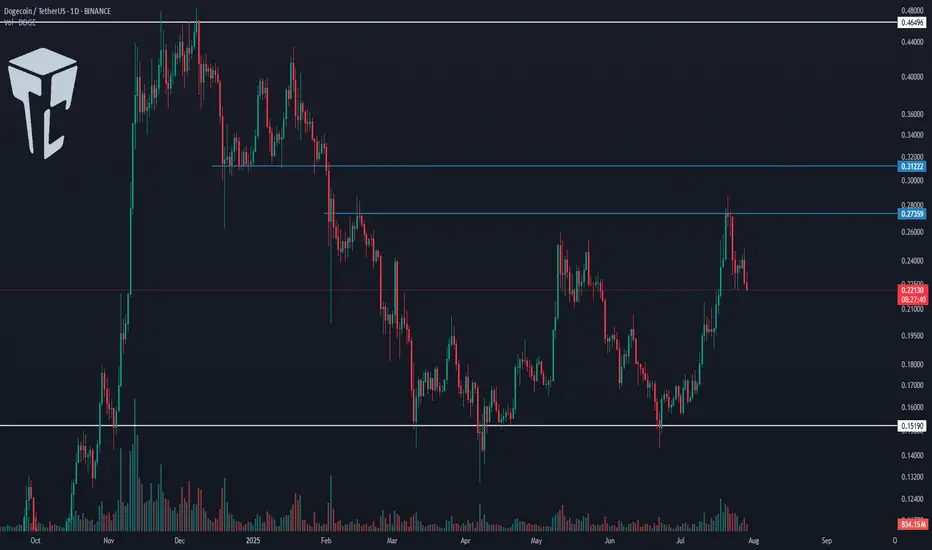
In the daily timeframe, this coin has created a very strong support level at 0.15190, and now after a bullish leg, it has formed a top at 0.27359.
📊 The buying volume increased nicely during this bullish leg, and the price moved up to the 0.27359 resistance.
✔️ Now, after the first touch, the price has started a slight correction and is moving downward. If further touches occur, we can open a long position after breaking the top.
📈 Breaking 0.27359 could be one of those positions that stays open all the way up to 0.46496, and we can buy this coin in spot using the profit from that trade. I will try to have a position open after breaking 0.27359, aiming for 0.46496.
💥 The next trigger we have is the break of 0.31222, but the price should first form some structure after reaching that area, and only after confirmation should we open a position. Just entering based on that break doesn’t seem logical to me.
🔽 If a correction and drop happen, as long as the price stays above 0.15190, there’s no problem for the trend to continue. But if the price stabilizes below that level, a trend reversal might occur.
📝 Final Thoughts
This analysis reflects our opinions and is not financial advice.
Share your thoughts in the comments, and don’t forget to share this analysis with your friends! ❤️
TradeCityPro | Bitcoin Daily Analysis #138👋 Welcome to TradeCity Pro!
Let’s get into the Bitcoin analysis. Today is the start of the week, and it’s very important to begin our trading week with the right analysis and outlook.
📅 Daily Timeframe
On the daily timeframe, as you can see, not much has changed compared to the previous analysis, and the price is still ranging near the supply zone.
✔️ The fact that no price correction has occurred so far shows the strength of the buyers, and even if a correction does happen, as long as the price stays above 110183, the trend will still be considered bullish.
🧩 The main trigger for trend continuation is either the price reaction to the curved trendline or the break of 122733. We can find more optimal triggers in the lower timeframes.
⏳ 4-Hour Timeframe
In this 4-hour timeframe, after a fakeout below 116829, the price corrected down to the 0.5 Fibonacci level and now has returned again to the box between 116829 and 120041.
🔍 The fakeout trigger is 120041, and I’ll try to have at least two positions open in the market when this level breaks — whether on Bitcoin or altcoins.
📈 The main trigger for the next bullish leg is 122733.
If RSI also breaks the 61.67 resistance alongside 120041, the likelihood of the move continuing will increase.
❌ Disclaimer ❌
Trading futures is highly risky and dangerous. If you're not an expert, these triggers may not be suitable for you. You should first learn risk and capital management. You can also use the educational content from this channel.
Finally, these triggers reflect my personal opinions on price action, and the market may move completely against this analysis. So, do your own research before opening any position.
TradeCityPro | INJ Battles Key Resistance Amid Altseason Buzz👋 Welcome to TradeCity Pro!
In this analysis, I want to review the INJ coin for you. It’s one of the RWA and AI projects, currently ranked 63 on CoinMarketCap with a market cap of $1.51 billion.
📅 Daily Timeframe
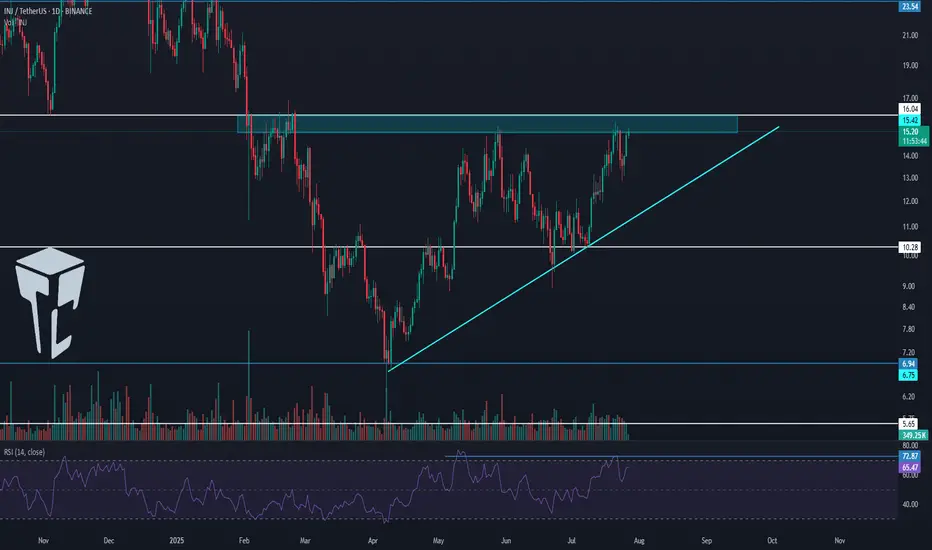
On the daily timeframe, after a drop to the 6.94 level, this coin has bounced back and is now moving upward along with a rising trendline.
✨ A strong support has formed at 10.28, and after price reacted to this level, a new bullish leg started and pushed the price up to 16.04.
🔔 There is a Maker Seller zone around 16.04 that has repeatedly prevented the continuation of the upward move, and currently price is struggling with it again.
📈 Breaking this zone will initiate a new phase of the trend. I plan to have a long position open if 16.04 is broken.
🛒 This trigger is also suitable for spot buying, and if Bitcoin pair and Bitcoin dominance confirm the move, we can consider buying in spot too. But personally, I prefer opening a futures position.
💥 Breaking the 72.87 zone on the RSI will be a solid confirmation for the entry of bullish momentum, and with this breakout, a new bullish leg can begin.
🔽 If a correction happens, I will wait for the trendline to break and will not open a short position for now.
Currently, the first trigger we have for a short is at 10.28.
📝 Final Thoughts
This analysis reflects our opinions and is not financial advice.
Share your thoughts in the comments, and don’t forget to share this analysis with your friends! ❤️
TradeCityPro | Bitcoin Daily Analysis #137👋 Welcome to TradeCity Pro!
Let’s go over the Bitcoin analysis. I’m making a change to how I analyze Bitcoin — I will no longer include indicators like dominance charts.
🔍 From now on, I’ll be analyzing Bitcoin in daily, 4-hour, and 1-hour timeframes only.
📅 Daily Timeframe
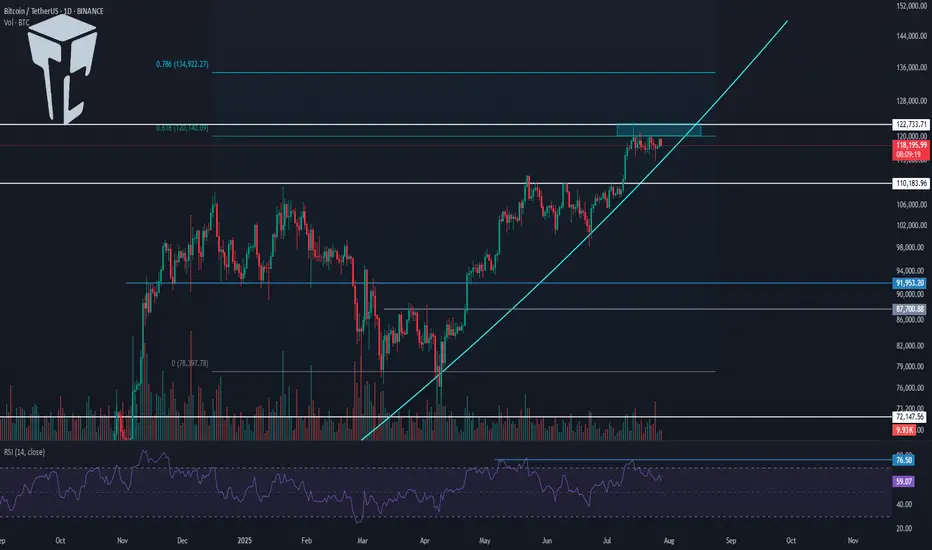
On the daily timeframe, Bitcoin is in a strong uptrend that started from the 78,397 level and in two bullish legs has reached the 122,733 zone.
✅ This level, along with the 0.618 Fibonacci Extension, has created a strong resistance zone. Although price has attempted multiple times to break into or above this area, it has not yet succeeded in closing a candle above or inside the range.
🎲 We also have a curved trendline from higher timeframes, which the price is reacting to even on the daily chart. Currently, the price is near this trendline. There is a possibility that price consolidates over time until it reaches this trendline and then begins its next bullish leg.
📊 If that happens, breaking 122,733 or 120,140 would be triggers for opening a long position on the daily timeframe.
I do not recommend buying Bitcoin on spot right now, because I believe we’re close to the top of this bullish cycle, and this current leg might be the last one.
⭐ A breakout of 76.50 on the RSI would be a strong confirmation of bullish momentum, and would mark the continuation of the uptrend.
🔑 If we get a pullback, the price could correct to dynamic zones like SMA25 or SMA99. Important static support levels are at 110,183 and 100,763.
⏳ 4-Hour Timeframe
In the 4-hour chart, we can see more details of the bullish leg. After the sharp move to 122,733, a correction phase began, forming a range box.
💥 The bottom of the box is around 116,829, which I’ve marked as a zone. It also overlaps with the 0.382 Fibonacci, making it a very important PRZ (Potential Reversal Zone).
The top of the range is at 120,041.
🧩 Yesterday, price made a fakeout to the downside. As you can see, it dumped hard with heavy selling volume and hit the 0.5 Fibonacci level, but couldn’t hold there and quickly bounced back above 116,829.
🧲 Today, I think it's better not to go below the 4-hour timeframe and avoid getting caught up in small market noise.
A break above 120,041 can trigger a long entry.
Another breakdown from the box might trigger a deeper correction.
❌ Disclaimer ❌
Trading futures is highly risky and dangerous. If you're not an expert, these triggers may not be suitable for you. You should first learn risk and capital management. You can also use the educational content from this channel.
Finally, these triggers reflect my personal opinions on price action, and the market may move completely against this analysis. So, do your own research before opening any position.
TradeCityPro | JUP Eyes Breakout as Altseason Momentum Builds👋 Welcome to TradeCity Pro!
In this analysis, I want to review the JUP coin for you. It’s one of the projects in the Solana ecosystem, currently ranked 59 on CoinMarketCap with a market cap of $1.65 billion.
📅 Daily Timeframe
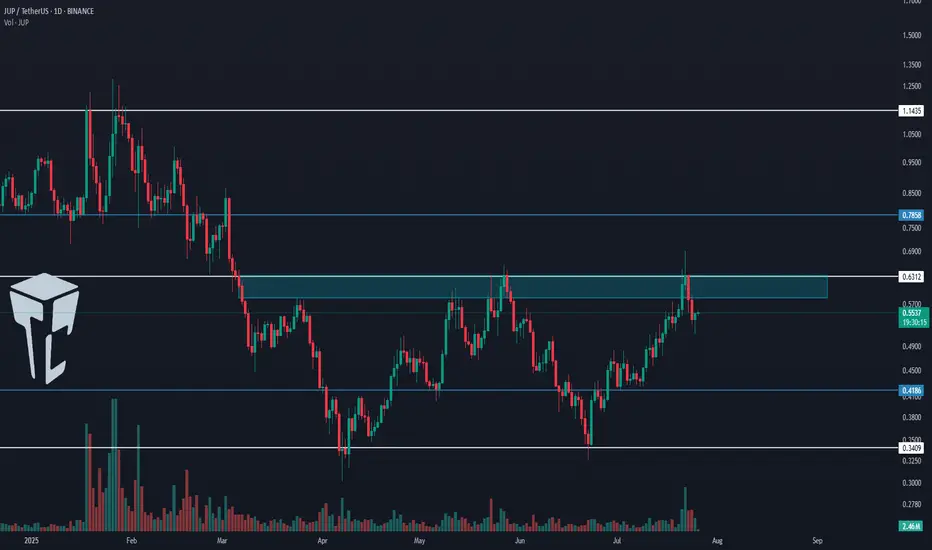
On the daily timeframe, this coin is currently sitting below a very important resistance zone at 0.6312. This is a strong resistance area and serves as the main trigger for a trend reversal in this coin.
✔️ The main support floor for JUP is located at 0.3409, a level price has tested twice before. Now it has returned to 0.6312, and we can see increased market volume at this level, which indicates tension between buyers and sellers.
✨ A breakout of 0.6312 would be a good trigger for a long position, and I plan to open a long if this level breaks. This could potentially be a long-term position with a high risk-to-reward ratio.
🔔 The next major resistance zones are at 0.7858 and 1.1435, which we can use as targets for this position.
🔽 If the price gets rejected from the top and moves down, breaking 0.4186 and 0.3409, we can look to open a short position.
🧩 The break of 0.3409 would confirm the start of a downtrend, and it's one of the key zones where I’ll definitely look to hold a short position if it breaks.
📝 Final Thoughts
This analysis reflects our opinions and is not financial advice.
Share your thoughts in the comments, and don’t forget to share this analysis with your friends! ❤️
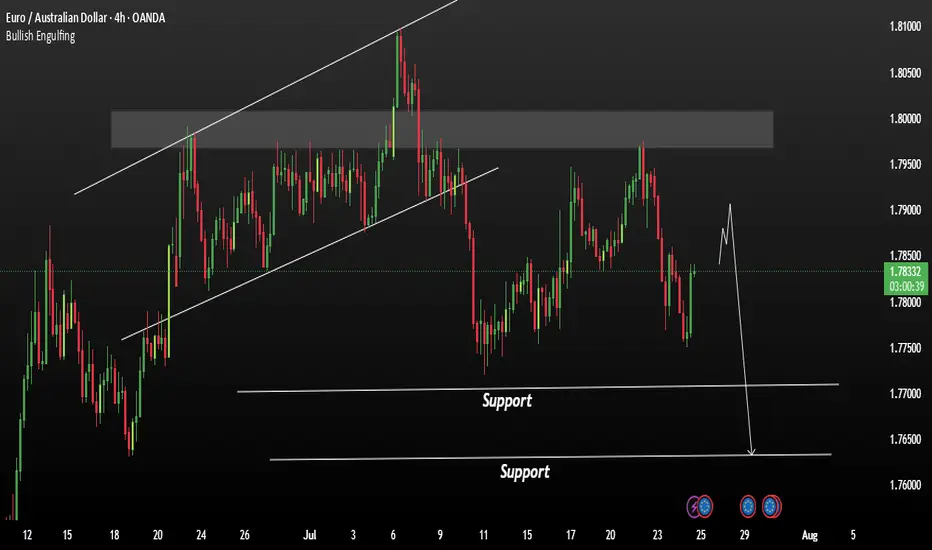
EURAUD is currently showing signs of a bearishEURAUD is currently showing signs of a bearish trend continuation. Despite short-term upward movement driven by optimism around the ECB, the overall structure remains vulnerable to downside pressure.
The European Central Bank (ECB) is expected to keep interest rates unchanged, potentially ending a seven-year streak of cuts. While this could bring temporary strength to the Euro, the technical setup still favours the bears.
Watch for a Break Below the Neckline
If price manages to break below the neckline of the current pattern, it could trigger a strong bearish move. First support: 1.77100 Second support: 1.76300
You May find more details in the chart.
Ps: Support with like and comments for more analysis.
TradeCityPro | Bitcoin Daily Analysis #136👋 Welcome to TradeCity Pro!
Let’s get into the analysis of Bitcoin and major crypto indices. As usual in this analysis, I’m going to review the futures triggers for the New York session.
⏳ 1-Hour Timeframe
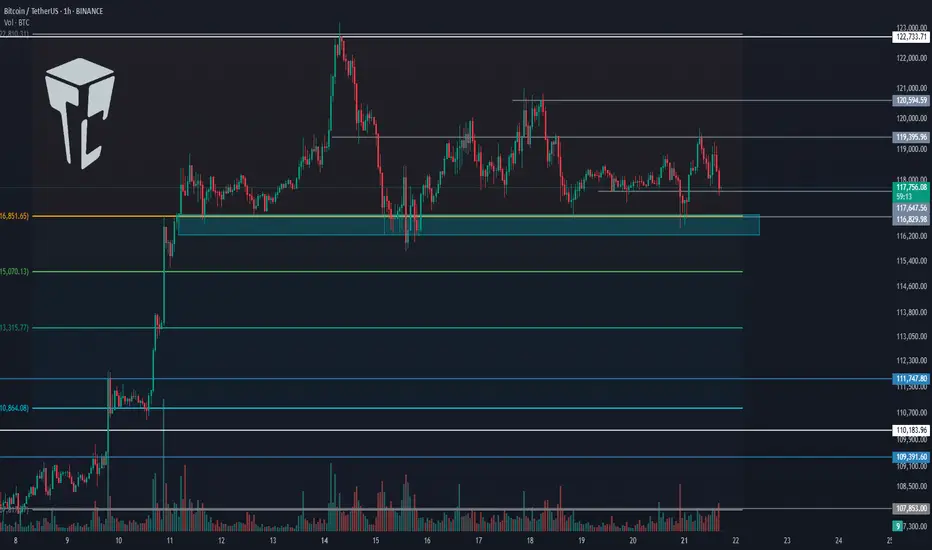
On the 1-hour timeframe, price is still ranging inside the box, and none of its triggers were activated yesterday.
✔️ The support floor is at 117,342, and another key support zone is around 116,000.
✨ If these zones break, Bitcoin may begin a deep correction. In that case, we can open short positions or close long-term long positions that we’re already holding.
⭐ For long positions, we still have the 119,395 and 120,594 triggers. A breakout of either zone could provide a very good entry point for the next bullish leg of Bitcoin.
👑 BTC.D Analysis
Let’s move on to Bitcoin Dominance. Yesterday, dominance stabilized above the 61.20 zone, and as I mentioned before, breaking this zone led to a bullish leg, which continued up to 62.41, and currently, it has more bullish momentum.
💥 If 62.41 breaks, the bullish momentum will intensify. However, I still believe the overall trend is bearish, and if 60.46 breaks to the downside, the decline could continue.
📅 Total2 Analysis
Let’s go over Total2. This index has continued to correct and has now dropped to the 1.41 zone, which corresponds to the 0.5 Fibonacci level. It has now created a trigger around 1.47.
⚡️ If 1.47 breaks, we can open a long position. Our next trigger will be 1.53.
A breakout of 1.53 would signal the start of the next bullish wave.
📅 USDT.D Analysis
Now to Tether Dominance. This index has finally exited its range box and has broken the 4.25 level.
The current resistance stopping price is 4.36.
🔔 If dominance drops back below 4.25, strong bearish momentum could hit, increasing the likelihood of a breakdown of 4.13.
❌ Disclaimer ❌
Trading futures is highly risky and dangerous. If you're not an expert, these triggers may not be suitable for you. You should first learn risk and capital management. You can also use the educational content from this channel.
Finally, these triggers reflect my personal opinions on price action, and the market may move completely against this analysis. So, do your own research before opening any position.
TradeCityPro | Bitcoin Daily Analysis #135👋 Welcome to TradeCity Pro!
Let’s move on to the analysis of Bitcoin and major crypto indices. In this analysis, as usual, I’m going to review the futures triggers for the New York session.
⏳ 1-Hour Timeframe
Yesterday, Bitcoin broke the 119,395 level but couldn’t hold above it and has now returned below this level, currently sitting on its previous trendline.
✔️ Today, the market will probably try to form more structure, and I think Bitcoin will range.
⭐ However, if it wants to move, we can enter a long position with the trigger at 120,594.
🔽 For a short position, we can enter if the 116,000 support area breaks.
👑 BTC.D Analysis
Let’s move on to Bitcoin Dominance. Yesterday, dominance had a bullish move, and finally, a support floor managed to prevent further drop in dominance.
🧩 A retracement to 61.20 has occurred. If this retracement continues, the upper levels are 61.53 and 62.
A break of 60.46 will start the next bearish leg.
📅 Total2 Analysis
Let’s go to Total2. This index has formed a range box between 1.48 and 1.55 and is still oscillating within it.
🎲 If 1.55 breaks, we can open a long position, and on the other hand, if 1.48 breaks, the price could correct to lower support levels.
📅 USDT.D Analysis
Let’s move on to Tether Dominance. This index also has a range box and is still moving inside it.
🔑 Breaking 4.13 is very important for the future market trend and could lead to a drop in dominance.
TradeCityPro | AAVE Holds Gains as Altseason Optimism Builds👋 Welcome to TradeCity Pro!
In this analysis, I’m going to review the AAVE coin for you. It’s one of the major DeFi coins active in the lending sector and currently ranks number 1 in terms of TVL.
✔️ The token itself has a market cap of $4.58 billion and is ranked 29 on CoinMarketCap.
📅 Daily Timeframe
On the daily timeframe, since our last analysis, the price has increased by over 100%, and the trigger for long or buy positions was activated.
🔄 There was a descending trendline on this coin, and the trigger for its breakout was 148.17. After breaking that level, we could open a long position.
🚀 However, the main trigger was 194.97, and the primary uptrend started with the break of that level, continuing up to a high of 328.9.
📊 The issue with this current uptrend is that, as you can see in the second leg, there is clear weakness, which is not a good sign for the continuation of this trend.
📈 The current top at 328.9 is not far from the previous high, forming a double top-like structure, leading to a strong bearish divergence in the RSI.
💥 If RSI confirms a breakdown below 50, this divergence will become active and a correction toward 222.10 may occur. A break of that level would be the first signal of a potential trend reversal for AAVE.
⭐ On the other hand, if price wants to continue upward, we have a very important resistance at 383.59.
🔍 Breaking this resistance would initiate an uptrend in higher cycles and could even lead to a new ATH for this coin.
💼 I plan to open a long position if the 328.9 resistance is broken, and for spot purchases, I will wait for a breakout of 383.59.As long as the price remains above 279.45, I am not considering any short positions.
📝 Final Thoughts
This analysis reflects our opinions and is not financial advice.
Share your thoughts in the comments, and don’t forget to share this analysis with your friends! ❤️

TradeCityPro | Bitcoin Daily Analysis #134👋 Welcome to TradeCity Pro!
Let’s dive into the Bitcoin analysis and key crypto indices. As usual, in this analysis I will review the New York futures session triggers for you.
⏳ 1-Hour Timeframe
On the 1-hour timeframe, Bitcoin has formed a range box between 116829 and 119395. Yesterday, after getting supported at 116829, it climbed back to the top at 119395.
📊 As you can see, buying volume has increased, which indicates strong buyer momentum.
📈 If 119395 is broken, the price could move toward higher targets like 120594 and 122733.
🧩 This 119395 area is also the breakout trigger of the descending triangle. The bottom at 116829 has supported the price multiple times, and now with the descending trendline being broken, price could aim for higher resistance levels.
👑 BTC.D Analysis
Let’s move on to Bitcoin Dominance. BTC Dominance has been supported at 60.46, which is why Bitcoin is moving upward, while altcoins are dropping.
🎲 The dominance trend is still clearly bearish, and if 60.46 breaks, the next downward leg may begin.
📅 Total2 Analysis
Let’s look at Total2. This index has also formed a range between 1.48 and 1.55, and it is currently sitting at the bottom of the box.
🔔 If we get confirmation of support at 1.48, we can consider entering a long position. The main long trigger would be the break of 1.55.
📅 USDT.D Analysis
This index has also formed a range box. The previous support level was 4.08, which has now shifted to 4.13.
💥 The top of the box is 4.25. Given the bearish momentum in dominance, the probability of 4.13 breaking is higher.
🎲 So keep a close eye on altcoins in the coming days, because a lot of capital is flowing into them and they could see significant pumps.
❌ Disclaimer ❌
Trading futures is highly risky and dangerous. If you're not an expert, these triggers may not be suitable for you. You should first learn risk and capital management. You can also use the educational content from this channel.
Finally, these triggers reflect my personal opinions on price action, and the market may move completely against this analysis. So, do your own research before opening any position.
TradeCityPro | SUI Eyes Breakout with Bullish Momentum Rising👋 Welcome to TradeCity Pro!
In this analysis, I want to review the SUI coin for you. It’s one of the Layer1 projects in the crypto space, currently ranked 13 on CoinMarketCap with a market cap of $13.66 billion.
📅 Daily Timeframe
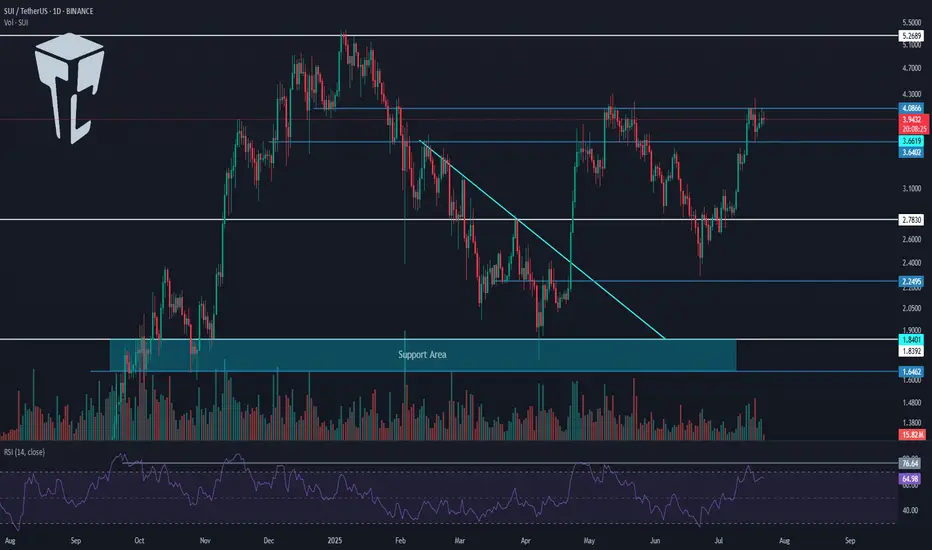
On the daily timeframe, a lot has changed for SUI since the previous analysis. After breaking the descending trendline, it has started a new bullish trend.
✔️ In the first bullish leg after breaking the trendline, the price reached the 4.0866 zone, and now after a correction, it’s moving upward again.
📈 The 4.0866 level is a very important resistance. In fact, we can draw a resistance range between 3.6402 and 4.0866, as the price tends to behave erratically within this zone.
⭐ Currently, the price has re-entered this range and if 4.0866 is broken, the bullish wave could continue. The first target for this wave could be 5.2689.
🔼 So, if 4.0866 is broken, I highly recommend opening a long position, because if the price truly breaks this level (and it’s not a fake breakout), then the minimum target would be 5.2689.
📊 If the buying volume continues to increase as it is now, and the RSI breaks above 76.64, the chances of breaking 5.2689 will also rise, and the price may even set a new ATH.
👀 I already have an open position on this coin based on lower timeframe triggers, and I’m currently waiting to see the reaction to 4.0866. Based on my entry, if the price moves toward 5.2689, the risk-to-reward ratio will be very high. That’s why I’ve kept part of my position open to potentially capture that move.
🛒 For spot buying, we can also use a futures strategy — meaning if 4.0866 breaks, we open a futures position targeting 5.2689, and then use the profit from that position to buy SUI in spot, gradually building our spot portfolio.
✨ If you are looking at this coin only for spot, the main trigger is the breakout of 5.2689. But be careful — if the price moves aggressively, it might not give you a proper entry trigger, and entering from that area might be difficult.
📝 Final Thoughts
This analysis reflects our opinions and is not financial advice.
Share your thoughts in the comments, and don’t forget to share this analysis with your friends! ❤️
TradeCityPro | Bitcoin Daily Analysis #133👋 Welcome to TradeCity Pro!
Let's dive into the Bitcoin analysis and key crypto indexes. As usual, in this analysis, I’m going to review the triggers for the New York futures session.
⏳ 1-Hour timeframe
On the 1-hour timeframe, Bitcoin has once again dropped to the support area at 116829 and reacted to it. Currently, it is fluctuating above this level.
✨ If 119395 is broken, the price could move toward the highs at 120594 and 122733.
📈 So for a long position, we can enter on the breakout of 119395. Pay attention to Bitcoin dominance, because if it’s in a downtrend, Bitcoin setups might not be ideal, and altcoins may offer better opportunities.
✔️ If the price stabilizes below 117647, it will enter the box between 116829 and 117647, and this time the likelihood of breaking the 116829 bottom and heading toward lower supports for deeper corrections becomes very high.
👑 BTC.D Analysis
Now let’s look at Bitcoin Dominance. BTC.D is still falling and after breaking the 61.45 level, it has reached 60.46.
⭐ If this level breaks, the next bearish leg may begin. The trend is strongly bearish with no visible weakness, and we’ll have to see how long this continues.
📅 Total2 Analysis
Let’s move to Total2. This index has broken the 1.5 resistance and is moving toward 1.62.
💫 At the moment, I don’t have a trigger for it, and we need to wait until its structure gives us the next setup.
📅 USDT.D Analysis
Now let’s look at Tether Dominance. This index has stabilized below the 4.22 level and is now moving downward after a pullback to this area.
🧩 The next support is at 4.08, and the index has room to fall to that level. I still see the USDT Dominance trend as bearish for now.
TradeCityPro | LDO Breaks Out Amid Altseason Hype Shift👋 Welcome to TradeCity Pro!
In this analysis, I’m going to review the LDO coin for you. It’s one of the well-known DeFi projects in crypto with the highest TVL in this category, and the LDO coin ranks 82 on CoinMarketCap with a market cap of $1.08 billion.
📅 Daily timeframe
On the daily timeframe, LDO has been in a range box for several months and is now starting to break out of it.
💥 After being supported at the 0.683 bottom, a large amount of buying volume entered, and a sharp bullish move occurred from this bottom to the top of the box. The RSI has also entered the Overbuy zone.
🔔 The overextended level on the RSI oscillator is 79.66, which has even been broken during this leg. Right now, I think the probability of a correction is quite high.
🔍 Yesterday's candle made a deep penetration into the top of the box, and currently, the price is sitting above the box. Since RSI is in the overextended zone, a pullback or short-term rest is likely.
🚀 However, considering the current uptrend, I believe this bullish leg might be ending, and we could see a few corrective candles. But after the correction ends, a new bullish leg might begin, pushing the price toward the resistance levels at 1.480 and 2.382.
🛒 For a long position or a spot buy, we can enter during this new bullish leg once the top breaks and a confirmation of a new wave starting is in place.
📝 Final Thoughts
This analysis reflects our opinions and is not financial advice.
Share your thoughts in the comments, and don’t forget to share this analysis with your friends! ❤️

TradeCityPro | Bitcoin Daily Analysis #132👋 Welcome to TradeCity Pro!
Let’s dive into the Bitcoin analysis and key crypto indices. As usual, in this analysis I’ll review the futures triggers for the New York session.
📅 1-Hour timeframe
On the 1-Hour timeframe, as you can see, Bitcoin is still holding the key support at 116829 and has been ranging between 116829 and 118440 since yesterday.
✨ Today, if the 118440 level breaks, we can open a solid long position. However, I still believe that due to Bitcoin Dominance being in a downtrend, altcoins are a much better choice for opening positions.
✔️ If you're only planning to trade Bitcoin, this trigger is suitable. The next entry points would be 120594 and 122733. If we open positions at all three triggers and the market moves upward, we can get strong risk-to-reward setups since we’ve entered with significant volume across three positions.
📊 If the 116829 level breaks downward, we might see sharper corrections. In that case, the next supports will be the 0.5 and 0.618 Fibonacci levels.
👑 BTC.D Analysis
Looking at Bitcoin Dominance, as you can see, the trend is heavily bearish and moving downward.
⭐ The downtrend in dominance is quite steep, and the next support we have is at 60.49. There’s still room for dominance to drop to this level.
📅 Total2 Analysis
Moving to Total2, yesterday the 1.46 trigger was activated and price moved to 1.5, and it is now sitting just below that level.
💫 If this level breaks, another bullish wave towards 1.62 could form.
📅 USDT.D Analysis
Looking at Tether Dominance, this index is also in a downtrend similar to Bitcoin Dominance, which shows that money is exiting both Bitcoin and Tether and entering altcoins.
🎲 So keep a close eye on altcoins in the coming days, because a lot of capital is flowing into them and they could see significant pumps.
❌ Disclaimer ❌
Trading futures is highly risky and dangerous. If you're not an expert, these triggers may not be suitable for you. You should first learn risk and capital management. You can also use the educational content from this channel.
Finally, these triggers reflect my personal opinions on price action, and the market may move completely against this analysis. So, do your own research before opening any position.
TradeCityPro | ICP Eyes Breakout as Altseason Speculation Grows 👋 Welcome to TradeCity Pro!
In this analysis, I want to review the ICP coin for you—one of the DePIN and AI-related coins, ranked 37 on CoinMarketCap with a market cap of 3.11 billion.
📅 Daily timeframe
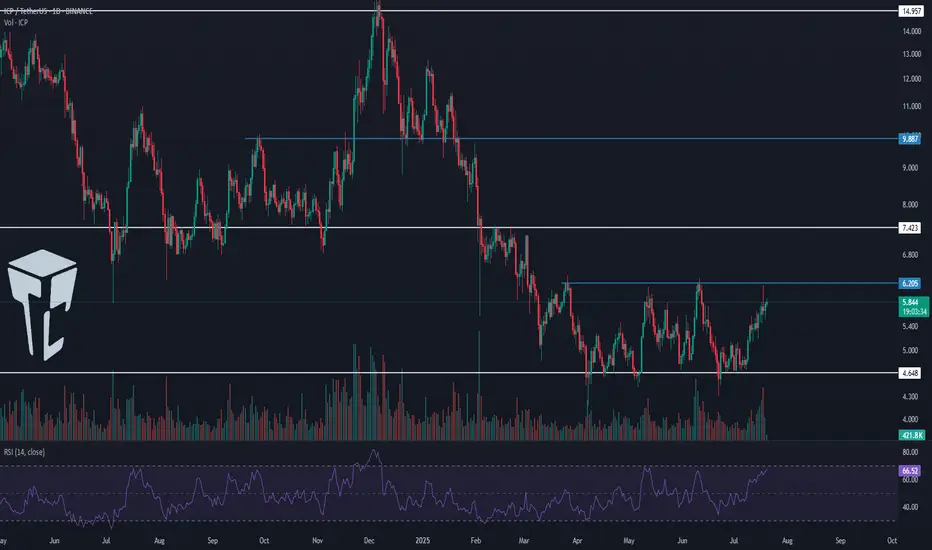
As you can see on the daily timeframe, a ranging box has formed around the key support at 4.648, and price is fluctuating inside this box.
🔔 The top of the box is at 6.205, and price has touched it multiple times. It just wicked into it again and got rejected.
📈 This level has become a very important resistance. If it breaks, we can enter a long position—and it’s even suitable for a spot buy.
🛒 I already hold this coin in spot from lower entry points and don’t plan to increase my spot volume, but I’ll open a futures position if 6.205 breaks.
🔽 If Bitcoin Dominance moves downward, the 6.205 trigger will be a very good entry point. A break above 70 on the RSI will also be a strong momentum confirmation.
📊 If price gets rejected from the top of the box and drops to the 4.648 support, we can open a short position in lower timeframes. A break below 4.648 would confirm the bearish outlook.
📝 Final Thoughts
This analysis reflects our opinions and is not financial advice.
Share your thoughts in the comments, and don’t forget to share this analysis with your friends! ❤️
TradeCityPro | Bitcoin Daily Analysis #131👋 Welcome to TradeCity Pro!
Let’s dive into the Bitcoin analysis and key crypto indices. As usual, in this analysis, I’ll review the futures session triggers for New York.
⏳ 1-hour timeframe
Over the past few days, the market hasn't been very focused on Bitcoin, and altcoins have been moving more strongly to the upside.
⚡️ Bitcoin is still ranging between 116829 and 122733 and is fluctuating between these two levels.
💥 Currently, a local top has formed at 120594, and if that level breaks, we can open a long position. The main long trigger will be the breakout of 122733.
📈 If the market decides to correct, key support levels are 118071 and 116829. I’m setting the stop-loss for my previously opened positions below the 116000 zone.
👑 BTC.D Analysis
Let’s look at Bitcoin Dominance. The reason I’m saying Bitcoin isn't currently the center of attention is exactly this dominance chart.
🔔 As you can see, BTC Dominance is in a very sharp downtrend with strong momentum, which means capital is flowing out of Bitcoin and into altcoins—giving us better long setups on alts.
✨ For now, I see the trend as bearish, and the next supports are at 61.34 and 60.49.
📅 Total2 Analysis
Total2 is still moving upward and has broken above 1.46, continuing its upward momentum.
✔️ The new top is at 1.5, and a breakout above this level can be used as a trigger for long entries.
📅 USDT.D Analysis
Let’s move to Tether Dominance. The 4.22 support was broken yesterday, and the index is now moving downward.
💫 The next support level is 4.08, and breaking that will confirm continuation of the downtrend.
❌ Disclaimer ❌
Trading futures is highly risky and dangerous. If you're not an expert, these triggers may not be suitable for you. You should first learn risk and capital management. You can also use the educational content from this channel.
Finally, these triggers reflect my personal opinions on price action, and the market may move completely against this analysis. So, do your own research before opening any position.
TradeCityPro | Bitcoin Daily Analysis #130👋 Welcome to TradeCity Pro!
Let’s dive into the Bitcoin analysis and key crypto indices. As usual, in this analysis, I’ll go over the futures triggers for the New York session.
⏳ 1-hour timeframe
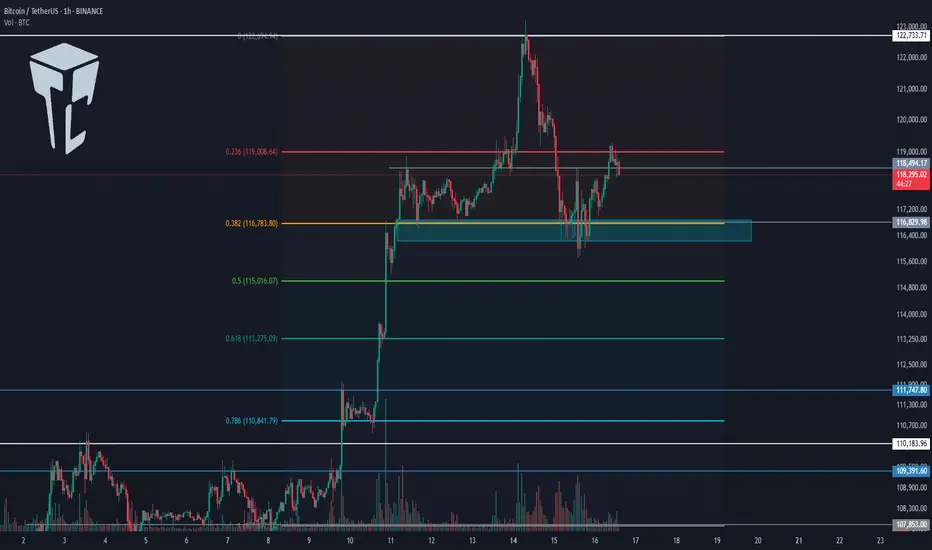
As you can see in the 1-hour timeframe, Bitcoin was supported at the 116829 zone yesterday and is now moving upward.
📈 The long position trigger at 118494 has been activated, and the price is currently pulling back to this level.
💥 The 0.236 Fibonacci level is right above the price, and if it breaks, the price can continue moving upward.
⚡️ The current local top is 122733, which can be the first target for the long position. Breaking this level would also be our main trigger for a long entry.
👑 BTC.D Analysis
Bitcoin dominance is still falling and has now confirmed below the 63.96 zone.
🔍 Currently, the trend is fully bearish, and breaking 63.50 will confirm continuation of the downtrend.
📅 Total2 Analysis
Total2 is rising alongside the drop in Bitcoin dominance and has confirmed above 1.33.
🎲 The next resistance is at 1.41, and the current uptrend can continue toward that level.
📅 USDT.D Analysis
Tether dominance has confirmed below 4.36 and is continuing its downward move.
✔️ The next support is at 4.22, and breaking this level would initiate the next major bearish leg.
❌ Disclaimer ❌
Trading futures is highly risky and dangerous. If you're not an expert, these triggers may not be suitable for you. You should first learn risk and capital management. You can also use the educational content from this channel.
Finally, these triggers reflect my personal opinions on price action, and the market may move completely against this analysis. So, do your own research before opening any position.
TradeCityPro | Bitcoin Daily Analysis #129👋 Welcome to TradeCity Pro!
Let’s take a look at the Bitcoin analysis and key crypto indices. As usual, in this analysis, I’ll review the futures triggers for the New York session.
⏳ 1-hour timeframe
Yesterday, Bitcoin faced a sharp drop after being rejected from the 122733 top and fell down to the 116829 level.
⚡️ Currently, the price has reached an important support area that I’ve marked for you, and at the same time, the RSI has entered the Oversold zone.
✅ Considering the main trend of the market is bullish, this RSI entry into Oversold could be a very good entry point for a long position, as it may indicate the end of the correction.
✨ If the price holds above the 116829 zone, we can enter a long position, and it’s worth opening a position at this level. Further entries can be taken with breakouts of 118494 and 122733.
👑 BTC.D Analysis
Let’s go to Bitcoin dominance. It has continued its downward movement and after breaking 64.44, it’s now moving down toward 64.18.
📊 If this level breaks, we’ll get confirmation of the continuation toward 63.96. In that case, long positions on altcoins would be very suitable.
📅 Total2 Analysis
Total2 is also undergoing a correction like Bitcoin and has settled below the 1.3 level.
⭐ If the correction continues, the next level to watch is 1.26. For long positions, you can enter after breakouts of 1.3 and 1.33.
📅 USDT.D Analysis
Now to Tether Dominance. After bouncing from the 4.22 bottom, it has returned to the box between 4.36 and 4.44.
🔑 If 4.36 breaks, the next bearish leg could start. On the other hand, if 4.44 breaks, we’ll get the first signal of a trend reversal.
TradeCityPro | SOL Holds PRZ as Bulls Eye Range Breakout👋 Welcome to TradeCity Pro!
In this analysis, I want to review the SOL coin for you. This is one of the popular Layer1 projects, nicknamed the “Ethereum killer,” with a market cap of $85 billion, currently ranked 6 on CoinMarketCap.
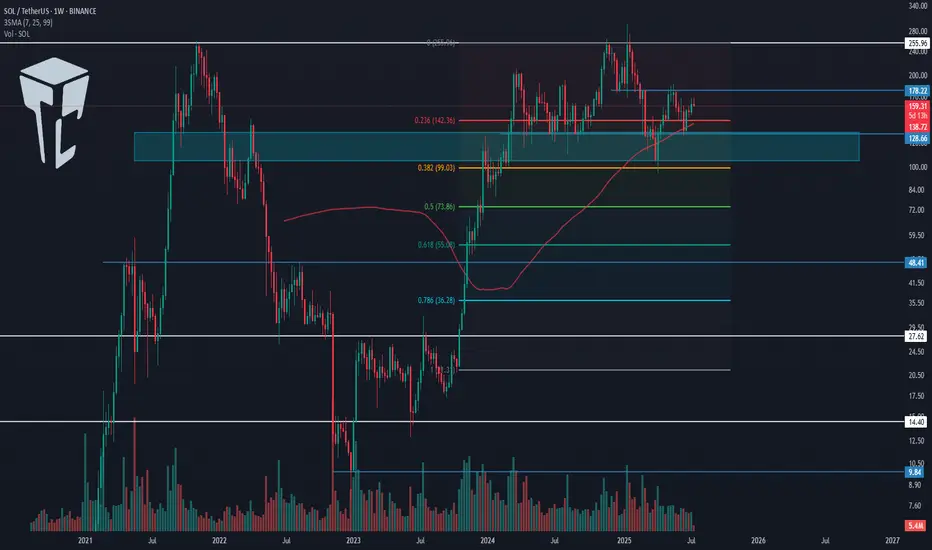
📅 Weekly timeframe
In the weekly timeframe, after the bankruptcy news related to FTX, this coin had a very sharp bearish move and even dropped to as low as 9.84, but it managed to recover afterward.
⭐ From the key top at 27.62, a very strong bullish move started, reaching up to 255.96 and retesting its previous ATH.
📊 Currently, a range box has formed between the 128.66 and 255.96 levels, where the bottom of this box is a very strong PRZ, created from the overlap of a major support zone and the area between the 0.236 and 0.382 Fibonacci levels.
🔍 Also, the price is being supported by the SMA99, which has supported the price twice so far and has prevented the box from breaking to the downside.
⚡️ If you have already bought SOL, you can set your stop-loss if the price closes below this area. A confirmed breakdown could lead to deep corrections toward lower Fibonacci levels.
🛒 For buying this coin, the first trigger is the break of 178.22, which is a bit riskier but offers a good price entry. On the other hand, if the price revisits 128.66 and gives confirmation, we can enter from there.
📈 However, the main trigger for spot entry is the breakout of the 255.96 top. Breaking this level can unlock some very ambitious targets. If that happens, I’ll definitely update the analysis and provide those targets.
📅 Daily timeframe
In this timeframe, we can see the price action in more detail. A small range box has formed between 144.11 and 164.74, and the price is currently stuck below the top of the box and reacting to it.
✨ If 164.74 breaks, we can enter a long position. The next major resistance is 183.54. A breakout above that will serve as the main confirmation for a long position targeting 255.96, which can also be used as a spot trigger.
💥 The RSI oscillator is now above the 50 zone, and if it enters the Overbuy area, it will serve as strong momentum confirmation for this position.
✅ If the price gets rejected from the top, we can also open short positions on lower timeframes. A break below 144.11 will be the main short trigger.
📝 Final Thoughts
This analysis reflects our opinions and is not financial advice.
Share your thoughts in the comments, and don’t forget to share this analysis with your friends! ❤️