Why Did I Lose XAUUSD During NFP Time .... Waiting for a Miracle
Why Did I Lose XAUUSD During NFP Time 😢 While I Was Waiting for a Miracle 😉… and Everyone Else Cashed In? 🤑
Alright, champ. Let’s break down why you lost your short trade around $3,348 per ounce, while the whole world seemed to be printing money. This one’s for the smartest and slickest trader on Egyptian soil—but explained like someone who actually understands market behavior, not someone blindly quoting a textbook. Grab a pen and paper. Let’s dig in.
⸻
🔥 Part 1: “You Faced NFP Like You’re Superman”
❌ What Happened:
• Price shot up hard after the NFP release.
• You said, “That’s too much—it must come down.”
• You went short from the top (around 3,305).
😵💫 Where You Went Wrong:
• NFP isn’t just any move—it’s nuclear fuel for the market.
• The move that follows it is usually an impulse wave—it continues, it doesn’t pull back.
• The market doesn’t drop just because it went up a lot. It drops when:
• Volume dries up.
• Buyers get bored.
• You spot negative delta or divergence.
⚠️ None of that was present when you shorted.
✅ The Smarter Mindset:
“During major news events like NFP, the market doesn’t pull back—it follows through.”
⸻
🔥 Part 2: “Volume Was Screaming in Your Face: I’m Not Done Yet!”
📊 What You Saw:
• Positive delta.
• Increasing volume.
• Big lot sizes hitting the ask side.
❌ What You Ignored:
• No divergence between effort and result.
• Buyers were still strong—no weakness.
• Price wasn’t reacting to resistance; it was smashing through it.
💡 Big Difference Between:
• Absorption = buyers easing the price up slowly.
• Rejection = buyers failing and price slapping back.
You mistook absorption for rejection—classic rookie mistake.
✅ The Real Lesson:
“As long as volume is pushing price, stick with the trend.”
⸻
🔥 Part 3: “You Misused Fibonacci Like a Hammer on a Screw”
❌ What You Did:
• You shorted at the 125%-150% Fibonacci extensions.
• You said, “Price must reverse here.”
📏 What You Should’ve Known:
These levels (138.2%, 150%, 161.8%, 200%) are not sell zones.
They are target zones for buyers, not resistance levels.
✅ The Correct Use:
• Use 125% or 138.2% as breakout buy zones.
• Take profit at 161.8% or 200%.
These are where bulls take profits—not where you blindly short just because “it went up a lot.”
⸻
🎯 Why You Can’t Just Sell There:
Because those zones are:
• Where buying continues.
• Not where it stops—unless momentum fades.
That only happens when:
• Volume drops.
• Delta turns negative.
• Rejection wicks appear.
But what did you do?
You shorted into momentum—while buying was on fire—thinking, “It must stop here!”
⚠️ Nope, bro. That train was still moving—you just stepped in front of it.
⸻
🔥 Part 4: “You Forgot Market Psychology”
🤔 What That Means:
• After NFP:
• Smart money enters early.
• Retail traders wait and watch.
• When price breaks up, retail chases → market moves more.
• Smart money sells into their faces and takes profit.
❌ Your Mistake:
• You tried to be clever and beat the market.
• You didn’t ask:
• Who’s on the market’s side?
• Who’s chasing?
• What will the crowd do next?
When retail feels FOMO, they chase → and that’s what drives continuation.
⸻
🧠 Pro Playbook for NFP-Driven Impulse Moves
✅ Ideal NFP Trade Setup:
1. News release: NFP
2. Price action: Big breakout from range.
3. Confirmation:
• Increasing volume
• Positive delta
• No rejection wicks
4. Entry: Buy Stop above 125% or 138.2%
5. Stop Loss: Below the breakout candle
6. Targets:
• TP1: 161.8%
• TP2: 200%
Now that’s how you use Fibonacci properly, not like people randomly dragging lines around.
⸻
🎯 Where to Draw the Fib Levels From?
✅ The Rule:
From the start of the explosive move to the first clear top right after the news.
🧨 For NFP:
• From: the low of the NFP candle (or the first strong move after the news).
• To: the first visible high with:
• A pause in upward momentum
• A doji candle
• Rejection wick
• Or minor resistance before the move continues
Example:
• Low: around 3,291.50
• Temporary high: around 3,316.00
Draw your Fib from:
• Bottom = 3,291.50
• Top = 3,316.00
⸻
✳️ How to Use the Levels After That:
• 100% = Move ends at the high
• 125% = First extension
• 138.2% = Real ignition point
• 161.8% = Golden target
• 200% = Full wave target
💡 Why Use Buy Stops Above 125%-138.2%?
Because:
• Price breaks above previous highs (lots of traders sell there).
• It creates fake sell traps.
• You enter after the stop-hunt, when the market wipes out sellers and goes higher.
⸻
🔥 How That Looks in Practice:
1. Draw Fib from the start of the NFP impulse move.
2. Wait for price to reach 125% or 138.2%.
3. Place a Buy Stop just above that.
4. Aim for 161.8% or 200% as targets.
Tradeforgaza

XAUMO XAUUSD (Gold Spot) ANALYSIS | AUG 01, 2025 | CAIRO TIME GMThis is a stealth bullish accumulation day. Market maker completed a fake drop and now prepping breakout. Play long bias from control zone with stop-hunt fade backup. Schabacker would call this a false breakdown spring + congestion base rally.
XAUUSD (Gold Spot) ANALYSIS | AUG 01, 2025 | CAIRO TIME GMT+3
🔍 Multi-Timeframe Technical Breakdown (Daily → 5m)
1️⃣ Price Action & Patterns
Daily: Bullish rejection tail forming (pin bar) off VAL (3,288). Strong buyer defense.
4H: Classic bullish engulfing off VAL support. High rejection wick to downside. Micro-structure shows market maker trap.
1H: V-shape recovery seen. Absorption bar confirmed via footprint delta spike.
15m: Buyers stepping in at POC (3,289.35), stealthy buying—confirmed by divergence between delta & price.
5m: Accumulation in box range between 3,289–3,292. High absorption on bid side, low offer lifting—sign of stealth long build.
2️⃣ Volume & Delta Footprint
POC Cluster across all TFs: 3,289.00–3,291.50 is the control zone.
Volume Node Rejection at 3,288 = confirmed buyer base.
Delta: Absorption → sellers hitting bids but no follow-through = market maker trap → bullish implication.
Volume Spike at 3,288 = fakeout move likely manipulated to hunt stops.
3️⃣ Support/Resistance
VAL: 3,288 🔥 Strong Demand Zone
POC: 3,289.35–3,291.75 🧠 Smart Money Zone
VAH: 3,292.80 🎯 Break above confirms momentum
Res. Extension: 3,296.20, 3,300
Fibonacci Confluence: 3,288 = 61.8% golden retracement from recent rally
5️⃣Volatility
Compression near VAH = Volatility Expansion imminent.
Expect Breakout in next 1–2 hours (likely post 09:00 Cairo Time – Kill Zone)
6️⃣ Market Maker Philosophy
Last 3 days show liquidity vacuum trap below 3,288.
MM has triggered stop hunts to shake weak longs.
Building long inventory stealthily under POC.
Expecting rally trap to suck in breakout buyers → then retrace → final breakout continuation.
🧨 JEWEL TRADE ENTRY (Highest Probability)
📈 Order: Buy Stop
🎯 Entry: 3,293.10
🛑 Stop Loss: 3,287.70
💰 Take Profit: 3,302.40
📊 Confidence: 87%
🧠 Justification: Breakout of VAH/Golden Zone + High Volume Node = Trend Shift Confirmed
This is for EDUCATIONAL PURPOSE ONLY, and not financial advise.

Schabacker's Gold Trap Inside the Trap: Schabacker Congestion, VWAP Warfare & The Silent Distribution on XAU/USD
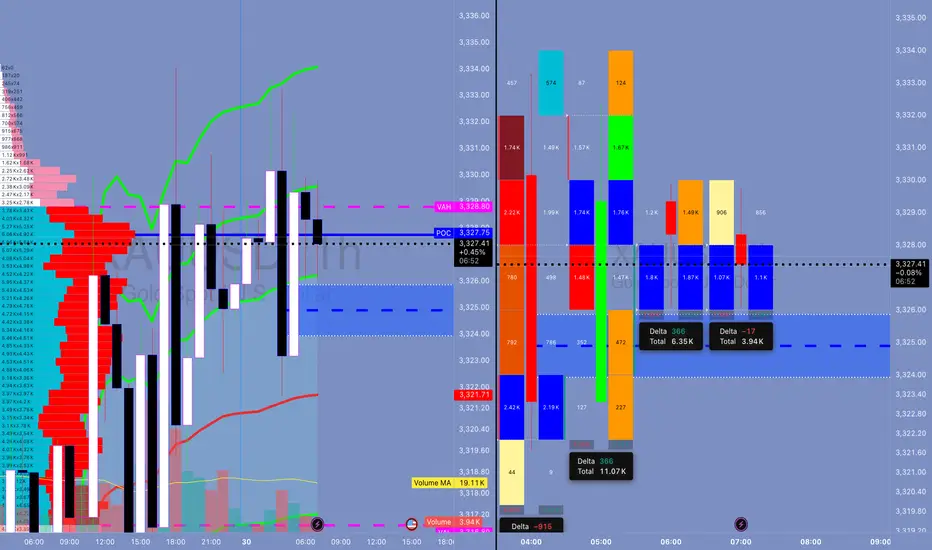
1. The Congestion Area – Schabacker Style
🔍 What We Saw:
Price action rotated in a tight range: 3,324.5 - 3,329.5.
This is not random. This is Schabacker’s classic Congestion Zone:
Duration: 12+ hours
Width: ~5 points
Volume: tapering near edges
Failed breakouts on both sides = classic neutral wedge compression.
🎯 Schabacker Teaching Applied:
"Congestion areas are places of rest and preparation — they are the breeding grounds of significant breakouts or breakdowns."
From his bible “Technical Analysis and Stock Market Profits”:
Congestion after a trend → likely a continuation (but confirm via breakout volume).
Multiple failed breakouts = deceptive strength/weakness → traps.
Range becomes psychological equilibrium → breakout from this zone is explosive.
📘 Lesson:
Watch for breakout confirmation only AFTER price escapes the congestion and retests the range (confirm with volume and delta). If volume weakens and price returns inside = fakeout, fade that sh*t.
🔥 How Schabacker Explains July 29 Price Action
"This was a classic congestion scenario with symmetrical compression, rejecting value high and value low over and over — a balanced market ripe for an imbalanced expansion."
Price coiled with lower highs + higher lows inside the value zone = triangle-like congestion.
Breakout attempts both sides failed = energy stored.
Delta flipped negative toward the close + volume dried = distribution inside the congestion.
✅ Congestion was not random chop. It was the Smart Money disguising their exit before slamming price.
⚔️ ENHANCED STRATEGIC OUTLOOK FOR TODAY (JULY 30, 2025)
🎯 Bias: Short bias unless proven wrong by breakout + acceptance above 3,329.50
Schabacker’s congestion broken to the downside = high probability short trigger.
First target = edge of congestion zone @ 3,316.80 (previous VAL).
Second target (extension) = swing low anchor near 3,310.
📘 Volatility Note:
After tight range like this (Schabacker Box), volatility expansion is imminent. Don’t get caught trading inside — trade the break and retest.
💣 HYPOTHETICAL TRADE PLAN: SCHABACKER STRATEGY IN PLAY
Order Type: 🔻 Sell Stop Below Congestion Break
Entry: 3,322.00
Stop Loss: 3,330.00 (above congestion top + failed breakout zone)
Take Profit 1: 3,316.80 (edge of range, VAL)
Take Profit 2: 3,310.00 (target from congestion width projection)
Confidence: 78%
🧠 Justification:
Factor Explanation
VWAP Flatlined = balanced market
FVRP Price camped near POC = equilibrium
Footprint Absorption at highs, silent selling = distribution confirmed
Delta Early buyer strength flipped = trap
Schabacker Congestion Classic box breakout setup = timing the expansion
🧠 EDUCATIONAL SUMMARY — WHAT YOU JUST LEARNED
✅ Schabacker’s Congestion Area Tactics
Congestion after a move Leads to continuation (trend resumes after pause)
Multiple failed breakouts Traps traders = setup for fakeout fade
Volume dries inside box = Explosive breakout likely
Use congestion width To project breakout targets
You don't fade chop — you exploit it after the breakout.
Don't waste your bullets inside the box. Wait for the beast to break loose — then you unload.