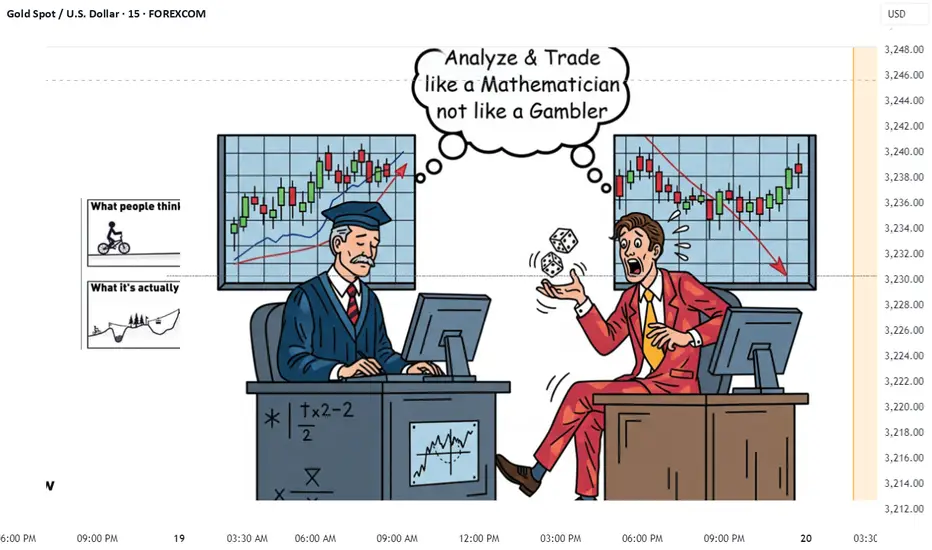
Math: The Secret Weapon of Successful TradersAn ideal trader is both a sharp analyst and a tough fighter.
To win in the financial markets, you need:
🔹 Logic → for accurate analysis & decision-making
🔹 Willpower → for discipline & emotional control
Why Math?
📊 From the logical side, math trains your brain to:
Break down complex problems step by step
Recognize hidden patterns
Master probabilities & risk-to-reward ratios 🧠
🔥 From the mental toughness side, math teaches you:
How to wrestle with hard problems
Build resilience under pressure
Strengthen focus & patience during drawdowns
👉 Trade like a mathematician – precise, logical, and disciplined.
Not like a gambler chasing luck. 🎲
✨ “Analyze with the precision of a mathematician and trade with the fighting spirit of a mathematician 👨🏻🎓.”
— By @Jamtara_Trader
💬 Drop your thoughts below & don’t forget to Follow for more quick trading tips 📈
Trade Management
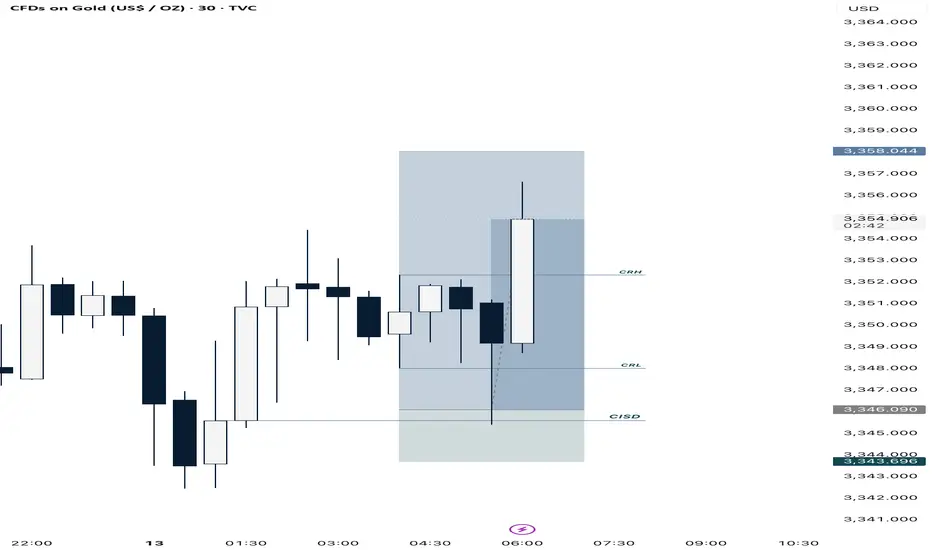
Gold Price Analysis August 14Gold – The uptrend is still maintained, the focus is 3345
Gold price has broken through the Fibonacci level of 0.618, confirming the continued uptrend. However, the Asian session witnessed unexpected selling pressure pulling the price back to the breakout zone of 3355.
Since breaking 3358, the 3345 level has become the most important support point of the uptrend – coinciding with the H4 trendline. Only when 3345 is penetrated, the uptrend scenario will be threatened.
Trading strategy:
BUY around 3360 when breaking and retesting the support zone (Fib 0.618).
BUY at 3345 if there is a signal of support rejection with a clear buying candle.
SELL when the price breaks and trades stably below 3343.

Gold price analysis August 13The trading strategy from yesterday is working as the price reacted accurately at the Fibonacci level of 0.382. In today's session, the 3358 area plays a key role - this is the ideal area to consider DCA when a BUY confirmation signal appears.
On the contrary, 3333 will be the last defensive zone for the uptrend. If this level is broken, the market is likely to reverse to the downtrend, opening up a SELL opportunity towards the 328x area.
Regarding the wave structure, the assessment is still consistent with the analysis of the previous session.
Trading plan:
BUY DCA: When the candle closes confirming above 3358
SELL: When the price breaks 3333 (Fib level of 0.382)

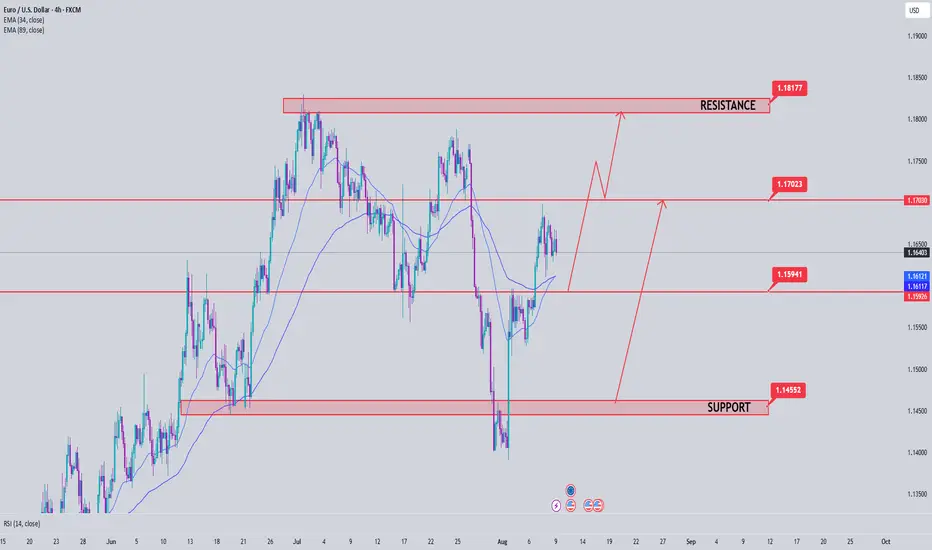
EURUSD Analysis week 33🌐Fundamental Analysis
The US Dollar (USD) struggled to find buying momentum on Thursday, but the EUR/USD pair struggled to build upside momentum. The US economic calendar will not release any macroeconomic data that could boost USD valuations over the weekend. Therefore, investors may pay attention to comments from Federal Reserve officials and risk sentiment.
A bullish move on Wall Street after the opening bell could limit the USD’s upside momentum and help the EUR/USD pair find support. Conversely, the pair could continue to decline if the market turns cautious in the second half of the day.
🕯Technical Analysis
EURUSD is still trading in an uptrend and is facing resistance at 1.170. A break above 1.160 forms a lower boundary support zone that should prevent further downside. Pay attention to the resistance and support zones noted on the chart to have a strategy when there is a price reaction in that area.
📈📉KEY LEVEL
Support: 1.160-1.145
Resistance: 1.170-1.181
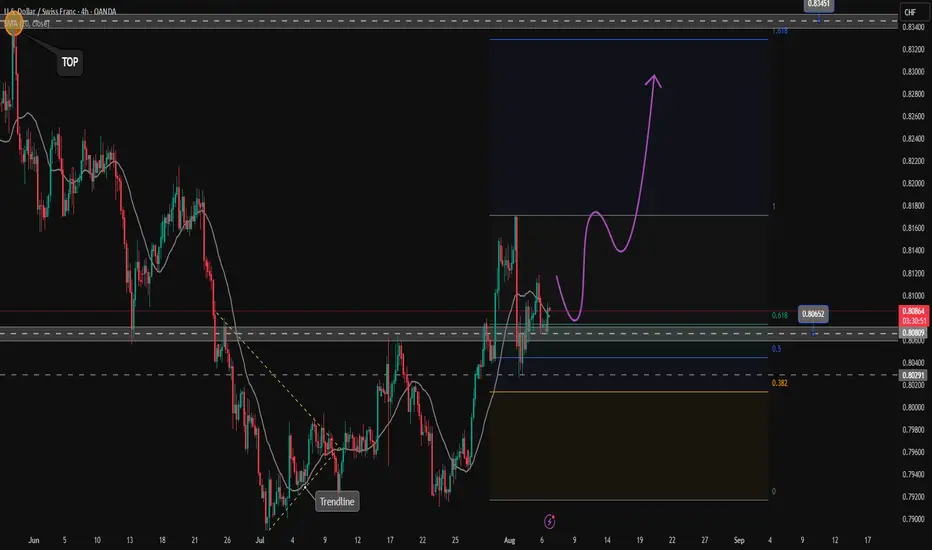
Is USDCHF correction over?✏️USDCHF in the medium term is still in an uptrend. After a retest wave of Fibonacci 0.5 some buying pressure was present in the European session today with the confirmation of the H4 candle Full bullish force. The reaction at Fibonacci is also the support zone for break out in the past. This is considered an important point in the structure of the bullish wave. The BUY point is triggered with the expectation that USDCHF will break the peak of last week and head towards higher levels.
📉 Key Levels
BUY now 0.80800 (confirmation of candle at the support zone)
BUY DCA trigger Break the peak 0.816
Target 0.830
Leave your comments on the idea. I am happy to read your views.
Gold Price Analysis August 6In the Tokyo session this morning, gold recorded some selling pressure after strong buying pressure in the US session yesterday promoted profit-taking sentiment. It is expected that prices may continue to correct during the Asia-Europe session today before potential buying pressure returns in the London session.
Trading plan:
Scalping SELL: 3375
Support zone to watch for BUY: 3346 – 3333 – 3315 (priority when there is a clear price rejection signal)
Upside target: 3420

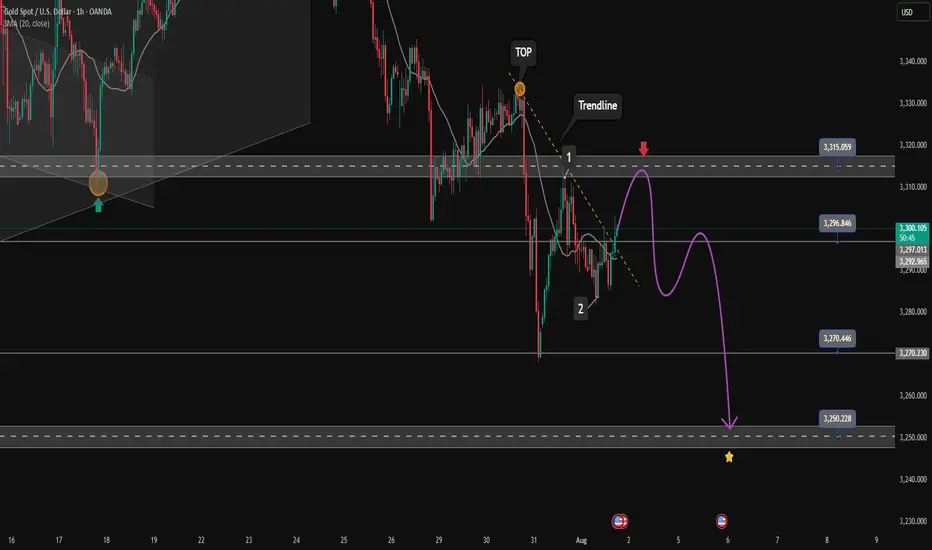
Nonfarm Pay Attention Zone✏️ OANDA:XAUUSD is recovering and increasing towards the resistance zone of yesterday's US session. The 3315 zone is considered a strategic zone for Nonfarm today. A sweep up and then collapse to the liquidity zone of 3250 will be scenario 1 for Nonfarm today. If this important price zone is broken, we will not implement SELL strategies but wait for retests to BUY. It is very possible that when breaking 3315, it will create a DOW wave with the continuation of wave 3 when breaking the peak of wave 1.
📉 Key Levels
SELL trigger: Reject resistance 3315.
Target 3250
BUY Trigger: Break out and retest resistance 3315
Leave your comments on the idea. I am happy to read your views.
EURUSD & US30 Trade Recaps 18.07.25A long position taken on FX:EURUSD for a breakeven, slightly higher in risk due to the reasons explained in the breakdown. Followed by a long on OANDA:US30USD that resulted in a loss due to the volatility spike that came in from Trump.
Full explanation as to why I executed on these positions and the management plan with both.
Any questions you have just drop them below 👇

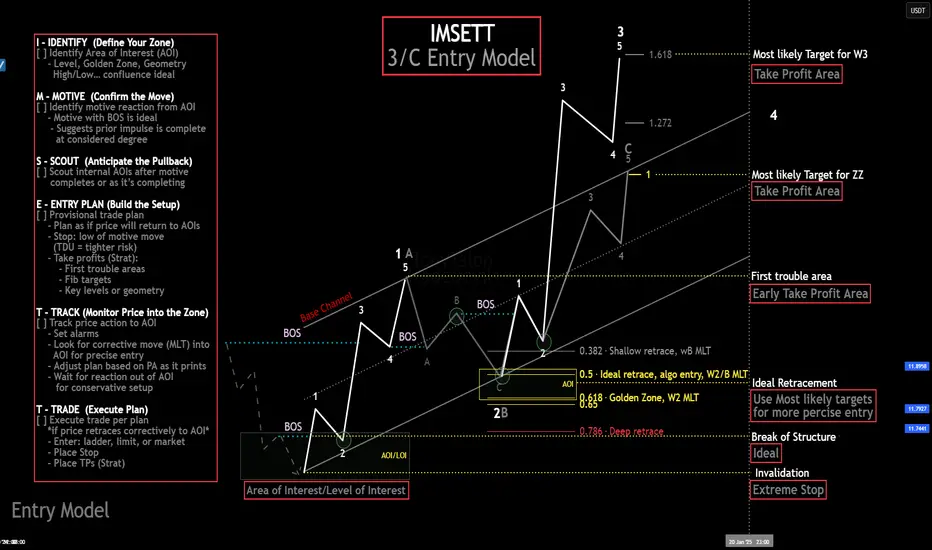
My Ideal Elliott Wave Entry ModelThe IMSETT 3/C Entry Model.
Every trader wants to catch the big moves the ones that pay quickly and decisively. In Elliott Wave, those moves often come during Wave 3. It's the strongest part of the trend, and when you're positioned early, the risk-to-reward is unmatched.
But not every opportunity hands you a clean Wave 3 on a silver platter. Sometimes you’re looking at a Wave C instead. That’s where the 3/C Entry Model comes in. It’s designed to get you aligned with high-conviction moves—whether the market is in a trend or a zig zag.
Here’s the edge: both Wave 3 and Wave C often start the same way—a strong, motive push off an AOI (area of interest), followed by a retracement. That shared structure gives us an anchor. Whether we’re labeling it a 3 or a C doesn’t change the fact that the initial impulse gives us clarity, direction, and a place to manage risk.
That’s what the IMSETT Model is built around:
Identify
Motive
Scout
Entry Plan
Track
Trade
Each step is focused, actionable, and repeatable. You're not trying to outguess the market—you’re reacting to structure, preparing for common behavior, and executing with intent.
I do have a video with a walk through.
This just the way I look for clarity in setups. As with everything in trading, nothing will work every time so do your own research this is not financial advice.
Cheers!
Trade Safe, Trade Clarity.
Gold Trading Strategy June 19Yesterday's D1 candle confirmed the Sell side after the FOMC announcement. Today's Asian session had a push but the European and American sessions are likely to sell again.
3366 will be an important breakout zone today, if broken through, the Sell side will continue to be strong and push the price deeper and limit buying when breaking this 3366 zone. 3344 is the first target, it is difficult for gold to break this zone but if it breaks right away, wait below 3296 to BUY for safety. Before that, pay attention to another support zone 3322.
3400 is the Breakout border zone from yesterday to today but gold has not broken it yet. To SELL this zone, you must also wait for the confirmation of the candle, but if you want to wait for a better SELL, you must wait for 3415 or wait at the ATH peak 3443. However, if it breaks 3400, waiting for a Buy test will be quite nice.
Support: 3343-3322-3296
Resistance: 3415-3443
Break out zone: 3366-3400
Gold Price Analysis June 16There is not much surprise when the price gap up appeared on Monday morning
there is no barrier that can stop the price of gold from increasing towards ATH.
Gold has a slight correction in Tokyo session after the price gap up touched the round resistance zone 3450.
The correction may extend to 3413 in European session. This is a BUY zone with the expectation that Gold will regain the ATH hook. If broken, there will be some Scalping buy zones but the risk is quite high so to be safe, wait for 3398.
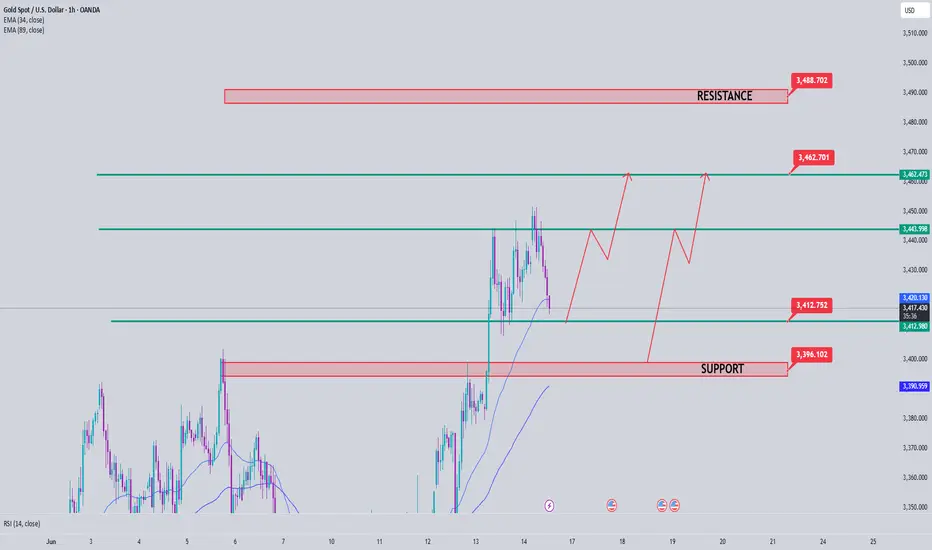
3463 acts as temporary resistance for a reaction period before Gold returns to the all-time high. Maybe before 3490 there will be another price reaction before reaching the top.
I am waiting for SELL here with wave 5 catching strategy In the Kitco survey, Wall Street analysts were divided on the direction of gold prices this week. Fifty percent of experts expect prices to rise, 43 percent expect prices to fall, and 7 percent believe gold will move sideways. This reflects a generally cautious sentiment as there is no clear factor to promote a new trend.
Some experts still lean towards the uptrend as gold holds important support levels and remains a safe haven amid geopolitical uncertainty. Others predict a correction in gold prices due to positive signals from the White House about the possibility of reaching trade agreements and the recovery of US stocks.
In addition, there are also neutral opinions that gold is unlikely to continue to rise sharply without further momentum, especially when stock indexes are more attractive to investors.
James Stanley, senior strategist at Forex.com, remains optimistic, saying that gold is making a technical correction to continue the larger trend. He believes that the $3,300 and $3,280 zones will be important boundaries to watch.
What do you think about this strategy?
Best regards, StarrOne !!!

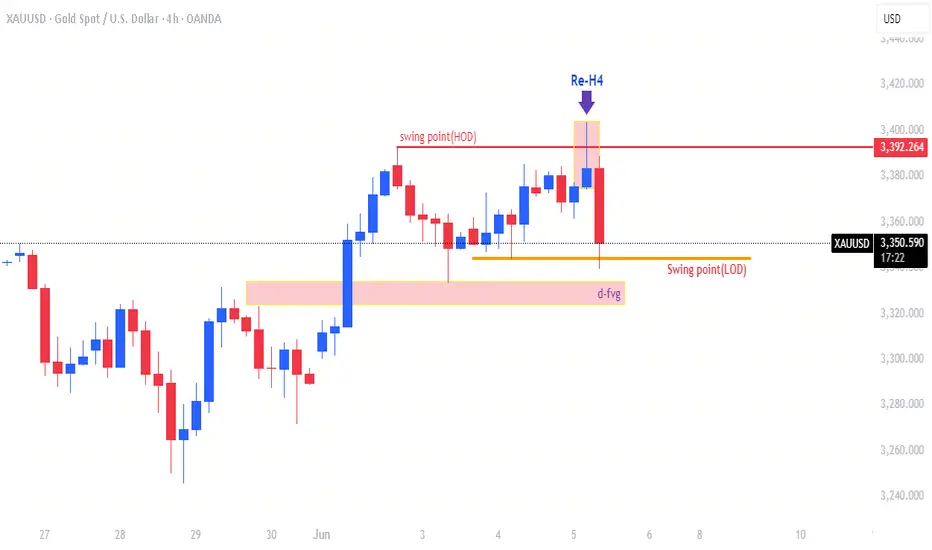
Trading Game of the dayTrading game of the day is the same trading plan of the day
1-PDA:- SWING POINT (HOD)
2-Rejection Block from the swing point on H4-TF
3-Market Structure
4-CISD
5-FVG which represent (Unusual Context)
6-Rejection from the fvg
7-TS+BB
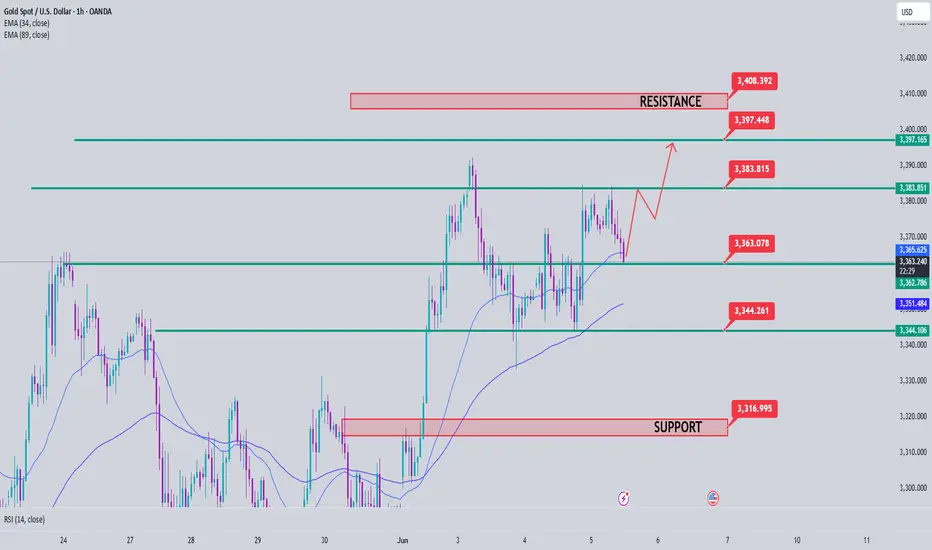
Gold Price Analysis May 6D1 Frame
It is not surprising that the price has increased again. If this momentum continues, the 3408 level can be reached today.
H1 Frame
The uptrend is clear, heading towards the area above 3400.
3363 is a good support zone, suitable for BUY orders in the Asia - Europe session.
3344 is an important level. If broken, the short-term uptrend will be broken and we need to wait for a new wave.
Resistance to watch
3382 is the nearest resistance zone in today's session.
3397 is an area prone to false breaks (old peaks). The price may react slightly here before reaching the 3408 level.
MNQ Buy Idea 5.29.25 (Part 2)Continuation of the first video entry of this trade.
We were aiming for $200 in profits today but failed to get that, ending with $61 in profits. I don't think we will be entering another trade due to the time and also that I want to focus on reading my book "The Trading Game" by Ryan Jones.
If you guys found this insightful give it a 🚀, it helps me see that you guys learned something from watching this and motivates me to post more.
Drop your comments down below, do you think MNQ is bullish or bearish? What prices do you see MNQ reaching?

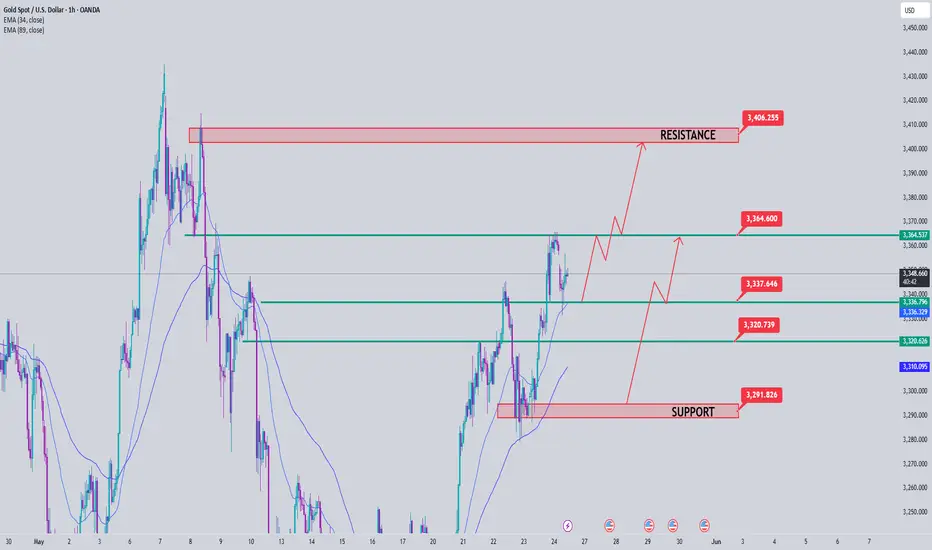
Gold Price Analysis May 26After a correction, the D candle on the following day confirmed a strong price increase towards ATH in the near future
The barrier to reach the all-time peak is not much and it is difficult to have a downtrend at the present time
The gold price increase in the early Asian session met with a price reaction at the Gap opening zone around 3356. With the candle's force, it is completely possible to push the price up to 3364 in the late Asian session or early European session. The nearest lower border is noted around the Asian session resistance zone this morning at 3335-3336. If 3364 does not break in the European session, it can give a pretty good SELL signal with a target of 333x and deeper at 321x. If it breaks 3264, it confirms a strong uptrend and only BUYs and does not look for a SELL point. The resistance until the target of 3405. 3191-3292 still plays a daily support role for any prolonged price decline of Gold
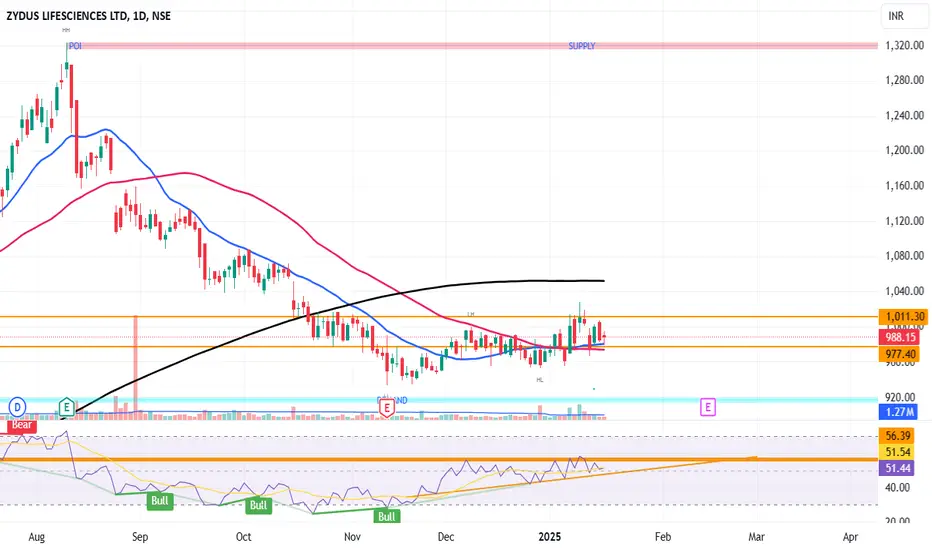
ZYDUSLIFE Weekly UpdateZYDUSLIFE seems to be stable on the current 985-990 levels.
Things to watch carefully for Long trades.
Long Trade entry :
Entry Trigger : 1011
Stop Loss for target 1 : 977
First Target : 1044
Second target : 1068
Third target: 1130
Last target: 1211
Note: Consider each target for exit of the hold position and re- enter after 3%(Approx.) drop. this will maximize the re-entry position and the profits.
Exit for sure On last target as 2-3 Month or retracement would possibly come after this point.
Trade Updates would be shared on this on every Friday
Trade Reflection & Overview – Final Thoughts on the Day’s SetupIn this final video, I’m reflecting on the trade and the key lessons learned throughout the session. Looking back, I realize I should have taken profits when price tested the 9:33 AM fair value gap, which would have given us a nice profit. Although I expected lower prices, considering we had a bearish daily bias, I underestimated the strength of the daily fair value gap, which had already been tapped multiple times. Price held above the 50% level, and that was a strong signal for higher prices.
Additionally, the double top formation near Monday’s buy-side liquidity could have been a target for price, which adds to the case for a reversal higher. Despite missing some potential profit, we ended the day with a total of $50,723.16 in profit.
Looking ahead, the focus is on consistent trades, avoiding FOMO, and maintaining solid setups that make sense. I’m committed to sticking with MNQ for now, refining my confidence in the setups and building a steady rhythm. Once we’re fully confident and have more capital, I’ll look to take on more risk, but for now, the goal is simple — keep it consistent and avoid repeating past mistakes.
This is the year of building profitability and consistency, and I’m ready for the journey ahead.
Trade Overview:
Profit: $200
Account Balance: $50,723.16 for the day
Reflections: Missed opportunity to take profits at key levels
Next Steps: Focus on solid setups, consistency, and avoiding FOMO
Trading Plan: Sticking with MNQ for now, working on building confidence and rhythm.

Position Management – Consolidation and Missed Exit OpportunityPosition Management – Consolidation, Inverse Head & Shoulders, and Missed Exit Opportunity
In this video, we continue managing the position, which remains in consolidation. Price taps the 50% level where we took our first partial, retraces higher, and taps the inverse fair value gap that previously held support for the sell-off. From there, we rush lower to the 9:33 AM fair value gap, finding instant support and bouncing just shy of the 50% mark of that gap.
This is also coinciding with the 25% level of the daily fair value gap. As price trades up to the 7.05 area, we create a triple top before moving lower again, but it’s been choppy and ugly. At around 11:00 AM, I reflect on how taking profits at the first test of the 9:33 AM fair value gap would've been the ideal move, putting us up around $380.
We’re now observing a potential inverse head and shoulders forming, with the 9:33 AM fair value gap as the head and the 50% area as the higher right shoulder, suggesting a reversal for higher prices.
Trade Overview:
Price Action: Choppy movement, with multiple taps of key levels
Key Levels: 9:33 AM fair value gap, 50% of fair value gap, 25% daily fair value gap
Pattern: Observing an inverse head and shoulders setup forming
Exit Reflection: Considering missed opportunity to take profits at 11:00 AM.

Position Management – Price Consolidation & FVG SupportIn this video, we continue managing the position after taking our first partial. Price consolidates around the 50% retracement level before pushing lower to the 21,188.75 level, which aligns with the 9:33 AM fair value gap we identified earlier. We find support here, and at this point, we’re still hoping to see a continuation lower.
However, the inverse fair value gap only holds for a few more points before the price reverses against us. This ultimately takes us out of the position, but we still lock in a profit of $65 from the trade.
Trade Overview:
Price Action: Consolidation near 50%, then lower to 21,188.75 (9:33 AM fair value gap)
Support: Price found support at the fair value gap level before reversing
Exit: Stopped out with $65 profit as the inverse fair value gap failed to hold.

Trade Management – First Partial at 50% of the TrendIn this video, we’re already inside the 10 AM trade from the previous setup. At this point, we’re up 290 ticks, and we’re managing the position carefully. To mitigate risk, we decided to take our first partial near the 50% retracement of the trend, just in case the price reversed and went against us.
This step allowed us to lock in some profit while still leaving room for the trade to continue in our favor.
Trade Overview:
Profit: +290 ticks
Partial: First partial taken at 50% retracement of the trend
Risk Management: Protecting against potential reversal while staying in the trade.
