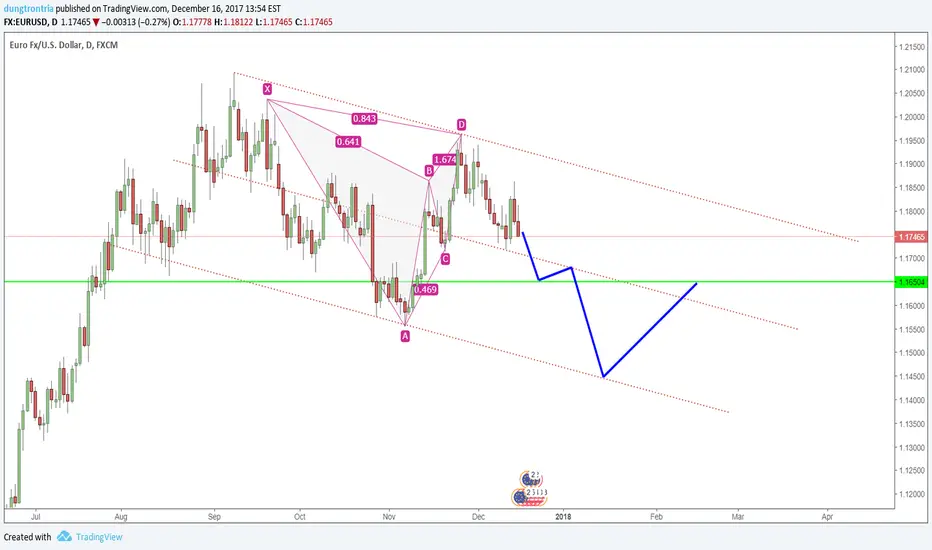
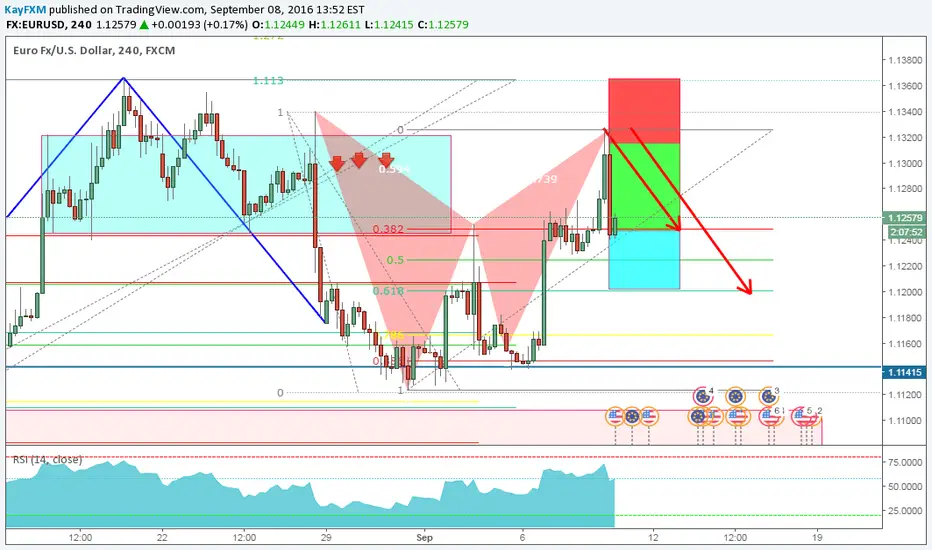
Short Opportunity EURUSD (300 pips/1 month)Bearish Gartley & AB=CD Patterns have formed on EURUSD, potentially reaching trendline at 1.14450 during mid-January 2018
SL 1.18650 or 1.19650
Things to remember:
- Do not overtrade
- Only overtrade when you want to see the market hit your stop and then reverse back in the direction of your initial position.
Trade Management
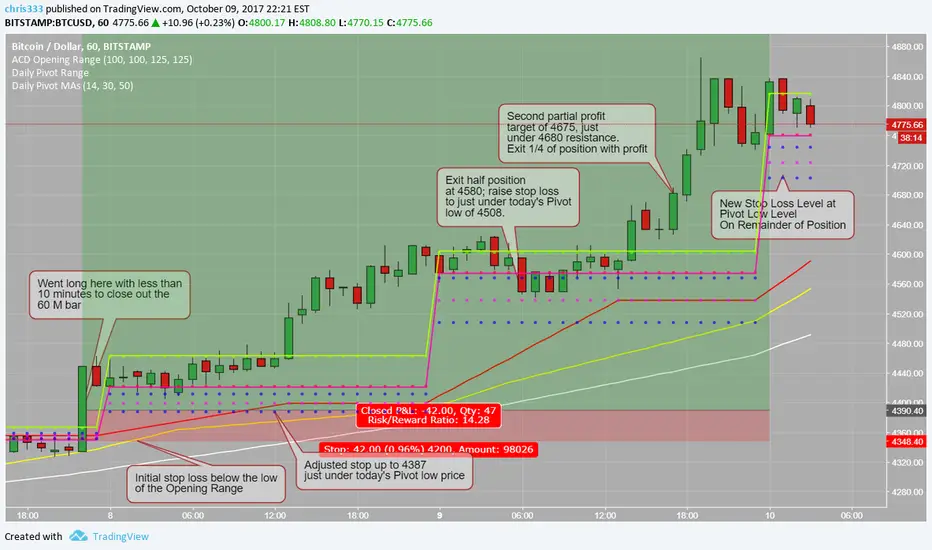
Update to "Go long BTCUSD"-Trade Management Risk:Reward is 14:1 This chart will give you a better view to the ongoing trade "Go Long BTCUSD", with all indicators in visible (Pivots, Opening Range) to see the trade progression, trailing stop losses and profit targets.
What you are seeing here is trade management. By managing the trade properly we are able quickly eliminate the risk of the trade being a losing trade, by bringing our stop loss to close to break even very soon after our entry. From there we simply trail stops to key support levels as well as taking partial profits at key resistance levels. This allows for the trade to be a comfortable experience by enjoying the booking of gains and the continual reduction in risk of losing profits.
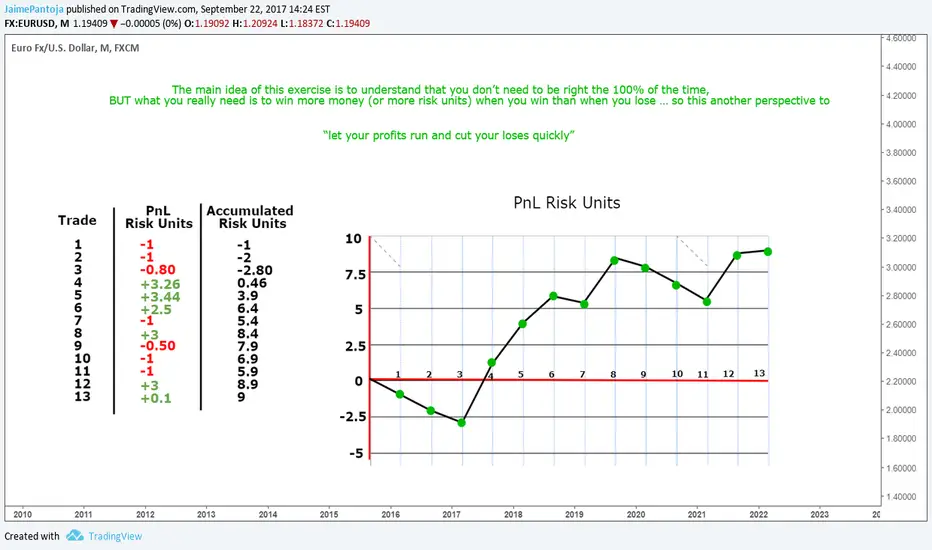
Trading Record - Risk Units Exercise This is an observation with educational purposes, for myself and for the people who might find it useful.
First of all, the results that are shown here are made from the last 13 trades that were published and TRIGGERED, here in the website. Each one of those trades are measure in terms of risk to reward, in other words terms of risk units.
Remember when you are going to place a trade you must have clear what % of your account you are going to risk, after you have that number, depending on the place from your entry to your of stop loss level you define your position size in order to match your risk amount
Below you can find in detail each one of the trades, is important that you see the description of each idea in order to see how was the trade management in each case
Trade 1
Trade 2
Trade 3
Trade 4
Trade 5
Trade 6
Trade 7
Trade 8
Trade 9
Trade 10
Trade 11
Trade 12
Trade 13
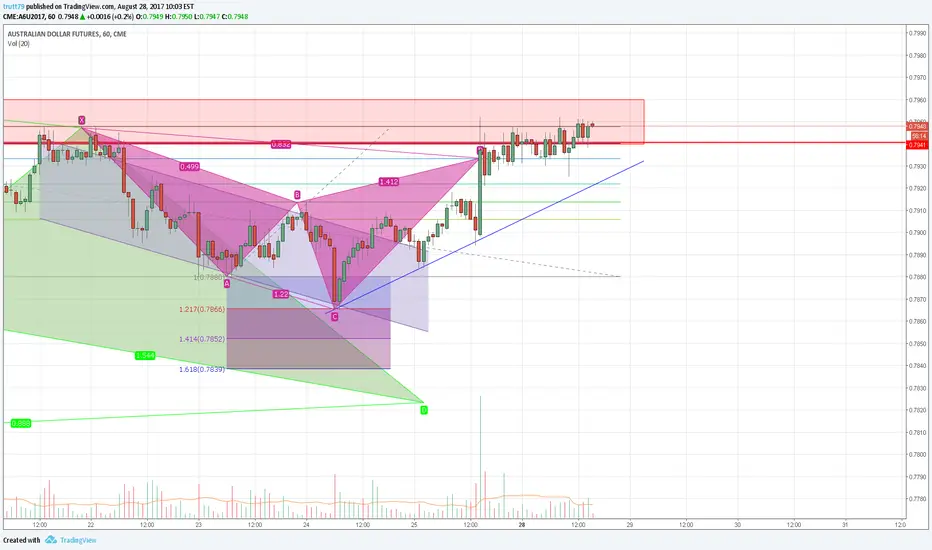
Hell of a mess on the A6!
Hi i just want to flash the chart of A6 because it was one of the hardest to trade recently.
The good thing is, i did not trade it because
A) My Bullish 4 Hour pattern was not filled
B) The down channel broke before i could trade
C) The bearish Bat on 1 hour was invalidated when price takes out point X
I decided to use this as education material and i'm going to do a write up during this weekend.
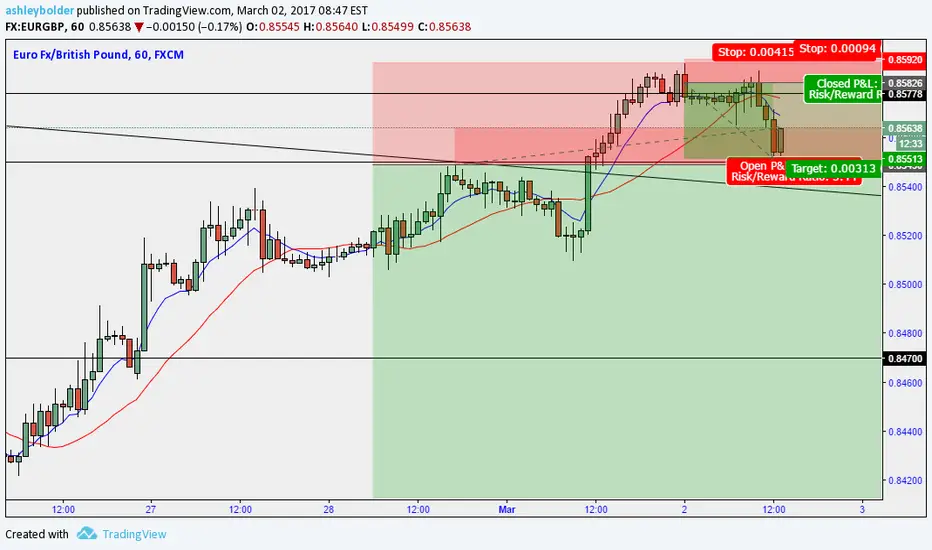
EURGBP Bad trade managementI posted a EURGBP trade a couple of days ago, the entry seemed perfect and the trade was going my way. The trade then went badly against me and broke out of the channel. I pushed my stop a lot higher to 0.85925, I then entered another short around 0.85825. Price came back down 0.85550 where I took profit from my second trade and cut my loses on my first trade ending up with profit.
"How you manage your correct trades makes you a good trader. But how you manage your bad trades, that's what makes you an excellent trader" - Joseph Nemeth
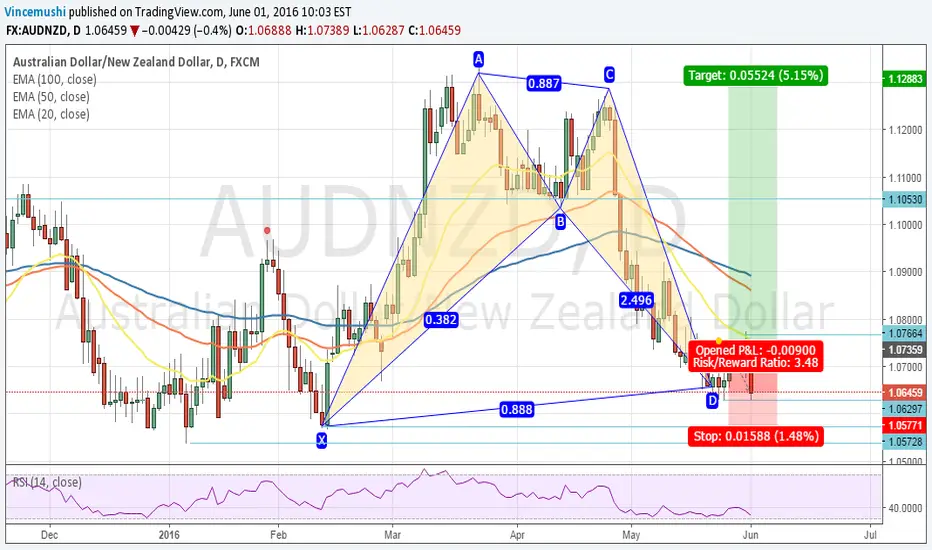
AUDNZD, Short term sell setupLook at our past chart and we are looking to buy the AUDNZD @ around the 886 fib level.
Trade with care

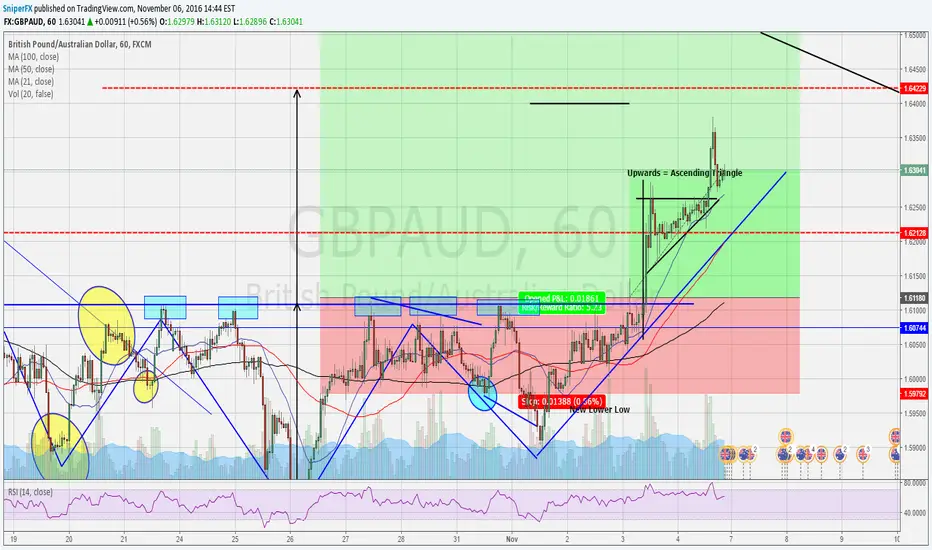
GBP AUD HEAD & SHOULDERS - BREAKOUTTrade taken last week - head and shoulders spotted on hourly
breakout taken,
plus ascending triangle.....
lets see where this takes us....
Update on $EURUSDTarget one Hit for about 54 PIPS, rolling my stops to break even, will be looking for Target 2 at 61.8 Fib retracement
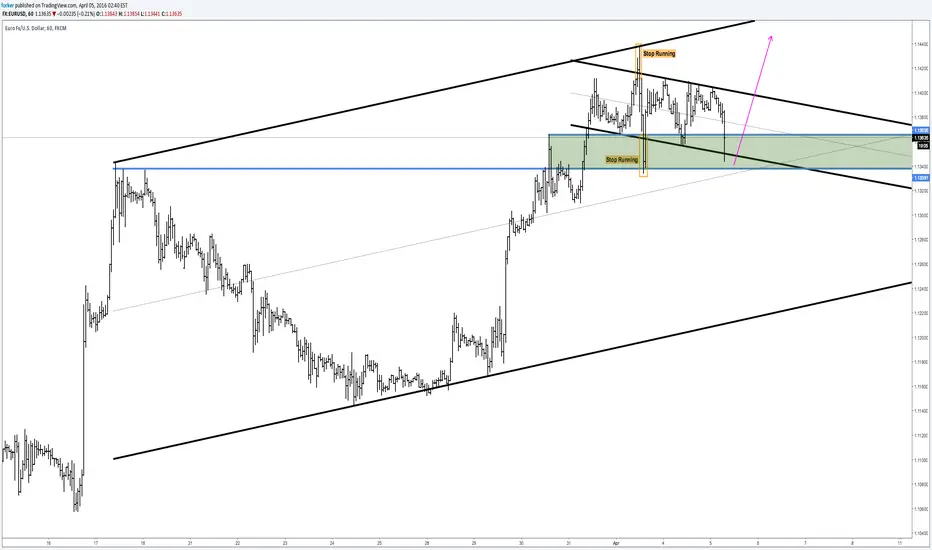
EURUSD - 60min @ supportEven i have my long position setup on the Dayli, i would like to show you this setup.
Price price produces a slanted coil (small one), washes out the stops above and below and finally resumes the main trend. Here we even have a nice support zone (green), where it is super nice to enter.
I allways put my stop below the stop running spike, or on bigger scales even a pivot lower.
Nothing works 100% as we all know. But it is also important as a fulltime trader to TAKE opportunities when they setup. Because in the end, trading is a numbers game, where it's base comes from chances. And the chances are the setups we have, and which we shall backtest and verifiy biy stats! Because these stats are the only thing we can lean on in the long run.
P!
Take the Basic Action/Reaction course for free: mytradingcoach.teachable.com
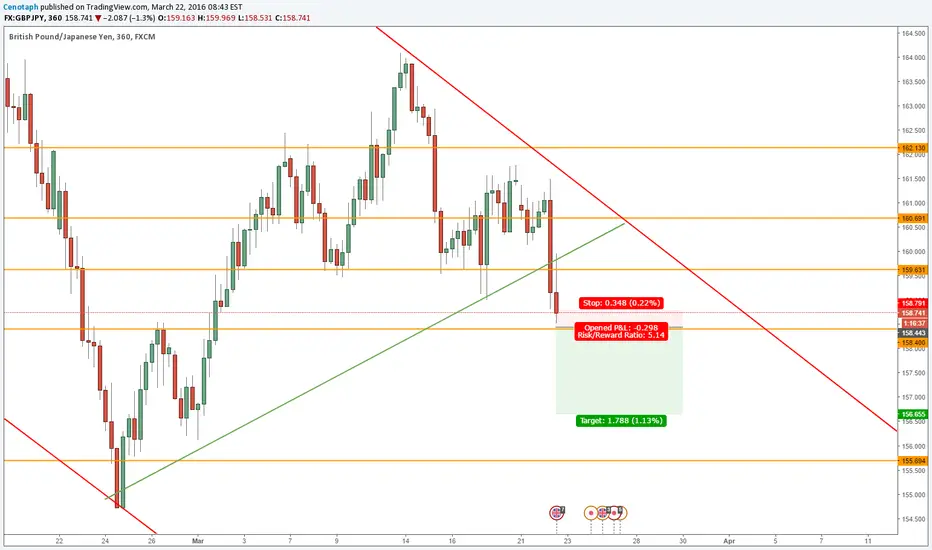
GBPJPY ShortFirst see if there's a likely continuation of this short before entering, when setting your entry wait for it to bounce back on SR. Then enter, this trade should be good for a 1:5 RR trade.

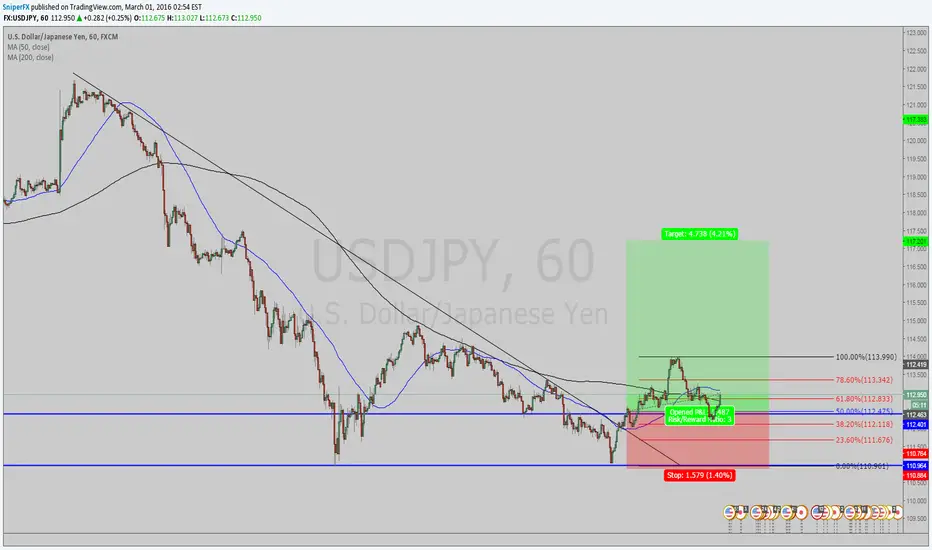
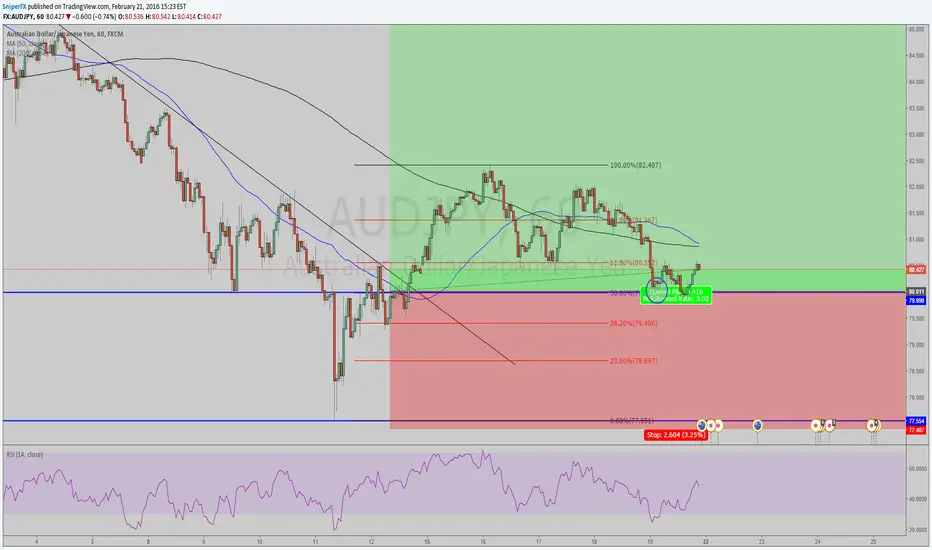
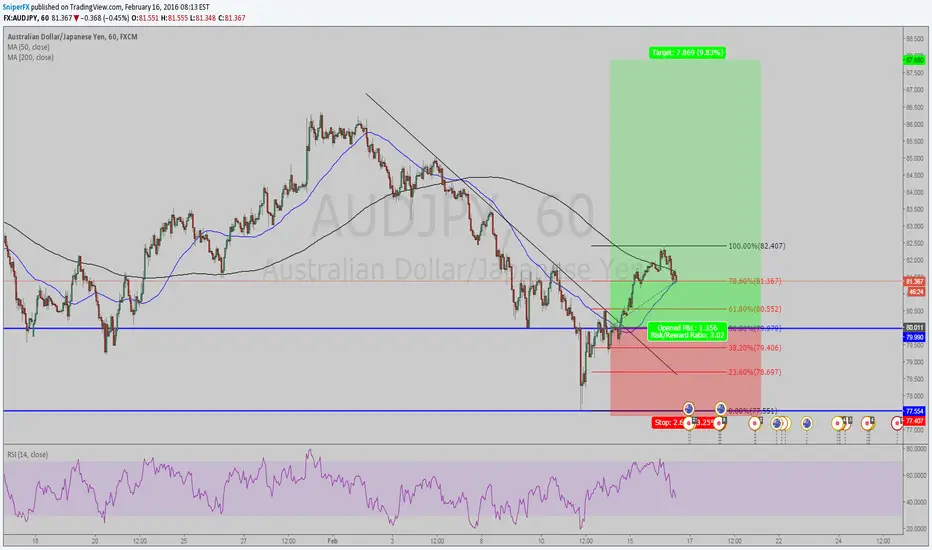
AUDJPY LONGTRADE ENTRY TRIGGERED ON FRIDAY ....PRICE RETRACED TO LEVEL OF ENTRY......
NOW WE WAIT AND SEE WHAT PRICE TELLS US - LOOKING FOR A STRONG NEW HIGH TO ENABLE SL MOVE
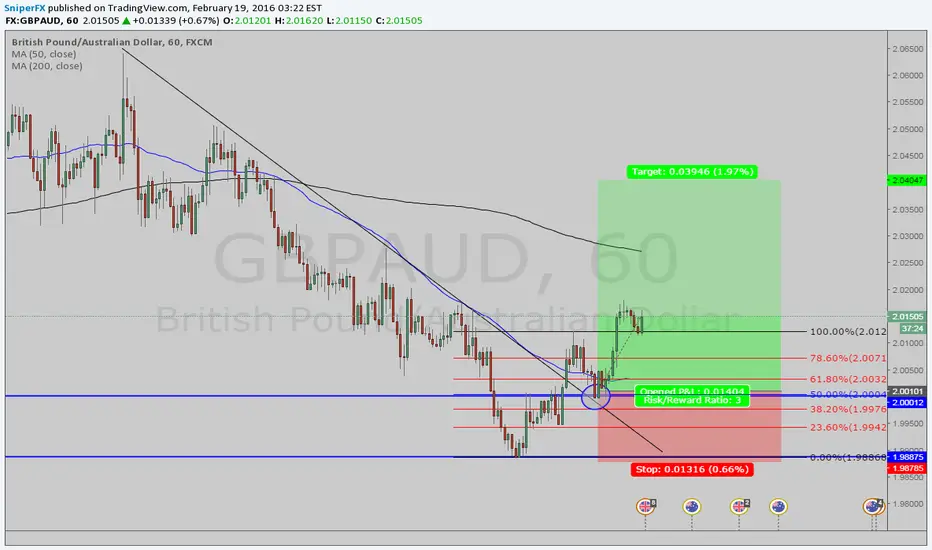
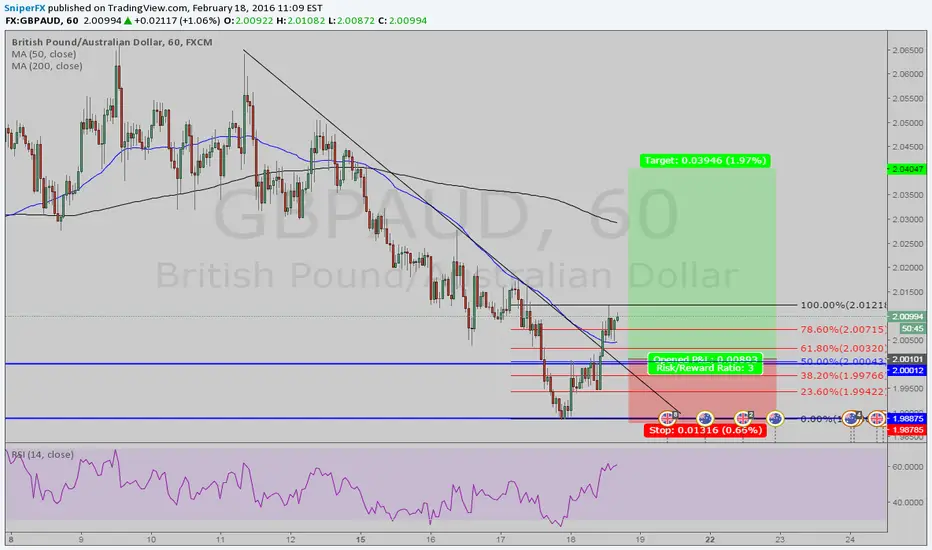
GBP AUD LONGTrade Triggered (Blue Circle), created new high, once it moves higher i will move STOP close to B/E
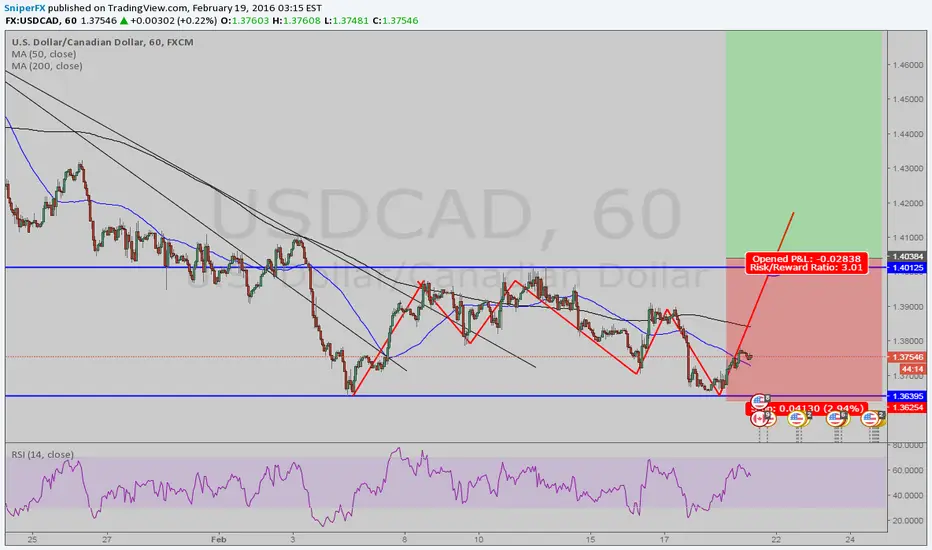
USD CAD LONGConsolidation Break Out......consolidation formation structure, double bottom....
Trade Entry sorted......
Let Price do its magic.
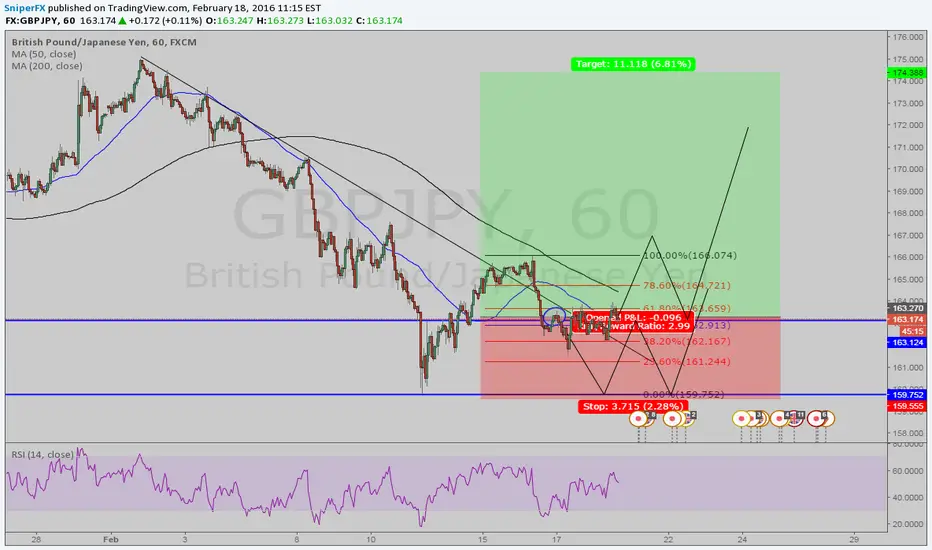
GBPJPY LONGTRADE ENTERED - AND PRICE ENTERED A PERIOD OF CONSOLIDATION, LOOKING FOR PRICE TO HEAD UPWARDS, CREATING A NEW HIGH AND START OF A TREND....
PRICE ACTION WILL MAKE MY DECISIONS FOR ME, I JUST WAIT FOR IT TO TELL ME....

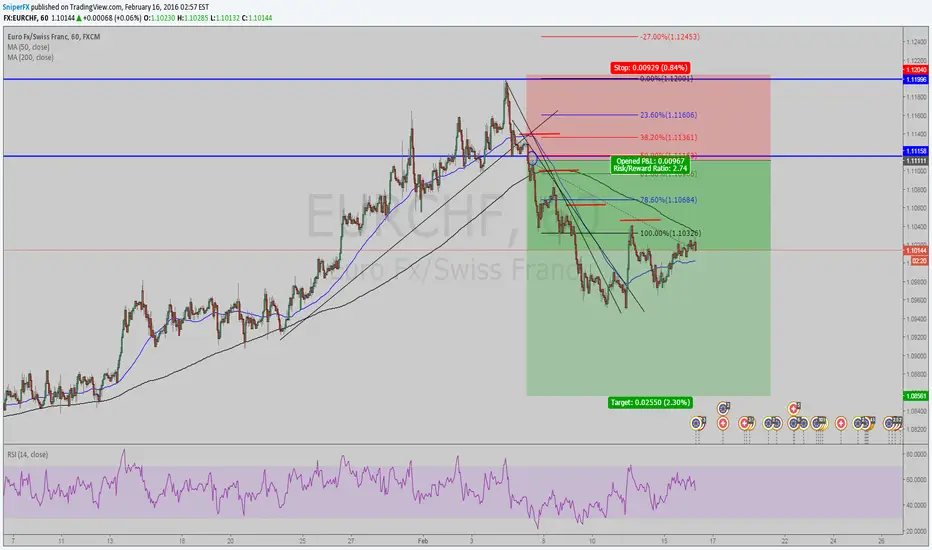
EURCHF SHORTSTOP MOVED TO LOCK IN PROFIT AFTER PRICE BREAKS TREND......LOOKING LESS BEARISH BUT WE WILL SEE.....
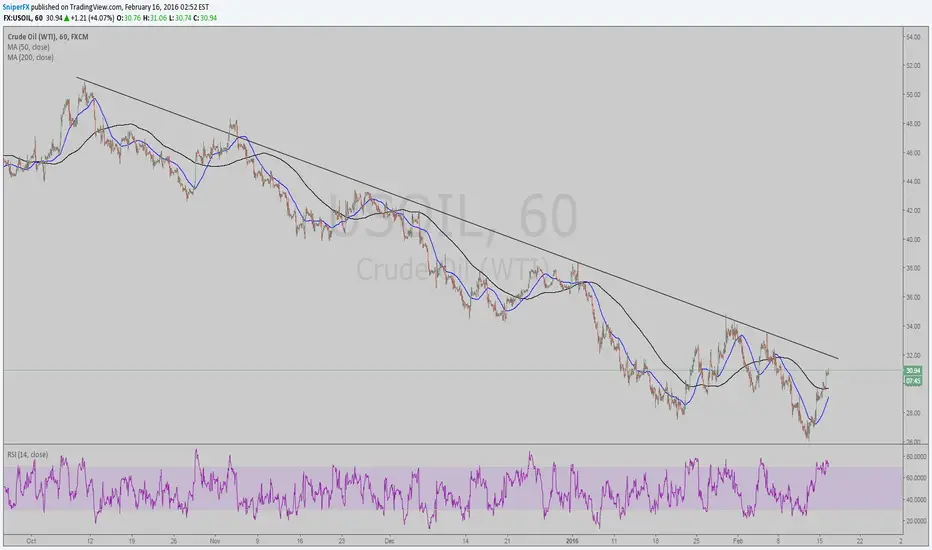
CRUDE OIL LONG WATCHLISTTHIS HAS BEEN ADDED TO MY WATCHLIST - PRICE LOOKING EXTENDED OVER A NICE PERIOD OF TIME.....LOOKING FOR PRICE TO SET UP AS MY TRADING PLAN SUGGESTS AND GO LONG...
LET PRICE DO THE TALKING,.....