How to Prepare Your Mind for Managing Trades Effectively?Have you ever made a decision mid-trade that wasn’t part of your strategy, only to regret it later? Many traders find themselves acting impulsively, closing positions too early or holding on too long, and then wondering where they went wrong.
This common behavior often stems from a lack of psychological readiness and planning. When you step outside your written trading plan, you’re letting cognitive biases and emotions take control. I’m Skeptic , and I’ll explore how to prepare your mind for better trade management and avoid the psychological traps that derail so many traders.
🔍A. The Two Scenarios After Entering a Trade
Once you’ve opened a position, one of two things will happen:
The price moves against you.
The price moves in your favor.
Let’s break these down and discuss how to manage each scenario:
📉Scenario 1: The Price Moves Against You
If you’ve applied proper risk management and set a stop-loss before entering the trade, this scenario shouldn’t bother you at all.
Key Mindset Tip:
Treat the risk as if it’s already a loss the moment you open the trade. For example, if you’ve risked 1% of your account, mentally prepare yourself for that 1% loss in advance. This reduces emotional stress and allows you to focus on the bigger picture.
Let’s say your trade hits the stop-loss. Instead of reacting emotionally, remind yourself that you followed your plan, and the loss is just part of the process.
📈Scenario 2: The Price Moves in Your Favor
Here’s where things get tricky. Without a clear plan for taking profits, you might:
Close the trade too early with a low risk-to-reward (R/R) ratio.
Hold onto the position too long, only to watch it reverse and hit your stop-loss.
Why Having a Take-Profit Plan is Key:
Planning your profit-taking strategy in advance is just as important as setting a stop-loss. If you fail to do so, emotions like greed or fear can lead to poor decisions.
B. Psychological Tools for Better Trade Management 🧠
To execute your plan effectively, you need to address the psychological challenges that arise during trades. Here are some tips:
1. Accepting Losses as Part of the Game
What to Do:
Before entering a trade, ask yourself: “Am I okay with losing this amount?” If the answer is yes, proceed with the trade. If not, reduce your position size.
Why It Helps:
This mindset shifts your focus from fearing losses to executing your strategy.
2. Planning Profit-Taking in Advance
What to Do:
Decide on your take-profit levels before opening a position. For example, if your R/R is 1:2, set your profit target at 2R.
Why It Helps:
This eliminates emotional decision-making and ensures that you’re not tempted to exit too early or hold on too long.
3. Journaling Trades to Improve Performance
What to Do:
Use an Excel sheet or trading journal to track every position. Note the following:
Entry and exit points.
R/R and Win Rate.
Psychological observations (e.g., emotions during the trade).
Why It Helps:
Reviewing your trades helps identify patterns. For instance, you may discover that exiting at R/R 2 consistently yields better results than holding for R/R 3.
C. Personalizing Your Rules
Every trader is different, so it’s essential to customize your trading plan based on your personality and market experience.
Your rules should work for you, not against you.🎯
D. Understanding Cognitive Biases
Psychological errors often sneak into trading decisions. Here are a few to watch for:
1.Confirmation Bias:
Only seeking information that supports your trade idea, while ignoring contradictory signals.
Solution: Stay objective and review all the data, not just what aligns with your view.
2.Loss Aversion:
Closing winning trades too early because you’re afraid of losing profits.
Solution: Stick to your planned take-profit levels.
3.❌FOMO (Fear of Missing Out):
Jumping into trades impulsively or ignoring your plan because you’re afraid of missing a move.
Solution: Always wait for your setup and trust your process.
Managing a trade effectively requires a combination of strong planning and psychological readiness:
Set Your Stop-Loss and Take-Profit Levels: Before opening a position, plan for both loss and profit scenarios.
Prepare Your Mind for Losses: Accept the risk before entering the trade.
Journaling is Key: Track and review your trades to find patterns and improve over time.
Personalize Your Rules: Your trading style should match your personality and risk tolerance.
💬 What’s your approach to managing trades? Do you track your results in a journal? Share your thoughts in the comments below!
I’m Skeptic , here to simplify trading and help you achieve mastery step by step. Let’s keep growing together!🤍
Trade Management

Time to Enter MDB Again?On Thursday afternoon, the King Trading Momentum Strategy signaled alongside eleven other alerts that day, followed by five more on Friday. This activity doesn’t exactly scream “bearish” to me, but the market has a way of keeping you on your toes! With markets once again approaching all-time highs, I’ve been treading cautiously. My positions have been limited to just a few, with low allocation sizes in TNA, ADBE, PYPL, and XYZ.
When I looked at MongoDB (MDB), I found myself wondering why it was hammered after posting a double beat on earnings and providing decent guidance. It turns out the recent drop was primarily driven by the announcement that Michael Gordon, MongoDB's Chief Operating Officer and Chief Financial Officer, will be stepping down on January 31, 2025. Is this reaction overblown? After all, the company delivered a strong earnings report.
That said, MDB seems to have planted its bull flag in the ground. Even if this news creates headwinds, there’s a possibility it could retrace back to the 38% Fibonacci level. Even if the broader market eventually pulls MDB lower, this setup suggests an 8% potential upside, and I’ve set an initial take profit at 5% with a 3% stop loss. If this can hit the take profit, I will sell half to protect the trade and then set a trailing stop loss of 1.5% on the remainder, trying to sell of much of it as possible on the way up!
Unless Monday brings a complete washout due to fears surrounding the Fed meeting on Wednesday or the PCE data on Friday, I’ll likely use the typical morning volatility as an opportunity to enter this trade. Let’s see how this one plays out!
The King Trading Momentum Strategy combines the 5 EMA crossing above the 13 EMA, RSI strength, favorable momentum as measured by ADX plus evaluating recent volume changes and even something that measures breakout momentum called Beta for this one! MDB and over 100 equities are built into this script with optimal backtest take profits and stop losses and can be toggled on by simply checking a box (default they are turned off).

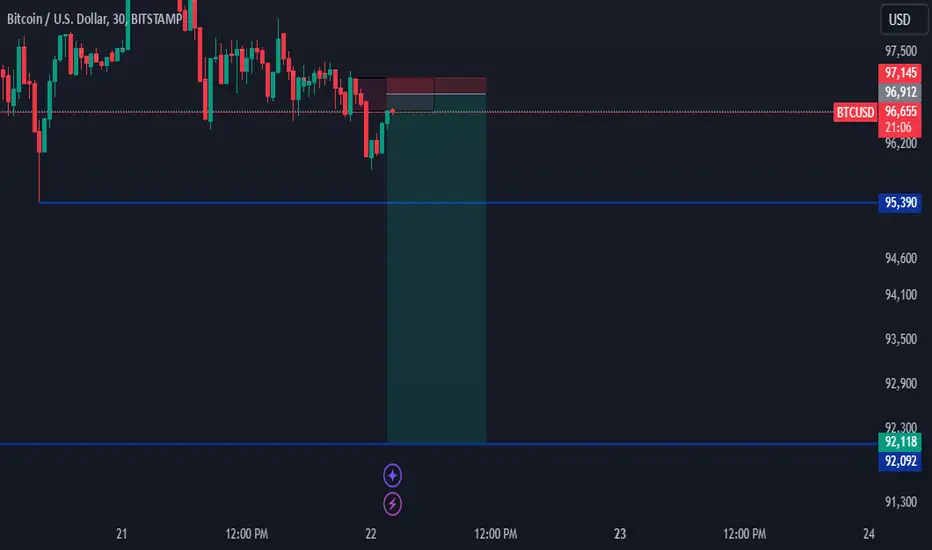
BTCFDUSD to touch 92000 AgainThe price action tells all ,just read the number and check its historical data.
The price will have to fall .

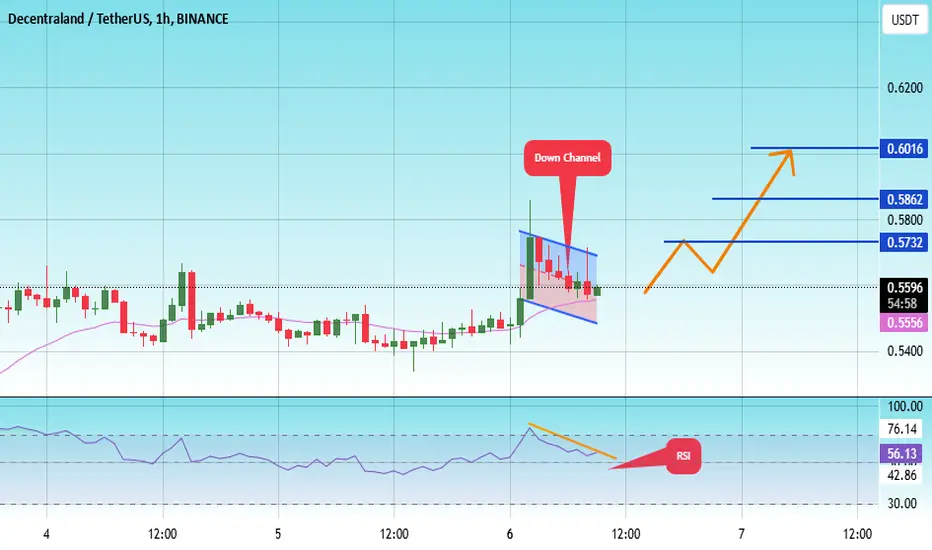
#MANA/USDT Ready to go higher#MANA
The price is moving in a descending channel on the 1-hour frame and sticking to it well
We have a bounce from the lower limit of the descending channel, this support is at 0.5516
We have a downtrend on the RSI indicator that is about to be broken, which supports the rise
We have a trend to stabilize above the 100 moving average
Entry price 0.5593
First target 0.5732
Second target 0.5862
Third target 0.6016
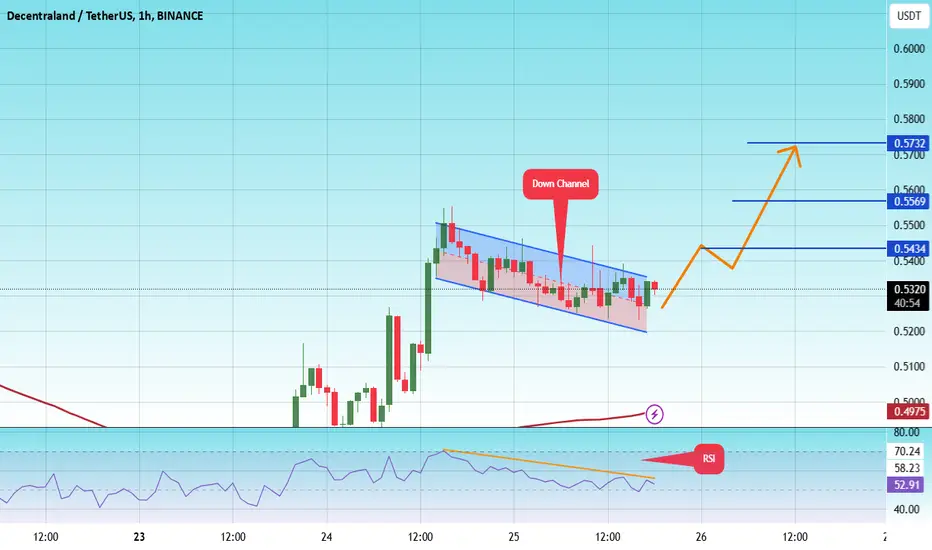
#MANA/USDT#MANA
The price is moving in a descending channel on the 1-hour frame and is expected to continue upwards
We have a trend to stabilize above the moving average 100 again
We have a descending trend on the RSI indicator that supports the rise by breaking it upwards
We have a support area at the lower limit of the channel at a price of 0.5240
Entry price 0.5317
First target 0.5434
Second target 0.5570
Third target 0.5732
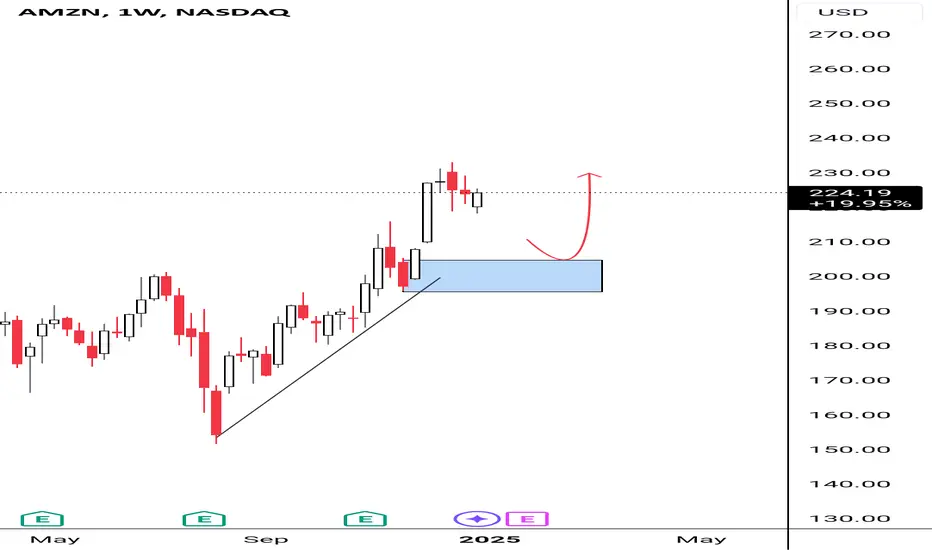
Amzn wk longsAmazon wk showing longs. We can use this demand for daytrades upto its departure area only. After hitting departure we will decide either we go up or down.
GoldToday price headed up wonderfully, and it may do so next opening but I'm expecting a retracement before new highs are formed watch the Sibi shown and the inversion. GOOODTRADING YALL. $£
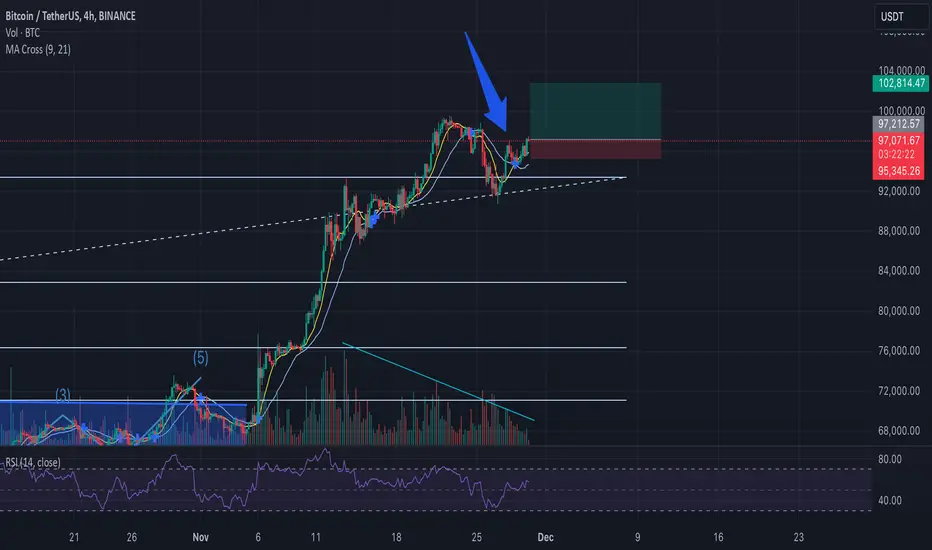
BTC is going finally to 100k?Hey guys!
We finishing this week with nice news?
So quick update about bitcoin situation. We have here bull MA crossing oon 4H TF, so we can potentially see some long movement on the weekends. Another bull sign can be a Thannksgiving Day, so markets can react positive.
On the other hand we have descending volumes and not really active movement.
Don't forget to use SL and follow risk management!
What's your thoughts about the short market condition?
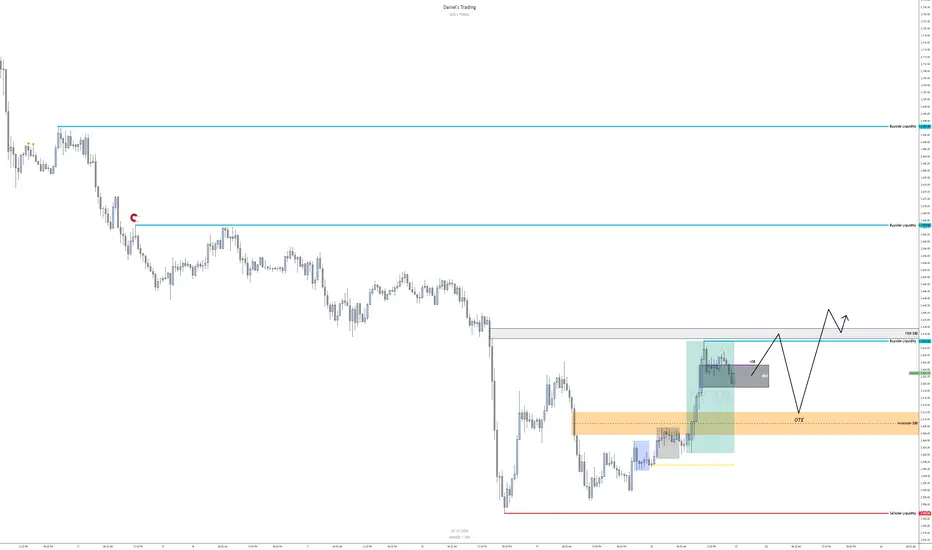
Understanding Trends and Waves in TradingIntroduction
In trading education, recognising price movements is crucial. Prices move in trends, and these trends move in waves. Understanding these waves is essential for successful trading.
The Two Types of Waves
Impulsive/Primary Trend
Comprises a minimum of five waves.
Dictates the overall direction of price movement.
Corrective/Secondary Trend
Comprises a maximum of three waves.
Provides insights into the ongoing trend.
This phase is the most critical for traders to master.
Conclusion
To trade successfully in a trending market, it’s vital to learn how to accurately count waves. Mastering this skill can significantly enhance your trading decisions. Best wishes for your trading success!

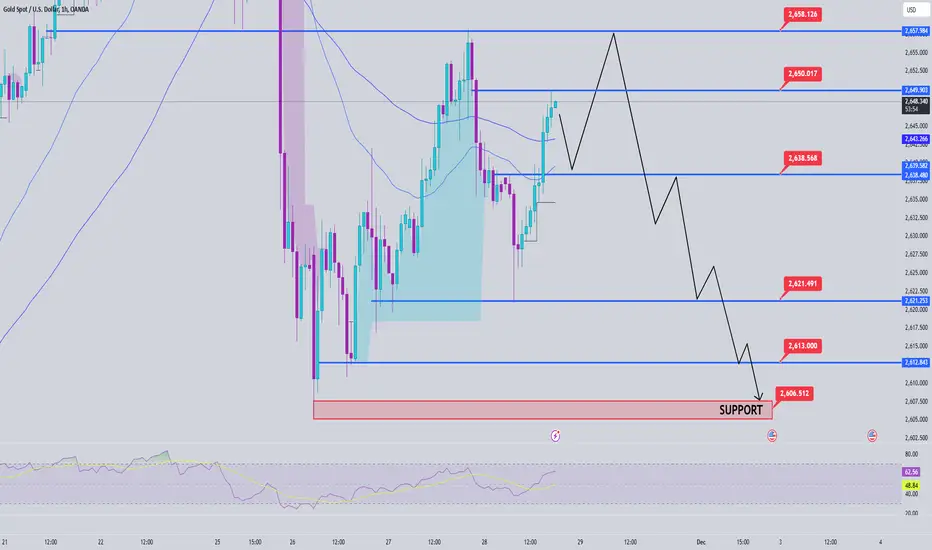
Gold Price Analysis November 28Gold is trading near the resistance zone of 2650, this zone becomes the key zone for today's trading day. If before the US session, gold cannot break this zone, the gold trend will continue to fall to important support zones. Pay attention to the support zones of 2638, 2621-2613, 2605 to have the best trading strategies when the price falls to that zone. In the opposite direction, the 2650 zone is broken, gold will return to the uptrend. If gold closes the daily candle above 2658, it is determined that gold is ready to return to the uptrend and head to 2700 soon. Wish you successful trading.
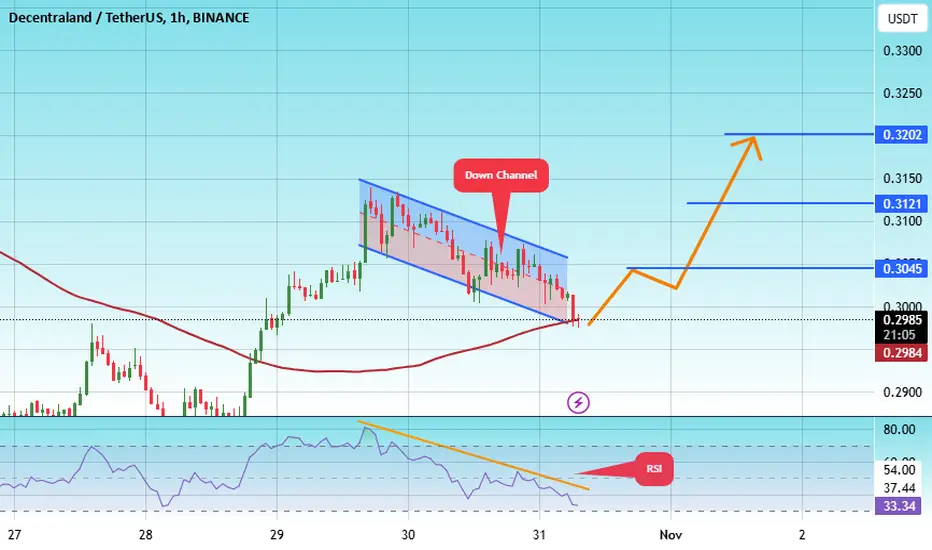
#MANA/USDT#MANA
The price is moving in a descending channel on the 1-hour frame and is sticking to it well
We have a bounce from the lower limit of the descending channel and we are now touching this support at 0.2980
We have a downtrend on the RSI indicator that is about to be broken, which supports the rise
We have a trend to stabilize above the 100 moving average
Entry price 0.2988
First target 0.3045
Second target 0.3121
Third target 0.3200
GOLD :- SELL NOWA downtrend in gold is characterized by lower highs and lower lows, supported by moving averages, trend lines, and strong resistance at recent high levels.
Key indicators like RSI and MACD can provide insights into momentum and potential reversal signals.
Support and resistance levels, volume trends, and sentiment indicators give additional context to gauge if the downtrend is likely to continue or if a reversal could be underway.
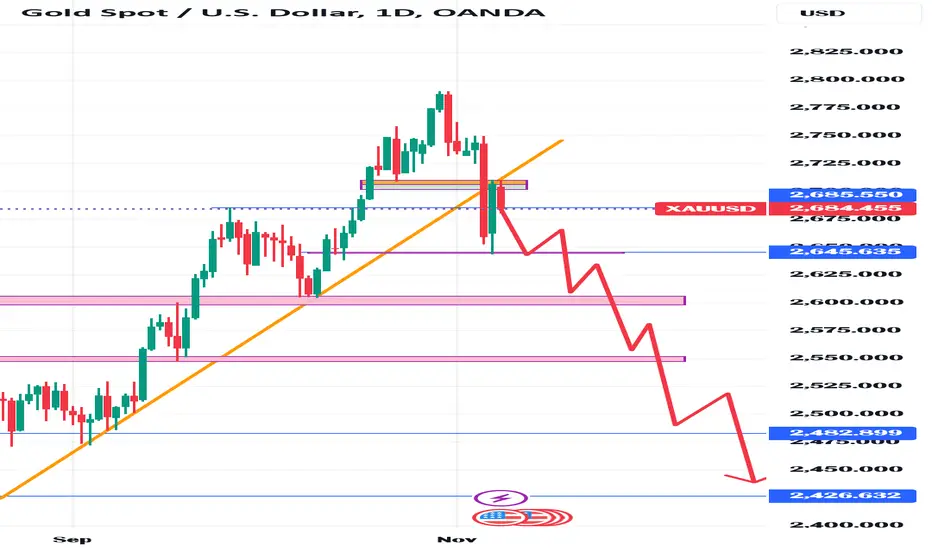
Gold price analysis November 7Fundamental Analysis
Gold (XAU/USD) extended losses for a second straight session on Thursday. The dollar-denominated precious metal faced downward pressure from a stronger US dollar (USD) following former President Donald Trump’s victory in the US election.
Gold prices are under pressure as safe-haven flows ease amid market optimism and the “Trump trade”. The move was driven by the apparent victory of the president, while the market had previously anticipated a controversial outcome.
The US Federal Reserve’s (Fed) policy decision will be in focus on Thursday. Markets expect a modest 25 basis point rate cut this week. This could be supportive for Gold as lower interest rates reduce the opportunity cost of holding non-yielding assets. The CME FedWatch tool shows a 98.1% chance that the Fed will cut interest rates by 0.25 percentage points in November.
Technical Analysis
After yesterday's sharp decline, Gold is being adjusted slightly higher at the beginning of today's Asian trading session. Pay attention to the 2677 port area for SELL strategies in the Asian and European sessions. The 2625 and 2603 support areas become key support levels and also become TP zones for SELL signals. The psychological port breakout zone of 2700 becomes an important resistance zone at the moment when Gold prices have some retests.
Calm before the storm. Waiting for the rockets to launchI've covered many topics in this video
The difference between myself and others is that I speak from real world experience whilst others keep trying the 'sell the dream'
bullsh*t baffles brains, and that's not what I'm about
So if you are a student of the markets I hope you are taking notes of these golden nuggests

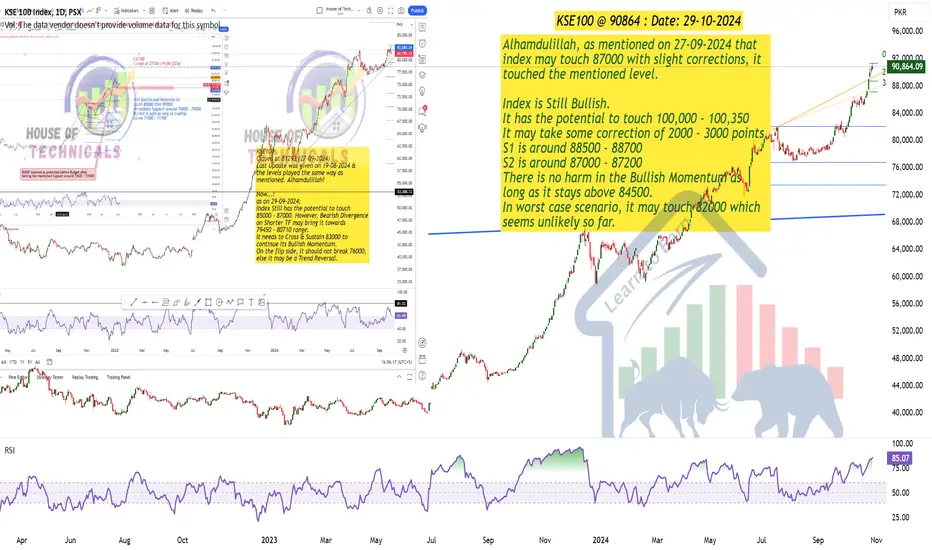
Slight Correction Needed?Alhamdulillah, as mentioned on 27-09-2024 that
index may touch 87000 with slight corrections, it
touched the mentioned level.
Index is Still Bullish.
It has the potential to touch 100,000 - 100,350
It may take some correction of 2000 - 3000 points.
S1 is around 88500 - 88700
S2 is around 87000 - 87200
There is no harm in the Bullish Momentum as
long as it stays above 84500.
In worst case scenario, it may touch 82000 which
seems unlikely so far.
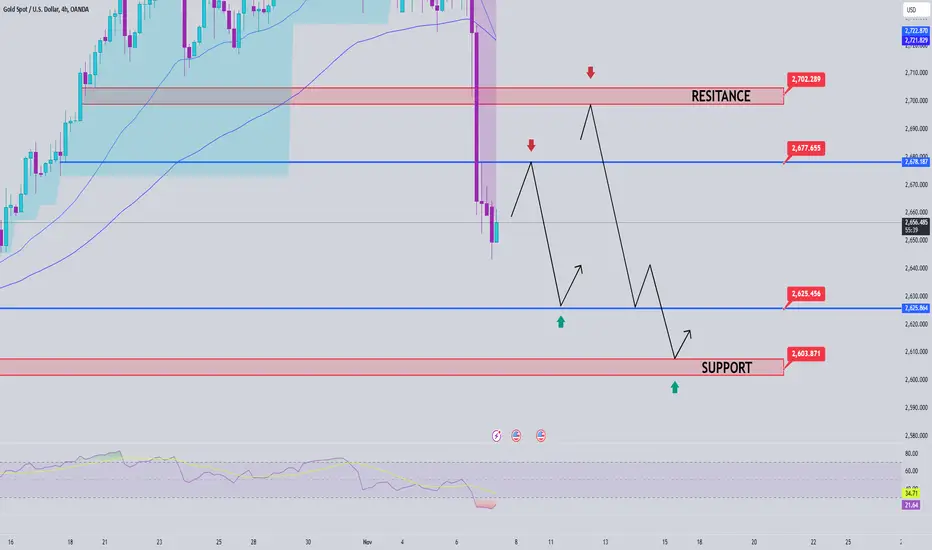
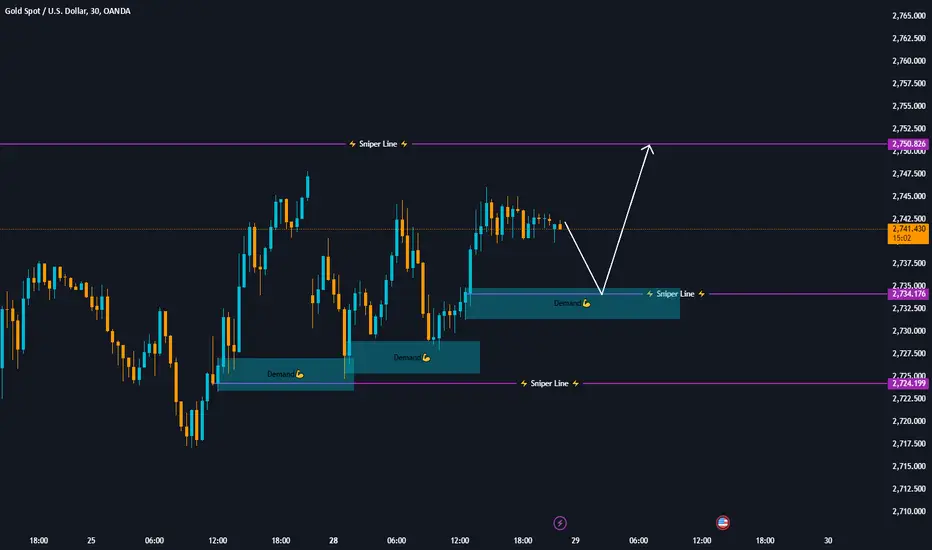
XAUUSD: Watch for a Sharp Decline Soon!XAUUSD MARKET ANALYSIS
Today, we are focusing on key intraday levels that could influence trading decisions:
Support Level: 2734-30
Resistance Level: 2748-50
Upcoming Market Events:
This Friday, we have the highly anticipated Non-Farm Payroll (NFP) report, which historically tends to create significant volatility in the market. The data released can lead to quick price movements, offering potential trading opportunities.
Monitor Price Action:
If the price approaches the support level (2734-30) and holds, it may provide a buying opportunity, signaling potential upward momentum.
Conversely, if the price breaks through the resistance level (2748-50), it could indicate a bullish trend, suggesting traders might consider entering long positions.
Consider Market Sentiment:
Pay attention to pre-NFP sentiment in the market. A strong jobs report could lead to a rally, while a weaker report might trigger a sell-off. Adjust your strategies accordingly.
If you find this analysis valuable, please like the idea. Your support motivates us to continue providing high-quality content!
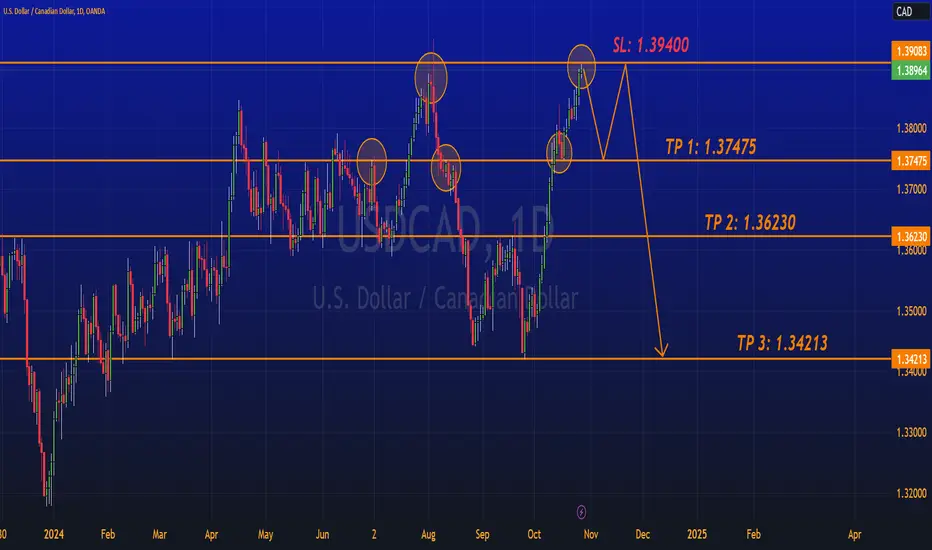
USDCAD Sell Short (Final)I have been analyzing USDCAD for a while now and I believe this is the time for a double top to be formed and that M formation shall be taking place like the previous W pattern USDCAD has built up. As seen in the chart, USDCAD touched for a double bottom at 1.34213 which I predict that we shall be lead to that level again. USDCAD has far too long rallied and we should all be shorting this very top to make all our profits again. Rinse, repeat, and learn from these lessons in trading. I also wanted point out that in our analysis we have highlighted where previous support and resistances have broke out and lead to new higher highs and now lower lows when we come back down from this entry at 1.38973 I hope you all enjoyed our analysis! We also have included TP and SL in the chart and please follow our page for more signals like these! If you have any questions about this trade please send me a direct message and I will respond swiftly.
Thanks for stopping by!
Mastering the "IF-THEN" Mindset: The Key to Stress-Free TradingIn this video, I’ll share how using IF-THEN statements helps me stay balanced in my trading. It’s simple: IF the price does this, THEN I’ll do that. Having a plan like this keeps me from getting caught up in emotions and helps me react to what’s actually happening in the market – not what I wish would happen.
This mindset keeps things smooth, makes trade management easier, and keeps me consistent. It’s all about staying ready for whatever the market throws your way.
If this vibe clicks with you, drop a comment, like, or follow – I’ve got plenty more insights to share!
Mindbloome Trading
Trade What You See

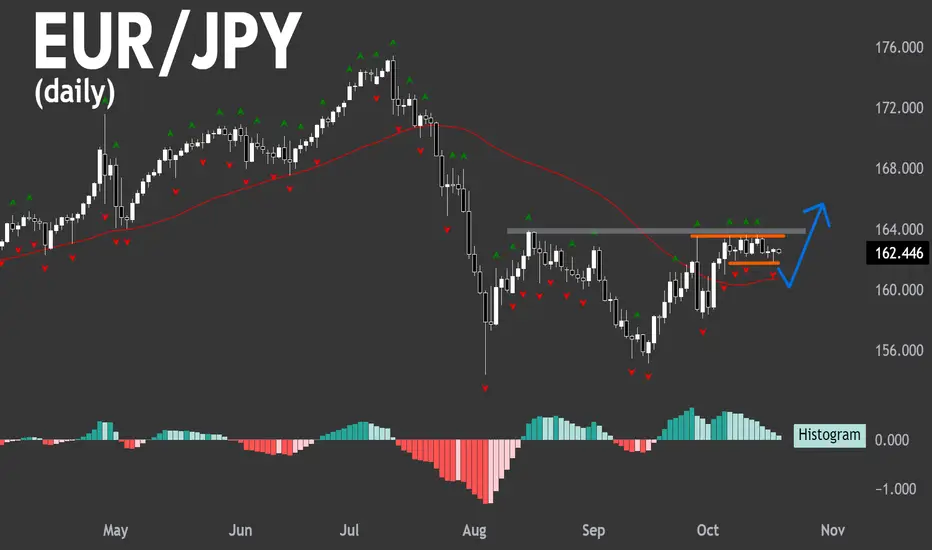
EUR/JPY: Tight range when other EUR-pairs are weak. HmmmDo you trade
A) Before the breakout for a better price OR
B) After the breakout for confirmation ?
We usually prefer B)
But it helps to think through some scenarios that could happen beforehand
Looking at EUR/JPY - see how it is trading in a tight range?
Well other EUR pairs like EUR/USD have been falling. That shows relative strength .
Or put another way - the yen is relatively weak.
The price could just break straight to the topside - or it could first try to break lower in a fakeout - before breaking to the topisde.
If the latter does happen - it will be one of those occations we could trade before the =breakout ;)
What do you think happens?
Maybe the trend turns lower - and neither scenario above is right - could easily be.
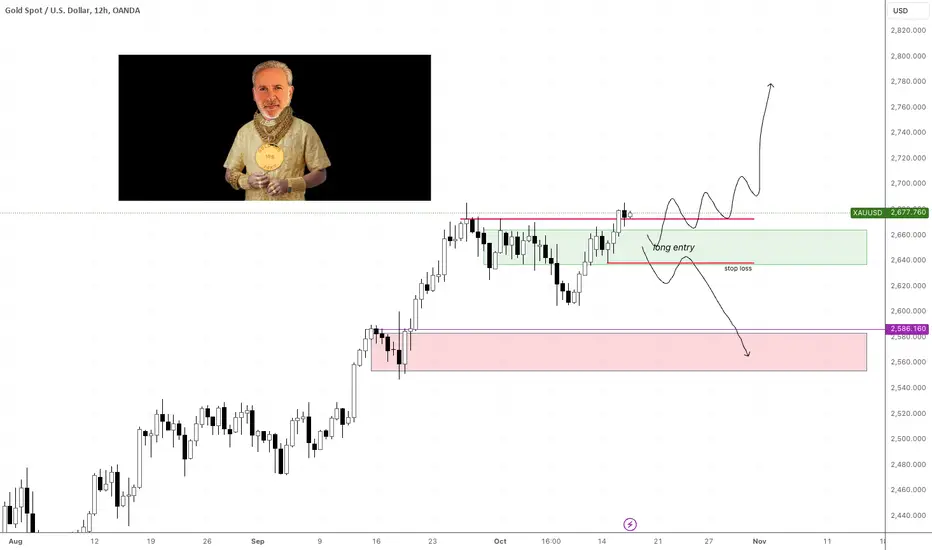
Peter Would be Proud! NEXT LEG UP CONFIRMED?#gold TVC:XAU We have now confirmation on the 12h chart by having a close strong above previous highs.
Entry on any retrace toward the green price range AND PLACE YOUR STOP at the most recent low.
If we do break below this low then we might be in for a bigger retrace... #SADPETER
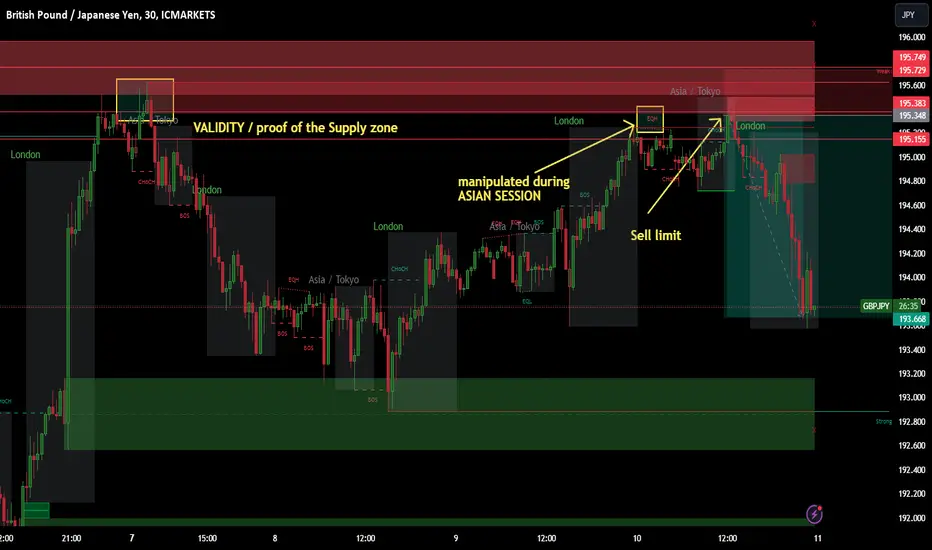
GBPJPY Sell Trade Activated Oct 10 2024Supply Zone introduced since October 4 2024: this is just a continuation of analysis in gbpjpy using daily supply, 4h supply and 1H supply. Sell limit was activated during Asian session. Aiming for 4:1RR. This was a product of multi-timeframe analysis including lower timeframes. Always looking for validity and not market execution trading.
Intraday may look liked difficult but getting used to charts within 600hrs of discipline will give you an EDGE.
#supplyanddemand
#proprietarytrader.
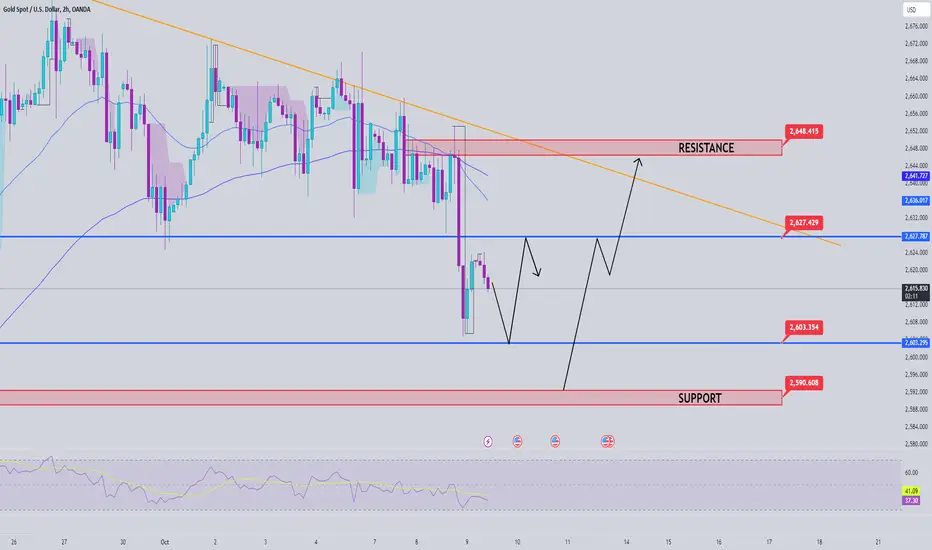
Gold price analysis October 9Fundamental Analysis
Gold prices fell sharply on Tuesday following a strong US jobs report and news reports that Hezbollah backed calls for a ceasefire in the conflict between it and Israel. As a result, hints of a possible de-escalation of the Middle East conflict opened the door for traders to take profits. XAU/USD traded at $2,615, down more than 1%.
This prompted a sell-off in XAU/USD, which fell more than $35 to an intraday low of $2,604 before buyers took it to the current spot price. Additionally, rising US Treasury yields weighed on the non-yielding metal. The benchmark US 10-year yield remained unchanged above 4%, but has risen more than six basis points this week following last Friday's September Non-Farm Payrolls (NFP) report.
Against this backdrop, interest rate traders have adjusted their expectations for the next move by the Federal Reserve (Fed). Most Fed speakers have been gradual in their tone toward easing monetary policy. However, some, like St. Louis Fed President Alberto Musalem, only expect one more cut by year-end after backing a 50 bps cut in September.
Technical Analysis
The Asian session range that we are paying attention to is around 2603 and 2627. The bottom support zone that the US session touched last night is also known as session support. The resistance zone is a breakout retest zone that the market respects. The upper range converges with the 34 EMA for a good trading plan in the Asian session. In the US session, the price range is wider with the price zone of interest around 2592 and the resistance of 2648 is considered a key price zone to hold the price from long declines.