NZDUSD – Breakout from Inverse Head & Shoulders + Trendline AreaNZDUSD is showing a bullish reversal setup on the 1-hour chart.
Price has broken above a long-standing descending trendline, indicating a potential shift in market structure.
A clear Inverse Head & Shoulders pattern has formed, suggesting a bullish reversal.
Price has broken above the neckline and the key resistance zone (highlighted in grey)
he 50 EMA has now been reclaimed, supporting the bullish bias
Trader1mran

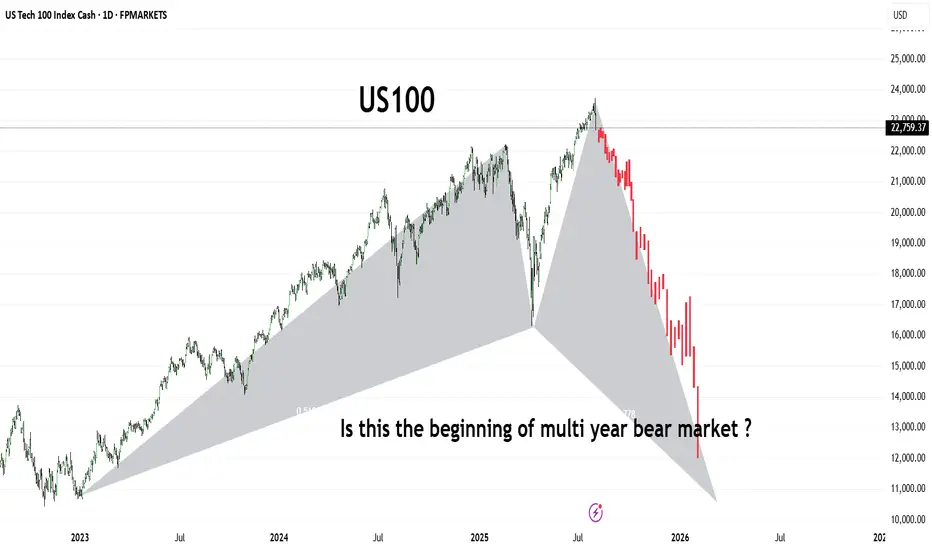
US100The US100 (Nasdaq 100) has shown a dramatic shift in trend, forming what appears to be a large-scale bearish harmonic pattern or potential M-top structure. After reaching its peak in mid-2025, the index has entered a sharp downward trajectory, shedding significant value in a short span.
This chart raises a critical question for long-term investors and traders:
Are we witnessing the early phase of a prolonged bear market that could stretch into 2026 and beyond?
🔻 Key Observations:
Bearish structure developing with aggressive selling pressure.
Potential breakdown from long-term support trendlines.
Momentum suggests institutional risk-off behavior.
Stay alert for macroeconomic cues, interest rate policy, and earnings season signals. A break below 13,000 could confirm a deeper bear cycle
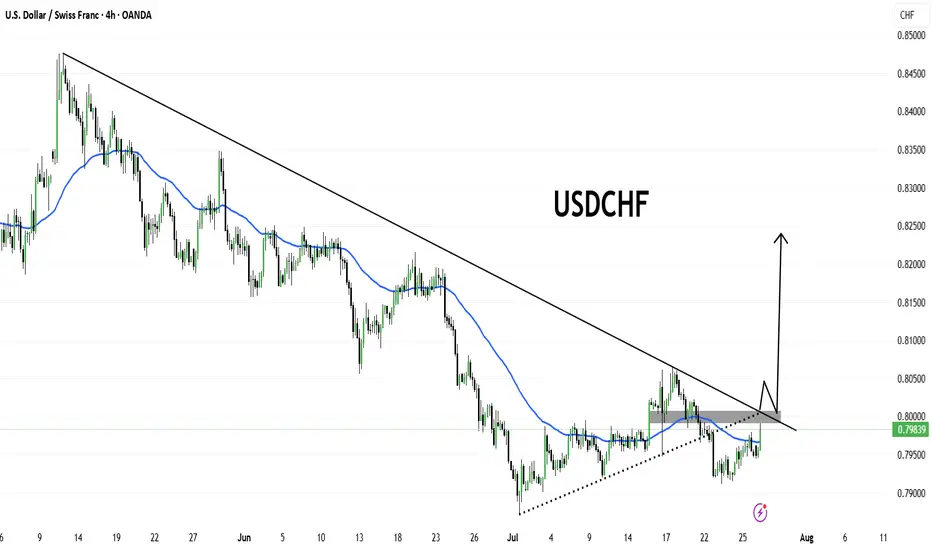
USDCHFUSDCHF is approaching a critical breakout zone after forming a bullish ascending triangle pattern. The pair has been in a sustained downtrend but is now testing the confluence of a descending trendline resistance and the 50-period EMA.
Price is currently consolidating just below the key resistance zone near 0.8000. A clean breakout and retest of this zone could trigger bullish momentum, potentially targeting the 0.8250 region in the coming sessions.
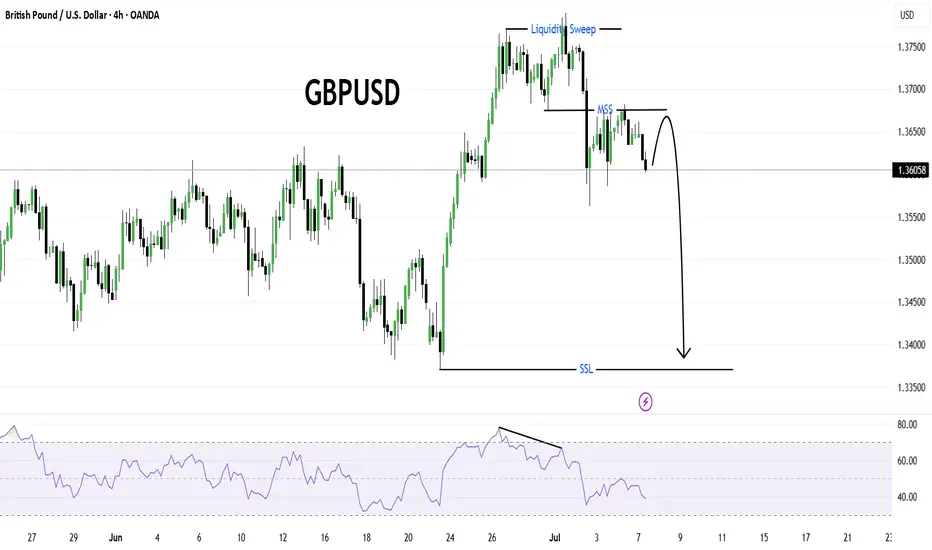
GBPUSDThe market structure on GBPUSD shows a clear liquidity sweep above recent highs, followed by a market structure shift (MSS) to the downside, signaling a potential reversal. After the liquidity grab, price failed to sustain above the swept highs and started to form lower highs.
The RSI indicator also confirms a bearish divergence, strengthening the bearish bias. Currently, price is consolidating below the MSS level, which could act as a supply zone on any retest.
A strong bearish continuation is expected, targeting the SSL (Sell-side Liquidity) level marked below, which aligns with a potential demand zone from late June. The bearish projection suggests a move toward the 1.3350–1.3400 area.
This setup favors short opportunities on lower timeframe pullbacks, maintaining a bearish outlook as long as the price remains below the MSS.
XAUUSDGold has shown a strong historical pattern of impulsive rallies followed by significant corrections. After the recent explosive move from the $2,067 breakout zone to new all-time highs around $3,500, representing a +67% rally, the metal appears overextended and due for a healthy pullback.
Past cycles suggest that after such parabolic moves, price tends to retrace back to key demand zones or previous accumulation levels. In this case, the medium-term correction target aligns with the $2,800–$2,750 region — a strong structural support and confluence with the 2024 breakout base.
While the long-term trend remains bullish, this setup hints at a potential mean reversion or consolidation phase. Traders should remain cautious at current highs and watch for signs of distribution and lower highs forming in the coming weeks

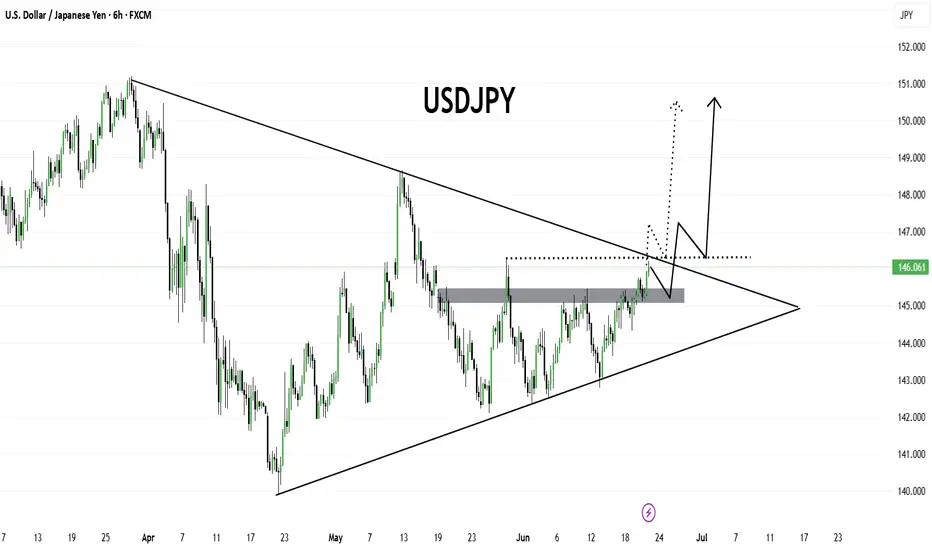
USDJPYUSDJPY is currently approaching a major breakout zone as it nears the apex of a symmetrical triangle pattern. The pair has broken above the key horizontal resistance area around 145.80–146.00, which previously acted as a strong supply zone. Price is now challenging the descending trendline resistance.
A confirmed breakout and retest of the triangle and resistance zone may open the door for a bullish continuation toward 147.50, and potentially 150.00+, as marked on the chart. However, if the breakout fails, we may see a pullback toward the 145.00–144.80 support region before any further upside.
This setup highlights a potential breakout-retest-continuation scenario. Traders should watch for price action confirmation near the trendline for further direction.
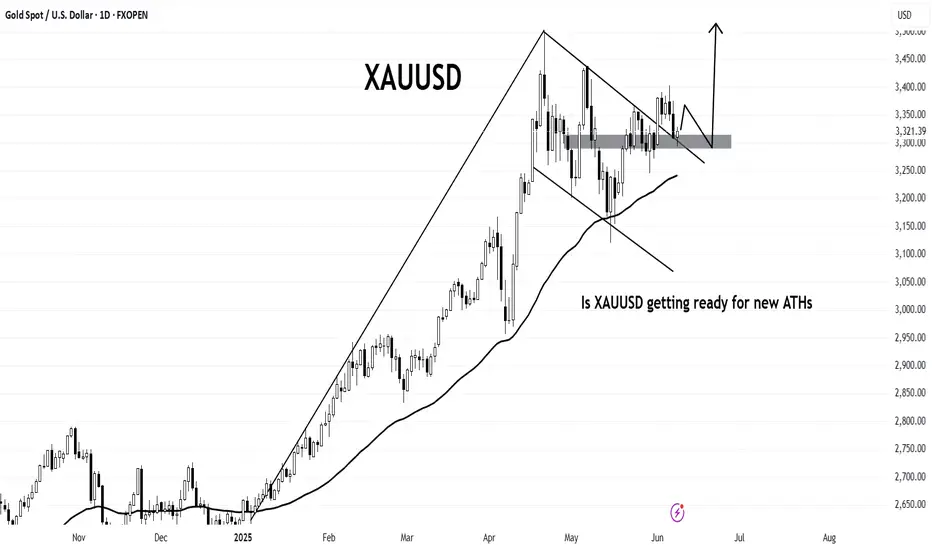
XAUUSD Is XAUUSD getting ready for new ATHs? Gold has formed a clear bullish flag pattern and retested it clearly. One Thing I am looking for the retest of 50 DEMA . If the Price holds above the 50 DEMA, there are much chances that gold may target the new ATHs very soon.
What you guys think about it?
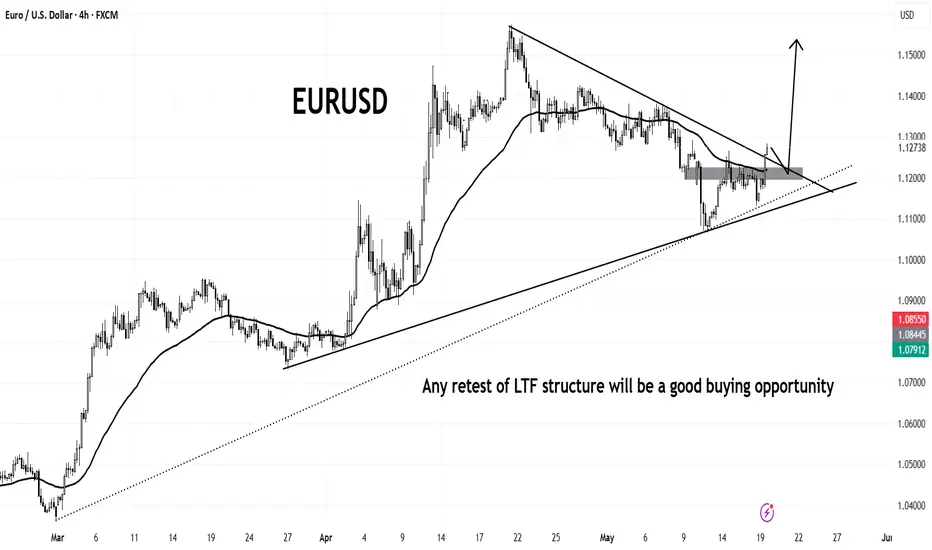
EURUSDEU is forming a solid bullish structure. Recently is break through the ascending symmetrical triangle with solid bullish candle. Any retest of LTF structure will be a nice buying opportunity.
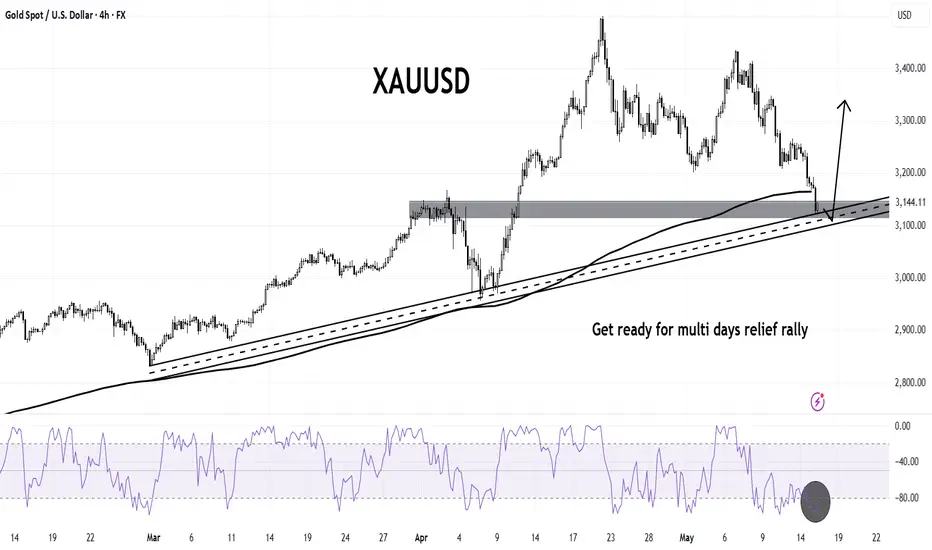
XAUUSDGOLD is been pushed down very hard and now is trading at very crucial level, horizontal and at trendline support.
William percentage range is at over sold level which is also suggesting a relief rally in gold.
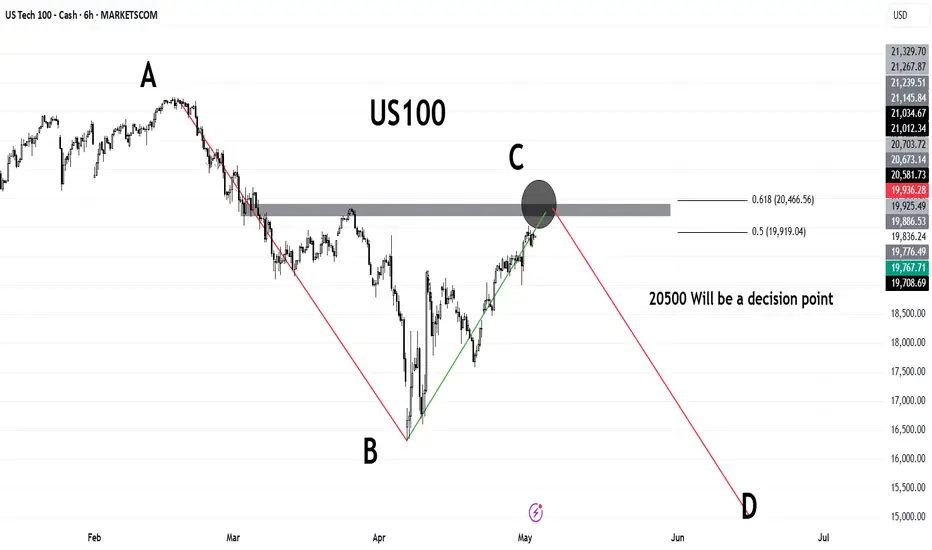
US100US100 has shown great strength after terrif news.
If we look at the bigger picture, recent bullish rally looks like a pull back. Currently it is heading towards very important region , 20500 which is also the 61% retracement level.
If the price close above 20500 then we can consider it a new bullish rally.
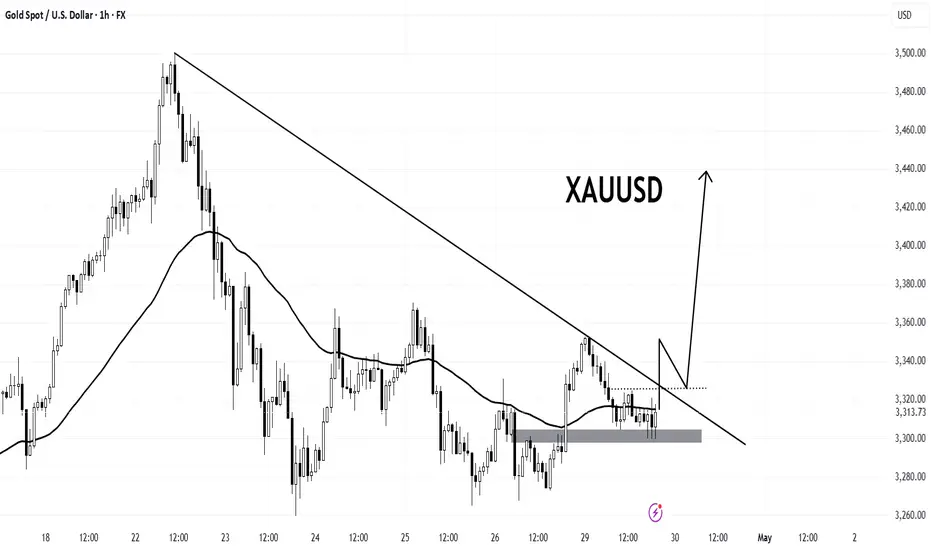
XAUUSDIs XAUUSD building for massive breakout?
If XAUUSD sustains 3300 level then it can target 3400 in no time.
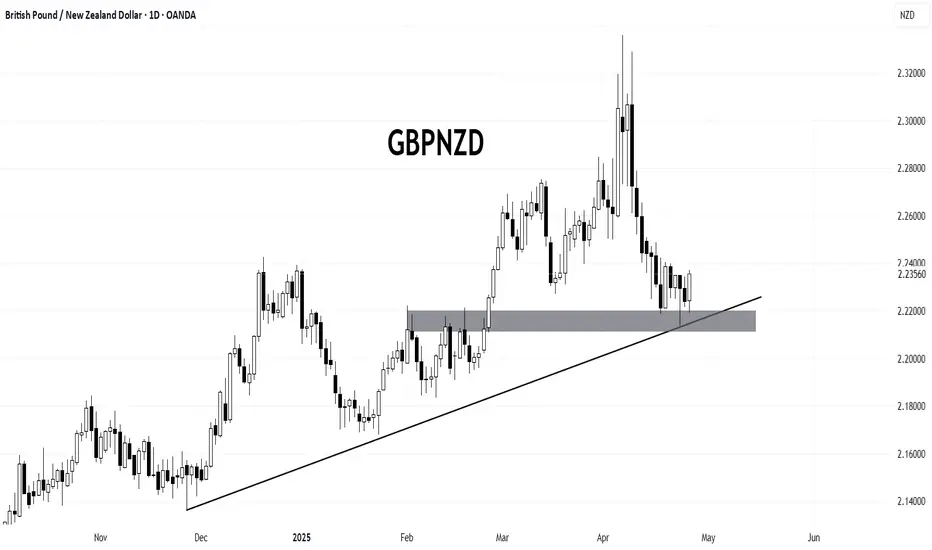
GBPNZDGBPNZD is forming strong bullish structure.
Recently the price is retraced to Daily breakout level and also has given the pivot to daily inclining trendline.
It looks like a perfect buy setup.
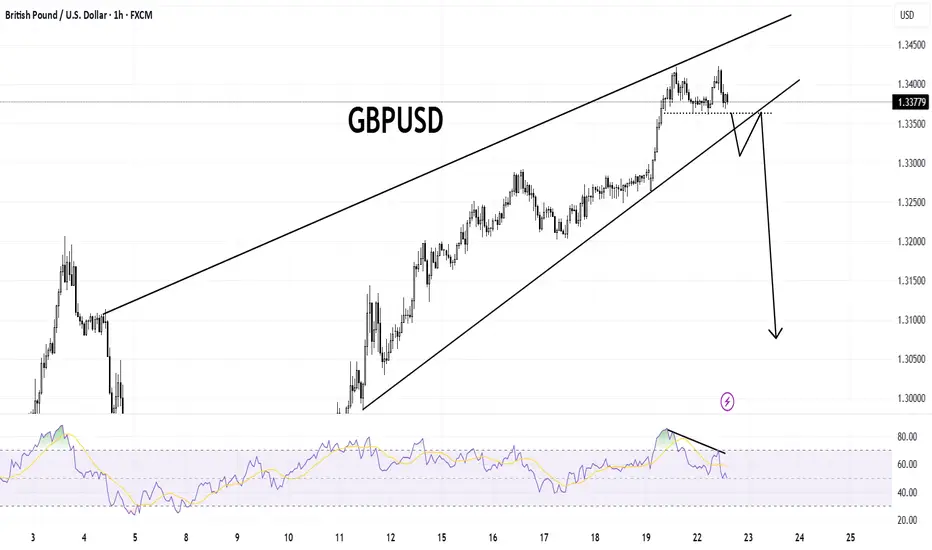
GBPUSDRising wedge with bearish divergence, break of 1.3360 , which is the neckline of double top, break of this neckline starts the immediate sell pressure.
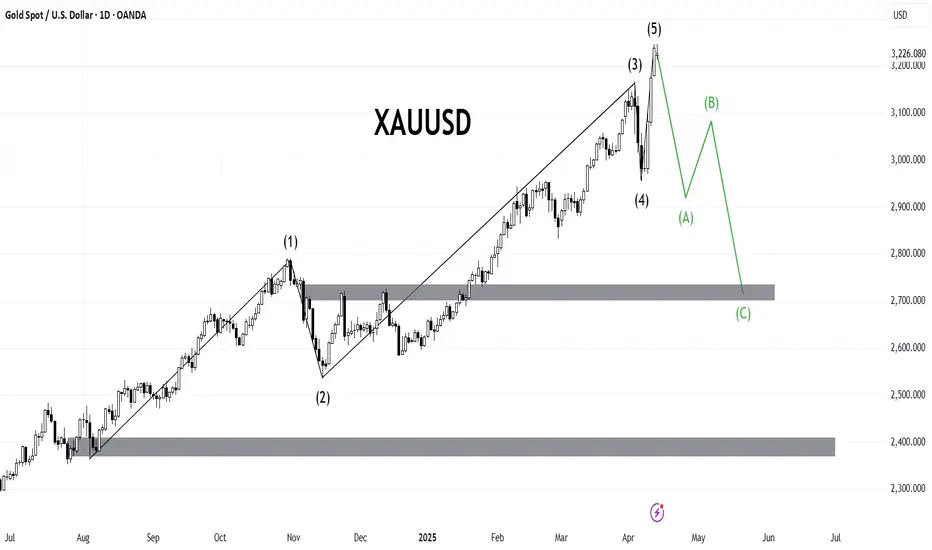
XAUUSDXAUUSD has completed 5 wave pattern and now is very due for deep correction before another investor cycle to start. if XAUUSD successfully go for deep correction then the target for ABC correction may extend to 2600 level.
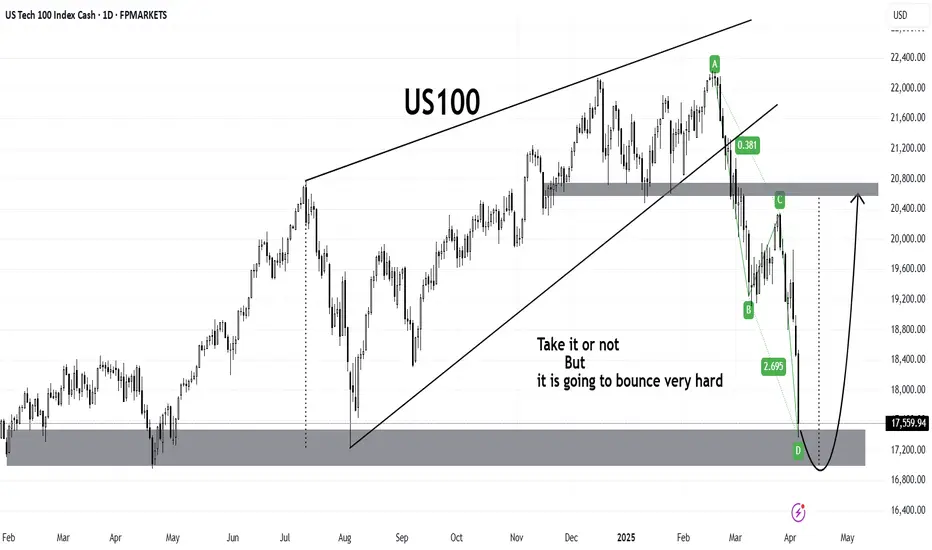
US100Rising wedge target to the downside complete.
ABCD pattern completed at very strong support level.
This thing is going to bounce very hard.
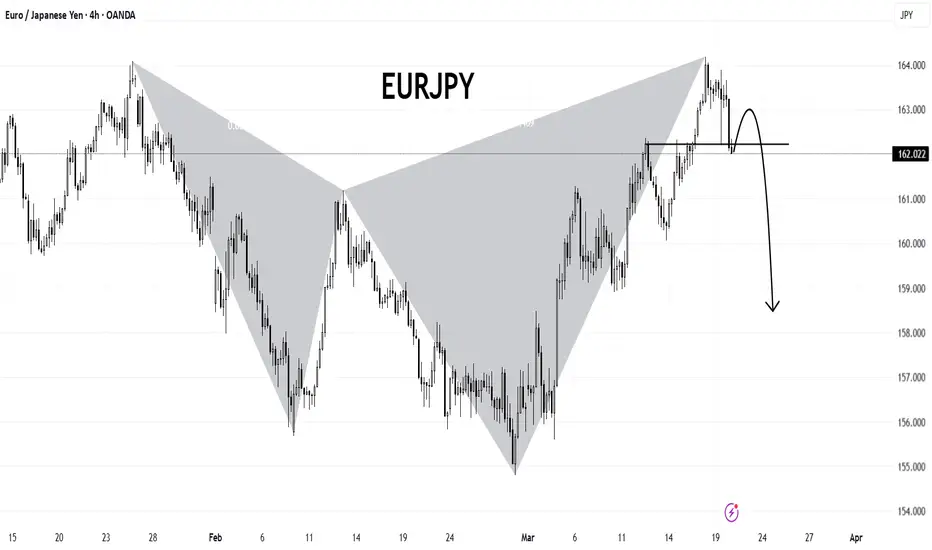
EURJPYEURJPY has completed the bearish harmonic pattern. And price has started showing weakness at daily resistance level as well.
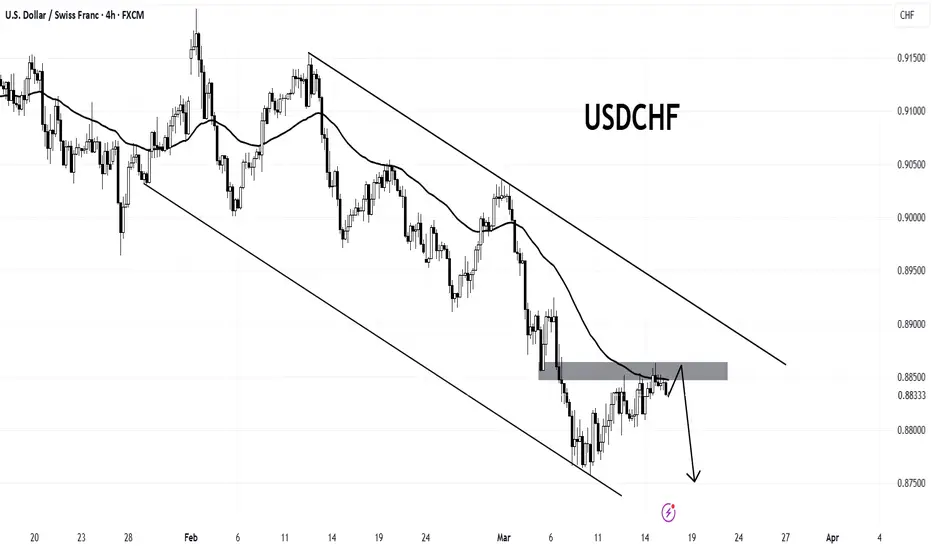
USDCHFUSDCHF is trading in bearish parallel channel. Recently price retested the broken level and now showing some bearish momentum.. If the sellers took charge then the 1st downside target will be 0.8760 region.
JP225JP225 is showing good bullish buildup. Price has submitted the breakout , if the price sustain this breakout then the bulls can target 38800 region

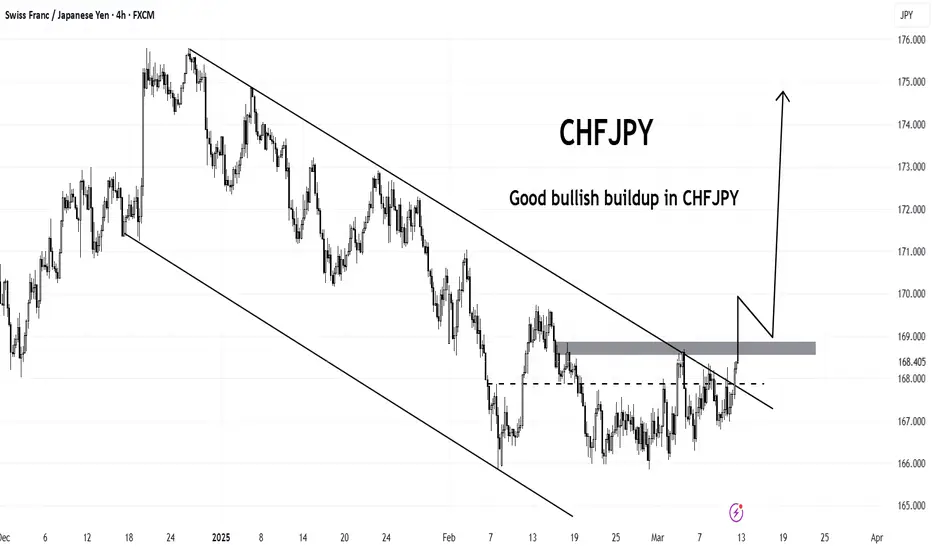
CHFJPYCHFJPY is building good bullish momentum. Currently the pair is facing a minor resistance at 168.80 region.
If the price successfully break this level, bulls can take charge and can push the price even higher.
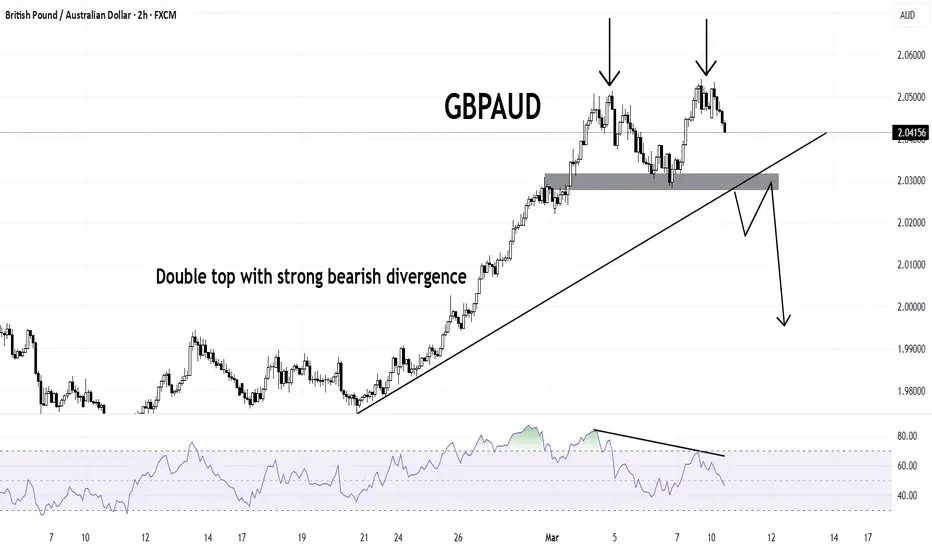
GBPAUDPrice has formed double top pattern with strong bearish divergence on momentum indicator.
If price breaks the static support level at 2.0300 level, then bear may take control and drag the price even lower.
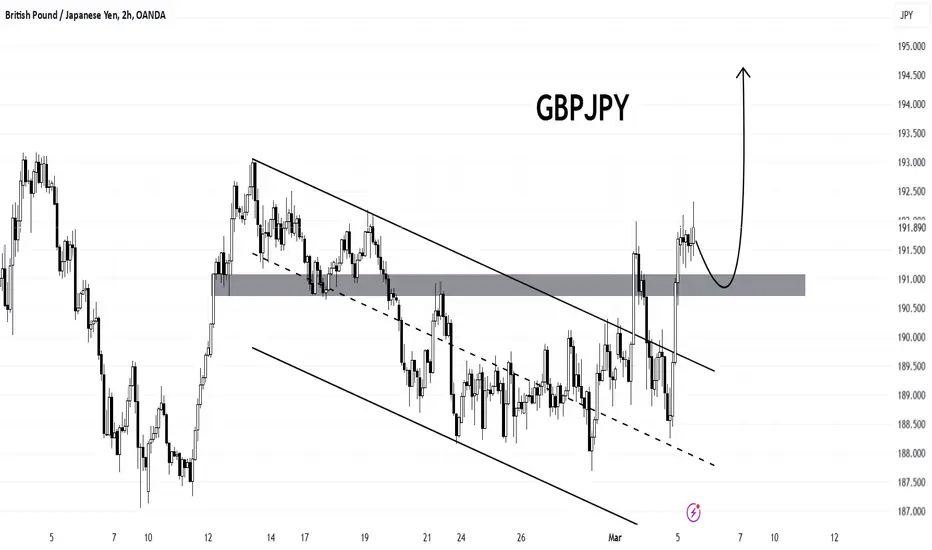
GBPJPYGBPJPY is looking very strong .As the pair break through the support come resistance level, currently the price is retesting the broken level and looking very bullish for another leg to the upside.
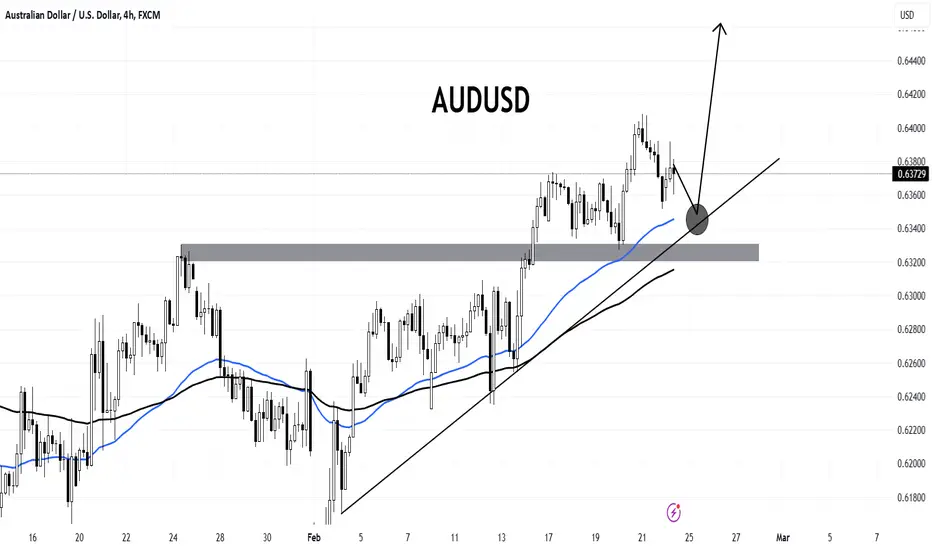
AUDUSDAUDUSD is looking very bullish and maintaining the structure very clean.
If the price retrace back to 0.6350 area, where is good support from EMA and inclining trendline, will be a good area to buy AUDUSD.
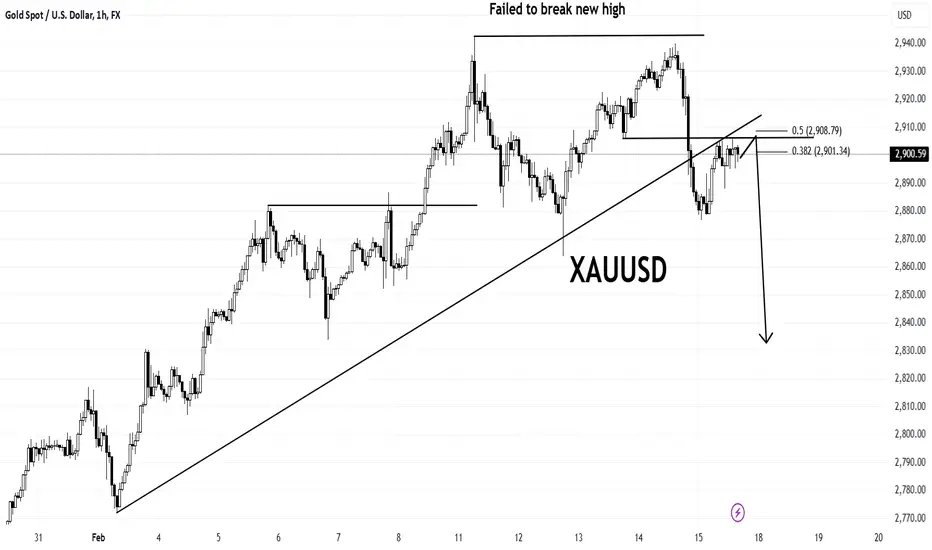
XAUUSDXAUUSD looking weak . As the market printing new highs, recently market failed to print new high at 2940 area and faced strong selloff. Currently the market is retracing the last move and it looks like market is ready for another selloff.