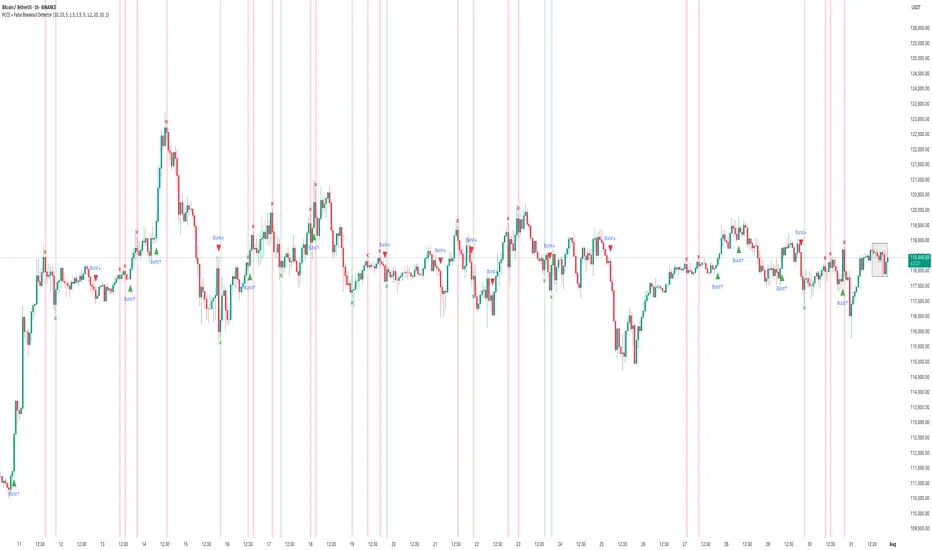
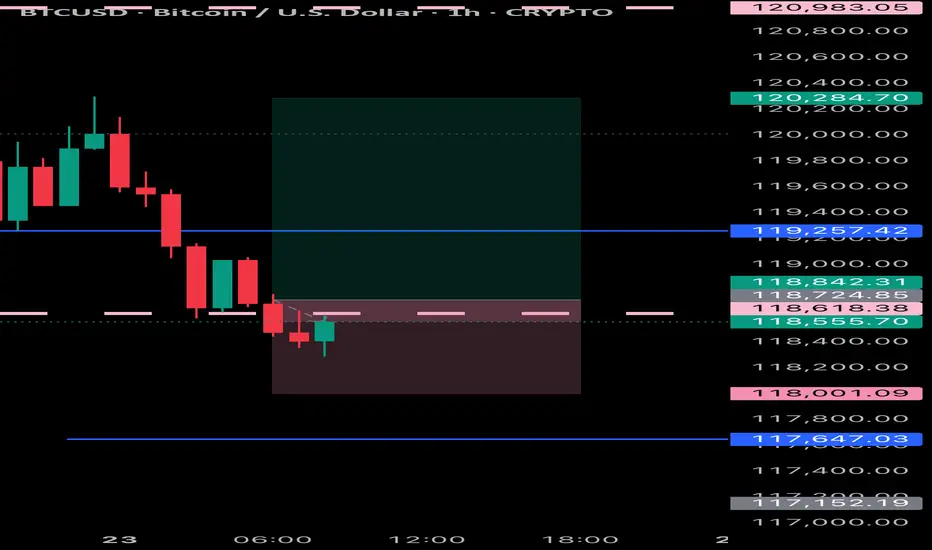
How to Use the PCCE + False Breakout DetectorHow to Use the PCCE + False Breakout Detector to Catch Trap Zones in BTC
Chart: BTC/USDT (1H)
Tool Used: PCCE + False Breakout Detector
Type: Educational – How to identify false breakouts and anticipate trend shifts.
⸻
🧠 What the Indicator Does:
The PCCE + False Breakout Detector is designed to identify breakouts from coiling ranges and filter out trap moves that often fool traders.
🔹 Burst↑ / Burst↓: Valid breakout from a price coil with volume and trend alignment
🔻 Red X: Marks a bull trap — breakout failed and price reversed lower
🟢 Green X: Marks a bear trap — breakdown failed and price reversed higher
By flagging where breakout structure fails, the indicator helps traders avoid false entries and position early for reversals.
⸻
✅ Recent Performance Highlights (BTCUSDT 1H):
📈 From July 13–31:
• Burst↑ on July 13 led to a clean uptrend (+$1,500 gain)
• Red X on July 16 called a failed breakout — price dropped hard
• Green X on July 16 caught the bear trap — price reversed immediately
• Burst↓ on July 21 triggered a sharp decline, validating breakdown
• Red X on July 30 spotted the bull trap just before price reversed down
📉 Even in sideways ranges, Red/Green Xs signaled when the move lacked conviction, allowing traders to wait instead of chasing noise.
⸻
🔍 Current Interpretation:
• BTC is trading inside a choppy structure after a recent Burst↑ and Red X combo.
• The X mark zone (gray box) warns of instability — bulls attempted a breakout but failed.
• If price continues to stay below the Red X high → likely retracement ahead.
• If we see a Green X + rally soon → potential reversal setup in progress.
⸻
📚 How-To Use the Indicator:
1. Burst Signals (Breakouts)
🔸 Use these to enter when coil compression breaks with volume
🔸 Works best when aligned with EMA trend and breakout body
2. Red / Green X (False Breakout Detector)
❌ Red X: Price spiked above resistance but lacked follow-through → trap
✅ Green X: Price dipped below support but got bought → trap
3. Confirm with Price Context
🔄 Look for reaction candles after X marks
📏 Set tighter stops — traps often reverse fast
🔔 Combine with your S/R zones or order block theory
⸻
🧠 Final Thoughts:
The PCCE + False Breakout Detector isn’t just about spotting momentum — it’s about reading intent vs. failure in price action.
BTC’s current structure shows signs of indecision. Trust the Xs to tell you whether the move has legs — or is just another trap.
🎯 Learn to trade the trap, not fall into it.
Traders

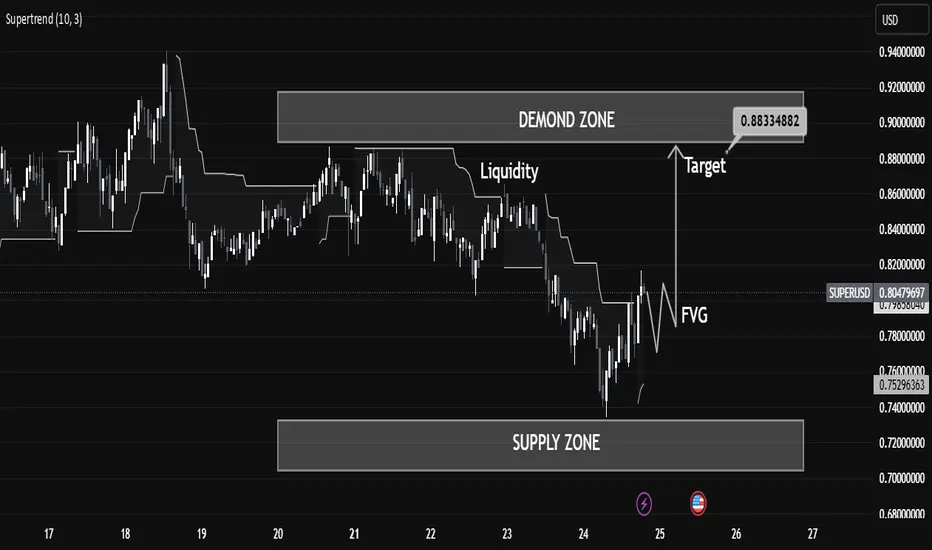
Smart Money Trap Identified! FVG + Liquidity Grab“Smart Money Trap Identified! FVG + Liquidity Grab Before Super USD Skyrockets to Target Zone ”
⸻
🧠 Technical Breakdown:
1. Liquidity Sweep (Manipulation Phase):
We see price aggressively sweep local liquidity around July 23, likely triggering stop-losses of early longs or breakout traders. This is a classic Smart Money trap, where big players induce volatility to grab liquidity before a move in the real direction.
2. Fair Value Gap (FVG):
A clear bullish FVG (imbalance) has formed post-liquidity grab, suggesting a potential institutional entry zone. This imbalance typically acts as a magnet for price and an entry point for Smart Money after manipulation.
3. Demand Zone & Target Projection:
• Price is now reacting from a well-defined Demand Zone, with clear rejection wicks indicating aggressive buying interest.
• The target zone (0.88334882) sits just below a previous supply zone, aligning with a potential distribution area where Smart Money may begin profit-taking.
4. Supertrend Indicator:
The supertrend has flipped bullish, confirming potential momentum shift, supporting the bullish bias as long as the FVG holds.
5. Confluence Factors:
✅ Liquidity Grab
✅ FVG Reaction
✅ Demand Zone Bounce
✅ Supertrend Confirmation
✅ High-Risk/High-Reward Entry Before Smart Money Run
⸻
🎯 Trade Idea (For Educational Purpose Only):
• Entry: On pullback into the FVG zone
• Stop Loss: Below the recent swing low or Demand Zone
• Target: 0.8833 (inside the upper supply/demand imbalance)
⸻
🧠 Educational Note:
This chart beautifully showcases how market makers operate — manipulate liquidity, fill imbalances, and target inefficiencies. Always think like Smart Money, not retail traders.
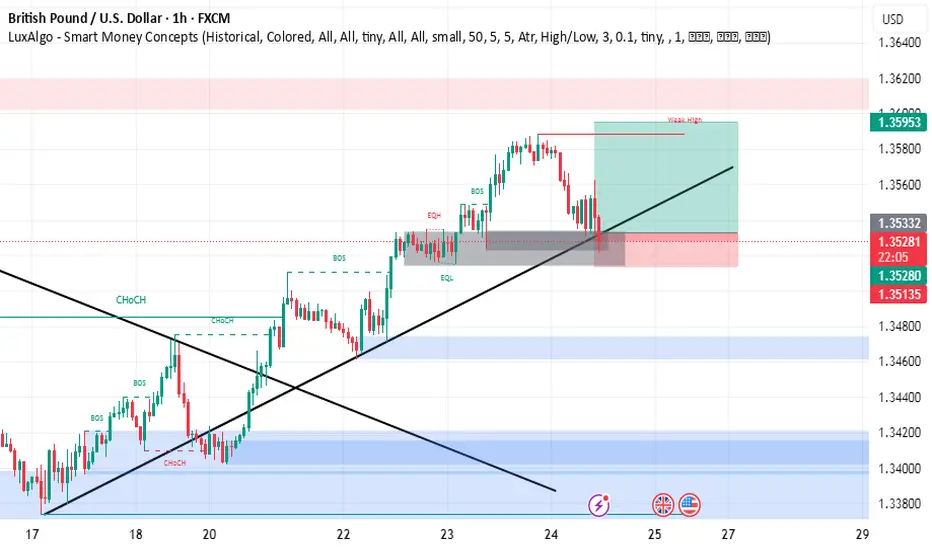
GBPUSD buy setupsimply
this is 6 deals after 5 CONSECUTIVE WINNING traders
we have demand
uptrend
the price can't make lower low
and make more candle in the area with more rejection
so the price will go up
be careful on your risk money management
BEST WISHES
SPY PRICE ACTION 16 JULY 2025This is the price action of spy at its very best as always. I have clearly discussed the important levels & have also discussed the momentum as well.
Feel free to leave your comment
NOTE:I AM NOT TRADING SPY

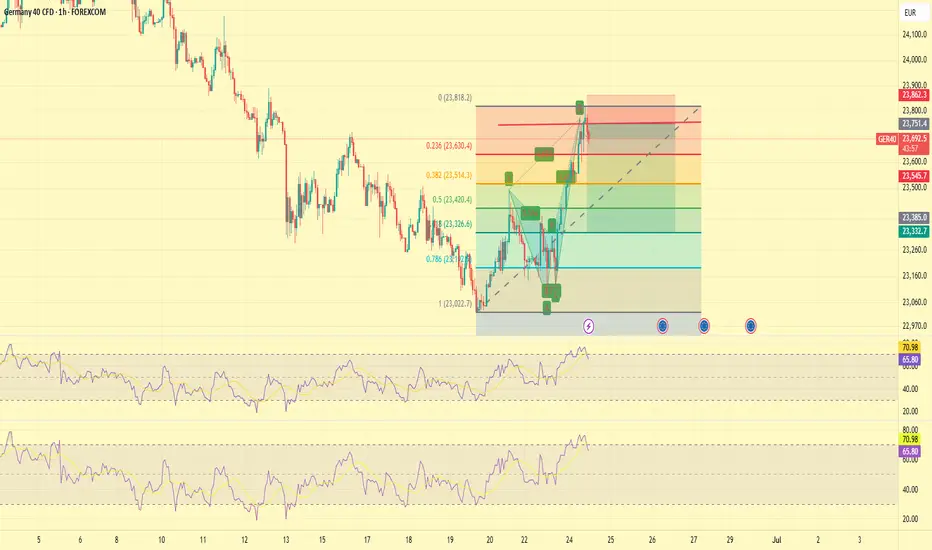
GER40 LongThere are multiple pattenrs on both H1 and M15
This is hitting target 2 of a short on H4
There is a lot of support at the level 24000
All timeframes are oversold with divergence
This is in a strong upward trend
Stop loss of 100 pips
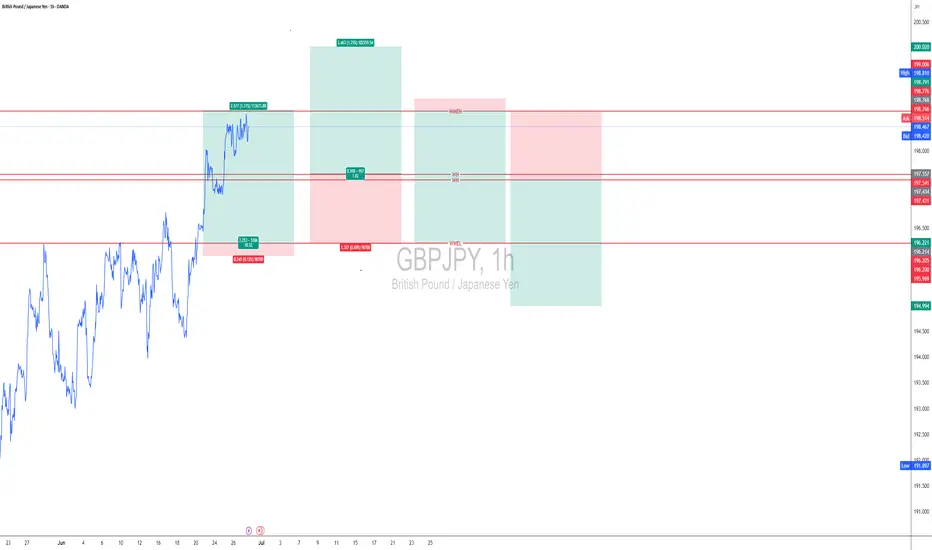
ANALYSIS FOR THE UP COMING DAYS AND WEEK FOR GBPJPY -GJ
Trading involves speculation and probabilities, making market direction predictions challenging. Mastering a strategy that works for you is crucial. Currently, I focus on my strategy to consistently profit.
Here's my analysis for the upcoming days: WH and WL levels indicate market direction. If the price closes above WH by Tuesday, expect an upward trend; if below WL, expect a downward trend.
For trading decisions, enter at WMEL or WMEH levels, or trade between them if you prefer and experienced. Always manage your risk carefully.
Don’t worry about the names, these are the names I have given my strategy:
Week High-WH
Week Low- WL
Week High Margin of Error High - WMEH
Week High Margin of Error Low – WMEl
197.5414432 WH
197.4305568 WL
196.2045568 WMEL
198.7674432 WMEH
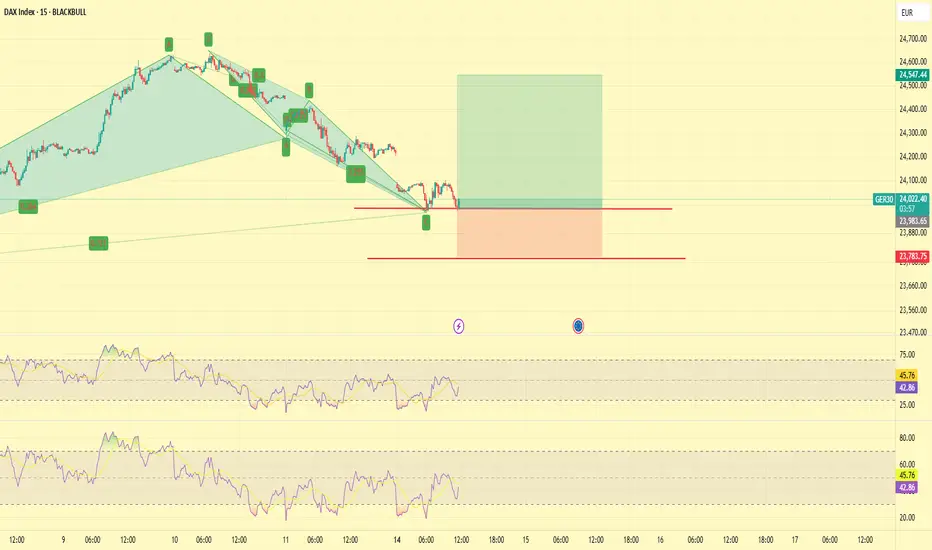
GER40 Short The trend on this trade has finally started to turn so we can expect the start of the short season
H4, H1, and M15 are overbought
There are 2 clear patterns on H1 and M30
There is a head and shoulders present in M15 with massive divergence
Stoploss above 150 pips
First target at 23300
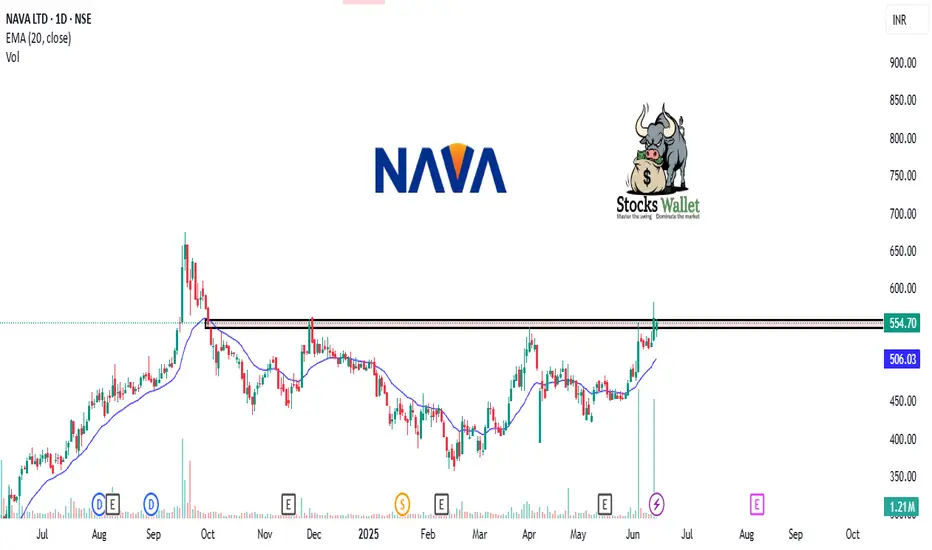
NAVA LIMITED – Bullish breakout in 1d soonNAVA Limited is currently exhibiting strong bullish momentum, supported by both technical indicators and improving fundamentals. The stock has shown a sustained uptrend with higher highs and strong volumes, indicating buyer dominance.
✅ Key Bullish Factors:
📊 Strong Fundamentals: Consistent profitability with solid EBITDA margins and minimal debt. Recent buyback reflects management's confidence in the company.
💡 Technicals in Favor: Price trading above key moving averages (20/50/100 EMA), showing strong trend continuation.
🔄 Breakout Confirmation: Stock recently broke past a key resistance zone and is now forming a new base, suggesting potential for the next leg up.
📈 Momentum Indicators: RSI above 60, MACD showing bullish crossover, and volume buildup on green candles.
🏭 Diversified Business: Exposure to energy, ferro alloys, and mining – adding stability and growth potential.
🎯 Potential Upside Levels:
Immediate Target: ₹658
🔒 Stop-Loss: ₹419 (Below key support or recent swing low)
📌 Strategy: Ideal for swing or positional traders looking for high-probability setups with risk-reward in favor.
🧠 Disclaimer: This is not investment advice. Please conduct your own analysis or consult a financial advisor before making any trading decisions.
NO TRADE? THAT IS THE TRADEToday, I took no trades and I’ll be honest, it was really tempting to break that discipline.
I stared at the chart longer than I needed to. My cursor hovered around the Buy and Sell buttons. My brain tried to convince me that “maybe” this candle meant something. Even though there was no valid sweep, no BOS, and no clean entry into an FVG , the desire to just “be in a trade” was strong.
But I reminded myself:
📌 No Setup = No Trade
📌 Your edge is your lifeline
📌 Discipline is what pays you, not activity
What I felt today is something every trader battles, setup hoping . It’s that mental trap where silence feels wrong, and boredom feels dangerous. But the truth is, boredom is part of being a consistently profitable trader. There are days where your best trade is the one you don’t take.
And I’m proud to say I did nothing.
No revenge trade.
No gambling.
No deviation from plan.
Instead, I observed. I journaled my emotions. I stayed in control. That’s the work behind the scenes: the mental reps that build longevity in this business .
So if you had a quiet session today too, and you resisted the urge to jump in without reason, celebrate that. You're training your mind to trust your system, not your feelings.
Sometimes, the most powerful trade you’ll ever take… is the one you never place.
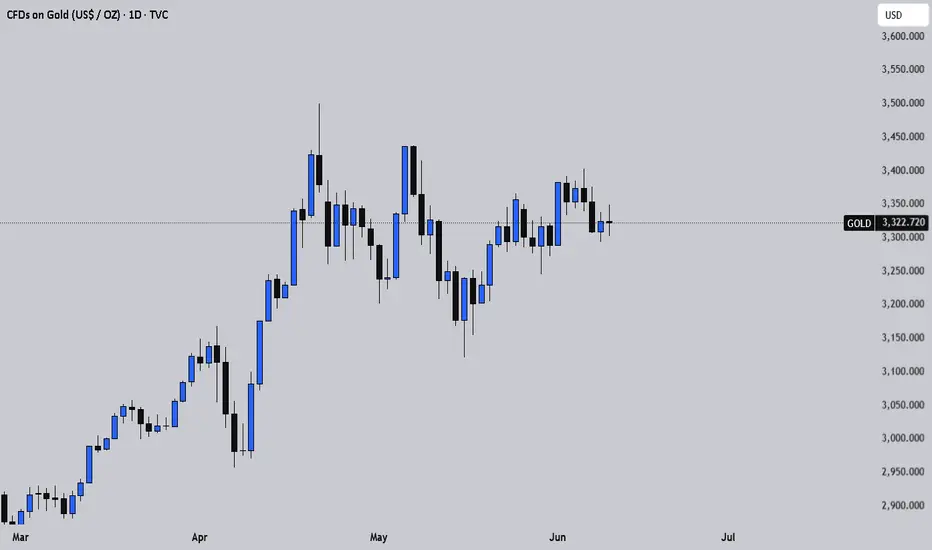
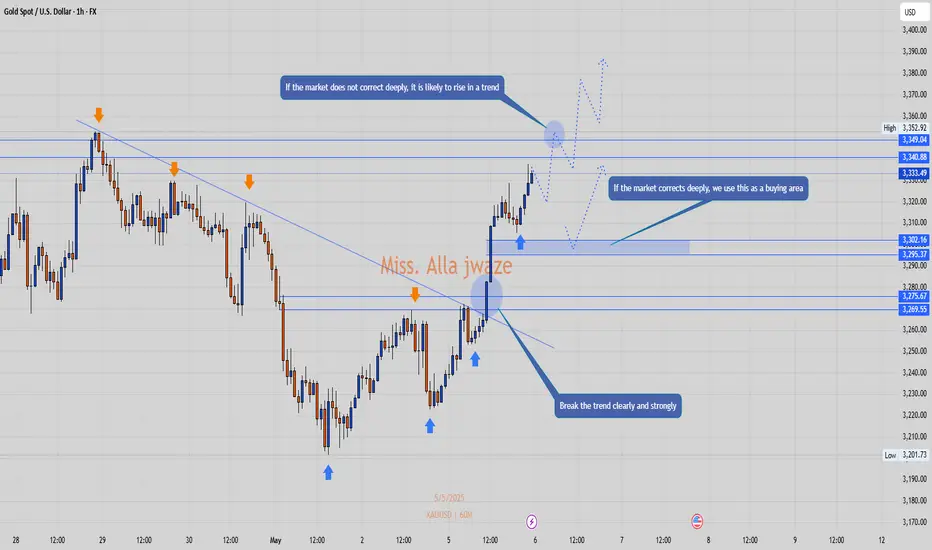
I am waiting for SELL here with wave 5 catching strategy In the Kitco survey, Wall Street analysts were divided on the direction of gold prices this week. Fifty percent of experts expect prices to rise, 43 percent expect prices to fall, and 7 percent believe gold will move sideways. This reflects a generally cautious sentiment as there is no clear factor to promote a new trend.
Some experts still lean towards the uptrend as gold holds important support levels and remains a safe haven amid geopolitical uncertainty. Others predict a correction in gold prices due to positive signals from the White House about the possibility of reaching trade agreements and the recovery of US stocks.
In addition, there are also neutral opinions that gold is unlikely to continue to rise sharply without further momentum, especially when stock indexes are more attractive to investors.
James Stanley, senior strategist at Forex.com, remains optimistic, saying that gold is making a technical correction to continue the larger trend. He believes that the $3,300 and $3,280 zones will be important boundaries to watch.
What do you think about this strategy?
Best regards, StarrOne !!!

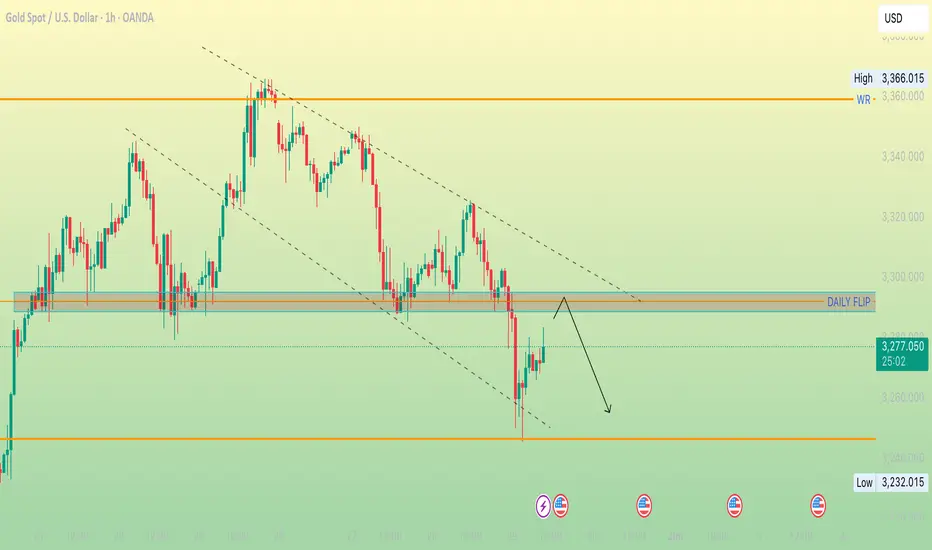
GOLD - SELLING FROM PULLBACKPrice has shown a reaction from the low around 3,245 and is now approaching a strong confluence zone around the DAILY FLIP, which acted as prior support AND now resistance. This zone coincides with the upper boundary of the descending channel.
Bias: Bearish, unless price breaks above 3,305 with strong momentum and closes outside the descending channel.
TRADE IDEA:
SELL from 3,295–3,300 (wait for bearish confirmation)
once activated, I will update SL and TP
Let me know what your opinion.
Gold : Sell or Wait for Pullback to buy?Price is approaching a strong Sell Zone (3320–3345), which aligns with Daily & Weekly Resistance.
🔻 Sell Idea:
Entry: 3325–3330
🟢 Buy Idea (if pullback):
Entry: 3245–3255
I will update SL and TP once trade is activated.
Watching for rejection in the Sell Zone or a retest of the Buy Zone before entering.
Share your opinion below. Trade safe! 💥

SPY WEEKLY 19TH-23RD MAY 2025Welcome to Spy weekly. I have tried to explain the price action & all-important levels in the best possible way but still if you have doubts then feel free to leave a comment below.
NOTE: WE ARE IN BULL RUN

April 2025 Market Crash: Causes, Impact, and Strategic ResponseApril 2025 will go down in financial history as one of the most turbulent months of the past decade. A large-scale market crash, triggered by geopolitical escalation and intensified trade tensions, revealed just how fragile the global investment landscape remains—even after a relatively stable start to the year.
What Happened?
On April 6, 2025, the U.S. administration announced sweeping tariffs of up to 145% on all Chinese imports. This decision, though preceded by months of political strain, took the markets by surprise. Panic-selling ensued almost immediately. The Dow Jones plummeted over 4,000 points within two days—the steepest decline since the COVID-era crash of 2020. The S&P 500 and Nasdaq followed suit, dropping 6–9% in a matter of hours.
Asian and European indices mirrored the collapse: Japan’s Nikkei 225 fell by 7.8%, and Germany’s DAX dropped by 5.4%. The synchronized reaction emphasized the ongoing interdependence of global markets, even in an era of growing protectionism.
Why It Matters
For GeldVision clients and institutional investors worldwide, such events highlight the importance of risk-managed portfolio strategies. The April crash wasn’t solely a reaction to tariffs—it was also driven by fears of a potential recession and uncertainty surrounding central bank policies.
Another destabilizing factor was the automatic response of algorithmic trading systems, which exited positions en masse as technical indicators were breached—amplifying volatility and accelerating the selloff.
How GeldVision Responded
Since early 2025, we at GeldVision have implemented a strategy of “adaptive conservatism,” gradually reducing equity exposure in client portfolios and reinforcing positions in defensive assets such as gold, investment-grade bonds, and liquid currency instruments.
During the height of the market turmoil, our team activated internal stress protocols, including temporary order freezes on automated buy-ins and direct client communications for real-time portfolio reviews. This proactive approach allowed us to minimize losses and maintain client confidence.
What’s Next?
We expect volatility to persist at least through Q3. For investors, the key is to avoid reactive decisions and maintain a long-term perspective. GeldVision will continue to expand its macroeconomic monitoring, enhance risk models, and provide clients with the tools needed to navigate uncertain markets safely.
European Stocks Rise Amid Positive NewsEuropean stock markets are experiencing a steady rise, buoyed by a series of encouraging developments that have boosted investor confidence and driven share prices higher. This wave of optimism is being fueled by both internal economic signals and an improving global environment, including stabilized interest rates and signs of a business rebound.
What's Driving the Growth?
One of the primary catalysts behind the rally is recent economic data showing a slowdown in inflation across the eurozone, alongside a revival in consumer demand. These indicators have strengthened expectations that the European Central Bank may soon pivot from a tight monetary stance to a more accommodative approach. Investors have welcomed these signals as evidence that the regional economy is adjusting well to challenging conditions and avoiding a deeper downturn.
Additionally, stronger-than-expected quarterly earnings reports have played a key role in lifting stock prices, particularly in the banking, technology, and industrial sectors. Major players such as Siemens, BNP Paribas, and SAP have posted solid gains, reflecting broader confidence in corporate resilience.
Renewed Investor Interest in Europe
Improving macroeconomic indicators are drawing renewed attention to European assets. With risks appearing more contained and equity yields remaining attractive, many investors are beginning to view the region as a compelling opportunity. Stock exchanges in Germany, France, and the Netherlands have stood out, showing consistent growth and high trading volumes.
Geopolitical factors are also contributing to the market’s upbeat tone. Gradual normalization of trade relations with key partners and the strengthening of the euro on foreign exchange markets are adding to investor enthusiasm.
What’s Next?
Analysts suggest that if current trends continue, European indices could reach new yearly highs. Key factors to watch in the near term include upcoming central bank decisions and fresh data on GDP growth and employment. Nevertheless, the present sentiment points toward confidence in the ongoing recovery.
Conclusion
The European stock market is entering a phase of stable growth, driven by favorable economic indicators, manageable inflation, and an improving business climate. Positive news continues to give investors reasons for optimism, and if momentum holds, Europe could emerge as one of the top-performing investment regions in the coming months.

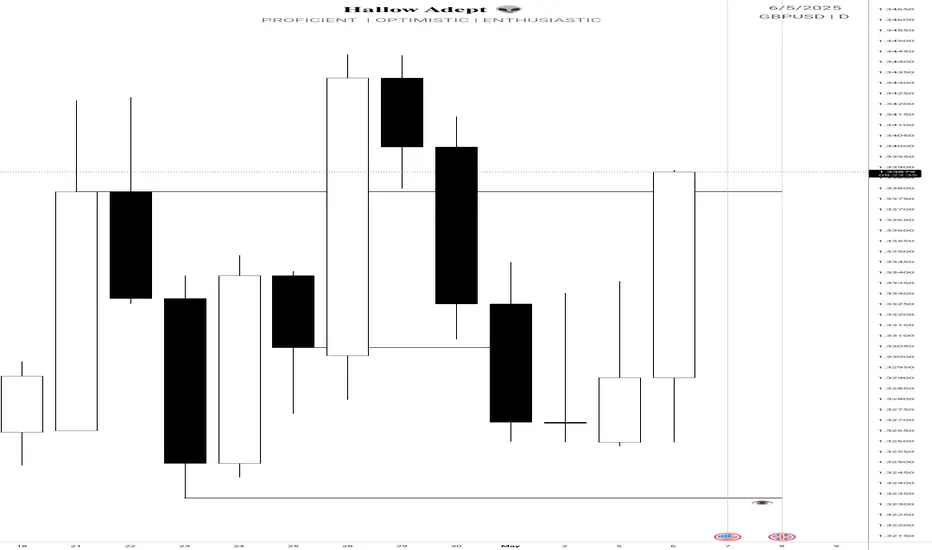
GBPUSD Sell Insight Last week cleared the previous week's high 1.34232 and closed below it.
This signifies more push to the downside from the weekly perspectives
I'm anticipating the previous weekly low to be the first draw on Liquidity 🧲
On the daily timeframe we have a break of structure from 1.33044 to the downside and the QML level 1.33784 whic6also aligns within an imbalance on the H4 would be used for sell continuation after the short reversal that happens.
Look for entry on the H4 and sell to the draw on Liquidity zone
Kindly share if you find this insightful.
It's been a while here. I'm more active on X (Twitter) now
XAUUSDWe have two scenarios in the analysis: either a rise in the form of a trend, a staircase, or a deep correction and taking the buy zone. We wait for the deep correction of the market and taking the buy zone. However, if it rises in the form of a staircase, we will renew the entry, but in the event of any entry, geopolitical situations end the analysis and we analyze another analysis or another renewal.
GOLD SWING XAUUSD took support form bottom - up Line.
All long targets are achieved
This month taking rejection from major resistence,
Let's track the moves from Top down line.
Follow for more swing analysis for INDICES - CURRENCY - COMMODITIES

Sperax - Undervalued AF.Despite market chop, SPA is holding strong within a clean falling wedge formation. Im following on from my previous post after a bullish breakout. This move looks far from over. The price action is compressing, volume is thinning, and all signs point to a continuation move on the horizon.
SUPPORT @ 0.01067

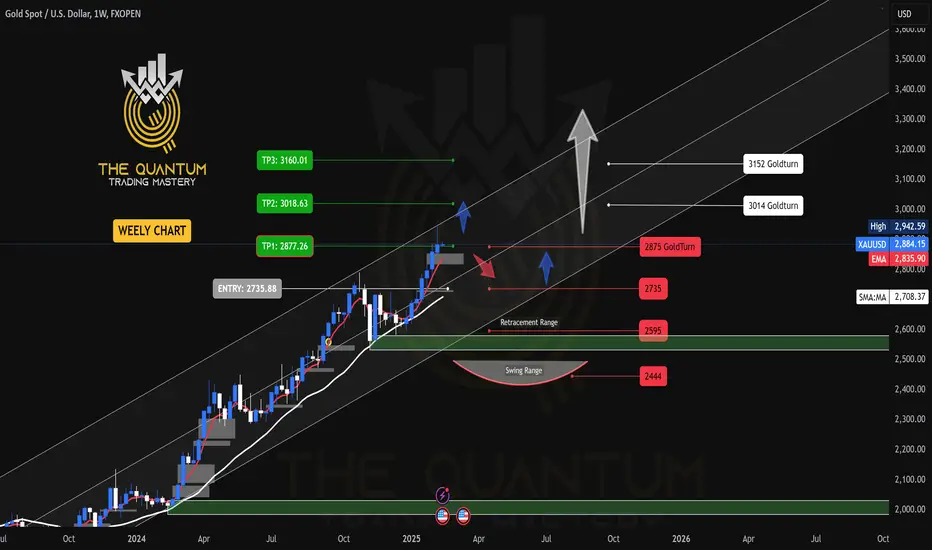
GOLD WEEKLY CHART MID/LONG TERM ROUTE MAP UDPATEDWeekly GOLD Analysis – Quantum Trading Mastery
Hello Everyone,
Here’s the latest update on the GOLD weekly chart we’ve been diligently tracking and trading. Below is a comprehensive breakdown of the current range and key levels we’ve identified.
Recap of Last Week’s Analysis:
Last week, our predictions aligned perfectly with market movements:
* A strong resistance level at 2790 caused a short-term reversal near 2735.
* The FVG acted as dynamic support at 2735, sustaining the bullish momentum.
* The EMA5 crossed and locked above the key level at 2735, solidifying upward movement.
* As predicted, the resistance was broken, leading to a new all-time high of 2817.
Our analysis delivered precise predictions, allowing you to trade confidently and minimize risks.
What’s Next for GOLD This Week?
Key Level: 2735
Bullish Targets:
* TP1: 2877
* TP2: 3018
* TP3: 3160
Bearish Targets:
* 2735
* 2680
* 2595
This week, we have identified two critical GOLDTURN levels at 2735 and 2595. While we anticipate GOLD reaching TP1 at 2877, there may be short-term reversals around these key levels and GOLDTURN zones.
Recommendations:
To better understand the support structure and identify optimal dip-buying opportunities, review our smaller time-frame analyses (daily, 12H, 4H, and 1H). These insights will help you navigate the market with precision, keeping long-term gaps in perspective.
We’ll continue to provide daily updates and insights to keep you informed.
Thank you for your continued support! Don’t forget to like, comment, and share this post to help others benefit as well.
The Quantum Trading Mastery

GOLD WEEKLY CHART MID/LONG RANGE ROUTE MAP UPDATEDWeekly GOLD Analysis: 17th February 2025
Hello Traders,
Here’s a weekly chart analysis of GOLD, offering an in-depth look at recent market trends and future outlook. Since October 2023, our consistent tracking has achieved 100% target accuracy, as shown by the Golden Circle markers on the charts. Let’s break down the highlights and what’s next.
Recap of Last Week’s Successes
Weekly Chart Highlights:
* EMA5 crossed and settled above Entry ✅ 2735 reached
* Bullish Target TP1: 2877 ✅ Achieved
* GoldTurn Levels at 2875 activated twice ✅ Reached
What’s Next for GOLD? Bullish or Bearish?
After hitting ENTRY LEVELS at 2735 and TP1 2877, we saw a small close above 2877 last week, leaving 3018 open as a potential target. We mentioned that an EMA5 lock would confirm this movement.
While EMA5 hasn’t locked yet, the close from last week provided a solid push upward, gaining over 500 pips. The long-term gap remains open, with more movement likely after last week’s candle body close.
Key Level: 2735 remains a critical zone.
GoldTurn Levels at 2875 and 2735 are active, and the price may revisit these levels before bouncing back to reach TP1 and beyond.
Recommendations & Strategy:
* Focus on EMA5: Watch its behavior around 2877 for key signals on short- and long-term trades.
* Support Levels: GoldTurn levels at 2875 and 2735 are vital for identifying reversal points and prime dip-buying opportunities.
* FVG Support: A range between 2835 and 2850 is also supportive.
For precise entry and exit points, check our daily, 12H, 4H, and 1H analyses for clearer market guidance.
We’ll continue to provide daily updates, insights, and strategies on our TradingView and YouTube channels every Sunday. Don’t forget to like, comment, and share to support our work and help others benefit!
The Quantum Trading Mastery