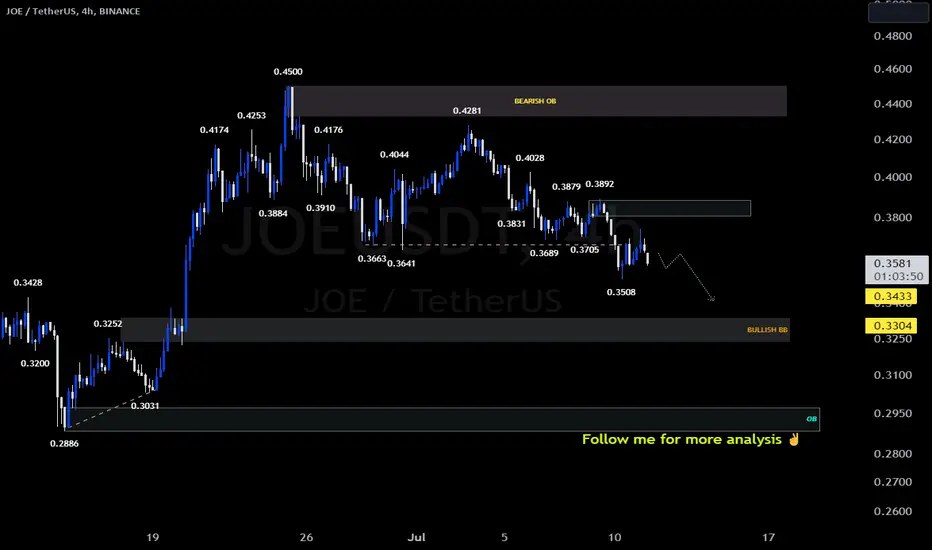
SasanSeifi 💁♂️JOE/USDT👉4H🔻Hey there,
◼As you can see in the 4-hour time frame, the price has been accompanied by a corrective trend within the range of 0.45. Considering the breakthrough of the low support level at 0.3640, we can expect the price to range towards the support level at 0.34 and the bullish breaker block range, followed by a correction.
◼ To better understand the continuation of the price trend, we need to observe how the price reacts to the support levels . It's possible to witness a positive price reaction around the support level
Important resistance levels to watch out for are 0.38 and 0.39.‼❗
❎ (DYOR)...⚠️⚜️
🔹Just keep these scenarios in mind as you analyze the market. Remember, things can always change unexpectedly, so stay flexible in your trading approach.
🔶Wishing you successful trading and profitable opportunities! If you have any further questions or require additional assistance, feel free to ask.✌
🔹And if you found my analysis helpful, I would appreciate it if you could show your support by liking and commenting. Thank you! 🙌
Traders
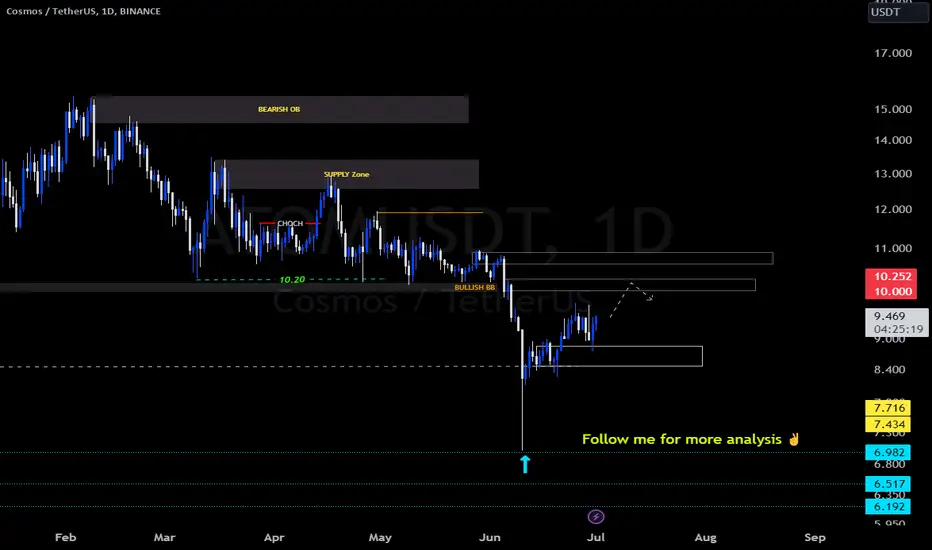
SasanSeifi 💁♂️ATOM👉1D ⏩ 10.20$❗Hey there,
🔱In the daily timeframe chart, You can see that after a drop, the price has been bouncing back with some positive movement from the $8.50 range. And then, it found support again at around $8.50 after a small correction. Right now, it's trading around $9.40. Here's a scenario to consider: if the $8.50 support level holds, we might see the price grow towards the important resistance level at $10 / $10.20 and create a new high. To understand the next move better, let's see how the price reacts to those resistance levels!
🔹Just keep these scenarios in mind as you analyze the market. Remember, things can always change unexpectedly, so stay flexible in your trading approach.
Wishing you loads of success in your trading adventures, my friend!✌️
❎ (DYOR)...⚠️⚜️
🔹Sure, if you have any more questions or need further clarification, feel free to ask. I'm here to help!
🔹And if you found my analysis helpful, I would appreciate it if you could show your support by liking and commenting. Thank you! 🙌
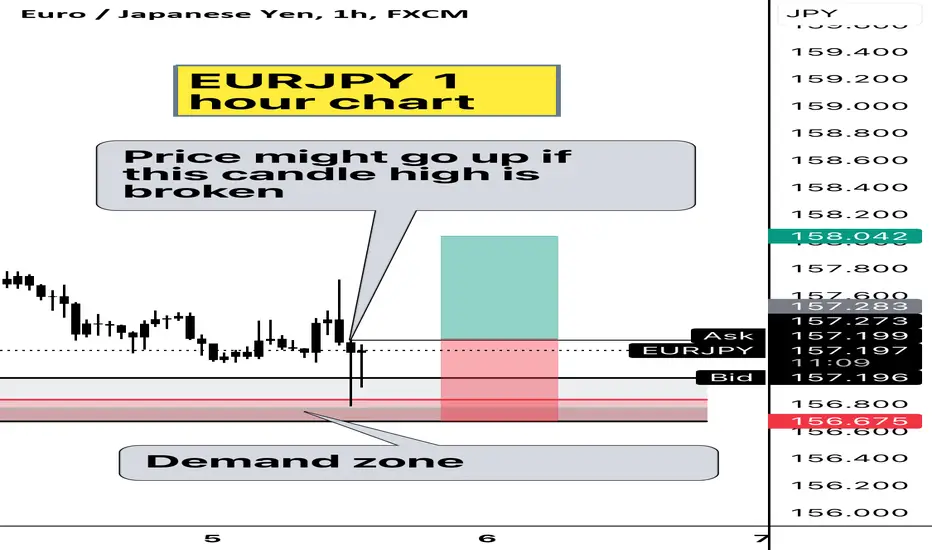
Eurjpy 1 hour chart buy possibilities Eurjpy 1 hour chart buy possibilities
1-1rr
Practice good risk management
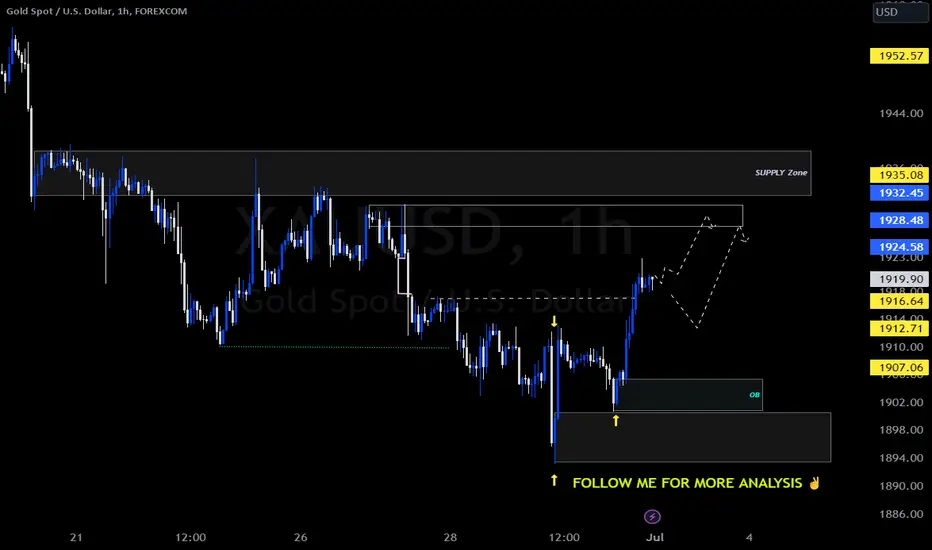
XAUUSD: CUP and HandleThe price of gold (XAU/USD) continues to rise for the fourth day in a row, although it lacks strong upward momentum around 1,923 as we enter Tuesday's European session. This lack of momentum can be attributed to the US holidays and a light calendar elsewhere, which has resulted in a sluggish market.
However, traders remain active due to concerns about the global economic slowdown and the state of US-China relations. The recent decision by the Reserve Bank of Australia (RBA) to not raise interest rates for the third time in a row also contributes to the overall market momentum, as it goes against the general consensus.

SasanSeifi 💁♂️XAUUSD👉1H 1924 / 1928 / 1932❗🟡Hey there, buddy!✌
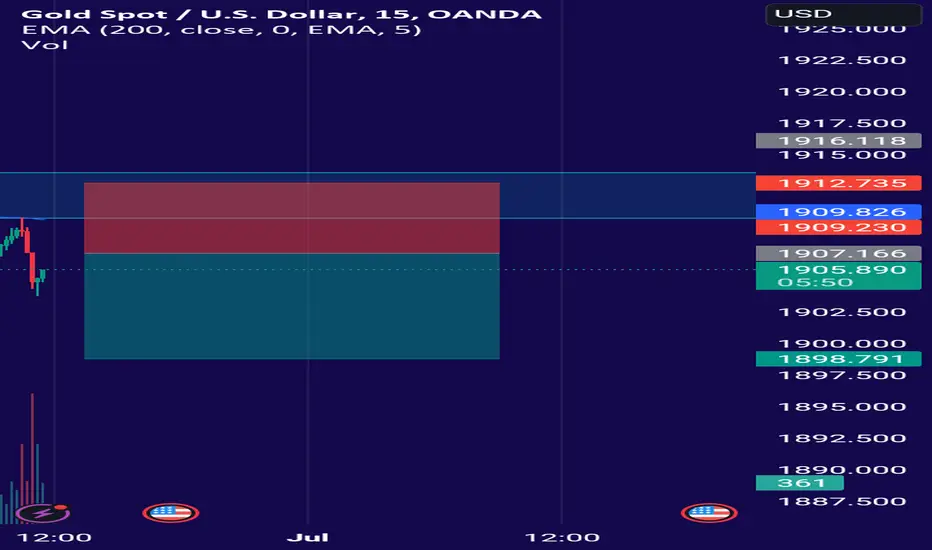
🔱In the one-hour timeframe, as you can see, after the drop, the price bounced back from around $1893/ $1900 with some buying pressure. And now, it's in a range after breaking above the $1917 level.
💹 Here's what we can expect in the one-hour timeframe: after some consolidation and a small correction, the price might move up towards the resistance levels at $1924, $1928, and $1932 with some positive fluctuations. Then, we could see the price getting rejected from those resistance levels. To understand the next move better, let's see how the price reacts to those resistance levels. But if the price breaks above the important $1935 resistance level and holds steady, there's a good chance of further growth. This scenario will be filled out. The possible trends have also been identified.
🔱Just keep these scenarios in mind as you analyze the market. Remember, things can always change unexpectedly, so stay flexible in your trading approach.
❎ (DYOR)...⚠️⚜️
🔹Wishing you loads of success in your trading adventures, my friend!✌️
🔹And if you found my analysis helpful, I would appreciate it if you could show your support by liking and commenting. Thank you! 🙌
daily timeframe analysis 👇
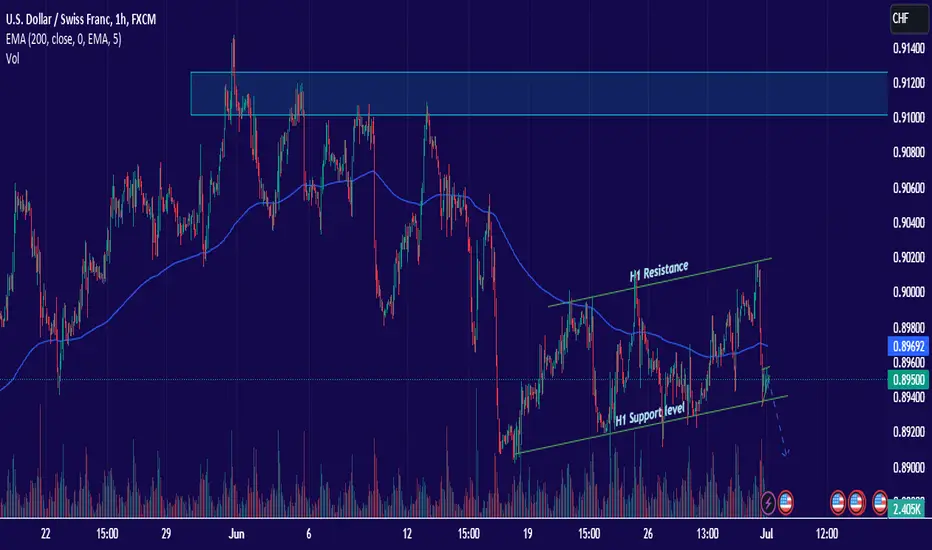
USDCHF Sellwe have a sell setup on usdchf as we can see on this chart H1 trendlines of Support and Resistance as we had drop base and now all set for drop the confluance for this sell setup is 200 EMA which tells us about a sell setup
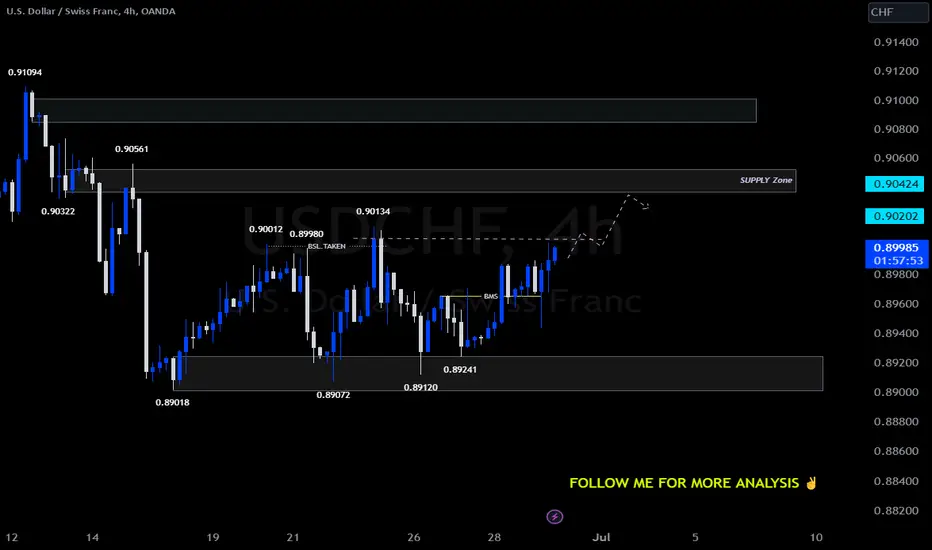
SasanSeifi 💁♂️USDCHF👉4H ⏭ 0.90200 / 0.90400 Hey there, buddy!✌
◼In the 4-hour chart, as you can see, the price is just bouncing around between 0.89 and 0.90. Right now, the situation looks like this: the price might have a little dip after hitting the resistance at 0.90, but then it could bounce back up towards the targets around 0.90200 and the selling zone at 0.90400. 💹
◼ We gotta keep an eye on how it reacts to the resistance levels to get a better idea of where it's heading. It might face some correction if it gets confirmed and hits the selling zone. But, we already have a probable trend identified, and the support at 0.89600 is quite important.❗
🔹Just keep these scenarios in mind as you analyze the market. Remember, things can always change unexpectedly, so stay flexible in your trading approach.
Wishing you loads of success in your trading adventures, my friend!✌
❎ (DYOR)...⚠️⚜️
🔹Sure, if you have any more questions or need further clarification, feel free to ask. I'm here to help!
🔹And if you found my analysis helpful, I would appreciate it if you could show your support by liking and commenting. Thank you! ✌
SasanSeifi 💁♂️🔵AMZN 👉12H 118 / 121 / 123▪️ Hello everyone ✌ By examining the chart in the time frame of 12 hours, as you can see, the price has grown by about 12% after breaking the dynamic resistance and due to the completion of pullback from the range of 101, and after a slight fluctuation, it again faced a positive fluctuation. Currently, it is trading in the range of 114 midline of the ascending channel.📊
📈The scenario we can consider is that if the support range of $110 and $108 is maintained, the price will continue to grow up to the range of $118 and the gap area of 121/123.
❗️
🔸We have to see how the price will react to the resistance ranges. If it stabilizes above the range of 123, the possibility of more growth can be considered.‼️⚠️
⚠️Keep in mind that it is important to maintain the 110/108 support range for the continuation of the positive trend.
▫️The current price : 114.07💲
▫️TF : 12-H
❎ (DYOR)...⚠⚜
What do you think about this analysis? I will be glad to know your idea 🙂✌
IF you like my analysis please LIKE and comment 🙏✌

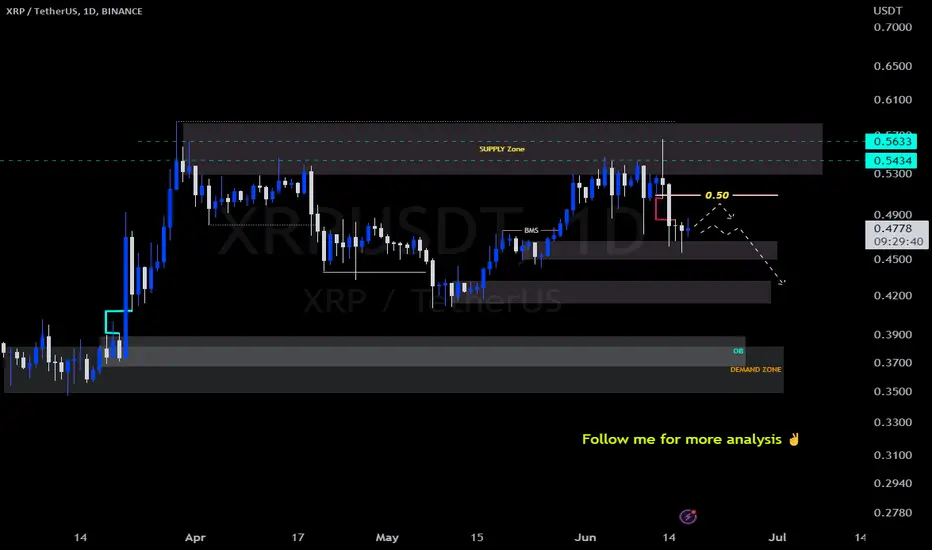
SasanSeifi 💁♂️XRP👉1D 🔻 0.42 / 0.38 The price faced selling pressure and is currently fluctuating in the price range of 0.48. I expect the price after a slight fluctuation and an upward movement after collecting liquidity again from the FVG price range of 0.50 in case of SELL confirmation, we will see further correction of the price to the support range of 0.42/0.38.
Possible trends are also identified.
The important resistance range in daily time is 0.50
❎ (DYOR)...⚠️⚜️
What do you think about this analysis? I will be glad to know your idea 🙂✌️
IF you like my analysis please LIKE and comment 🙏✌️
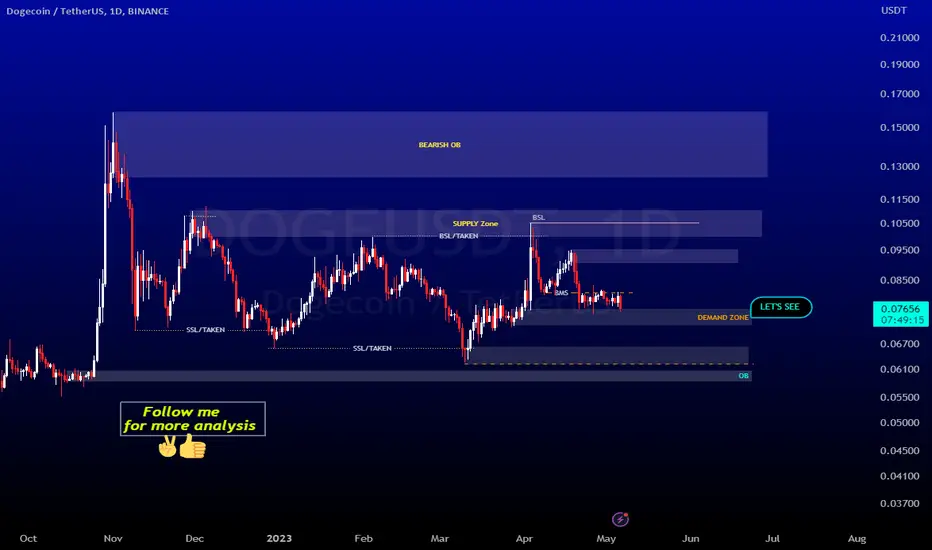
SasanSeifi 💁♂️DOGEUSDT👉1D 0.064/ 0.060 ?🤔 let's see 🔻HI TRADERS ✌
As you can see, after the price drop from the supply area, it is currently fluctuating slightly in the range of 0.076. The scenario that we can consider is if the price penetrates below the 0.071 range and stabilizes in the daily time frame. The possibility of further correction up to 0.064 and the OB range of 0.060 can be considered and then grow from the specified ranges.
We have to see how the price will react to the important range of 0.081 / 0.082, otherwise, if the range of 0.071 is maintained and the price penetrates above the range of 0.082, we may see a positive fluctuation and The desired correction scenario will be fielded.
In my opinion, the best entry point for buying could be the ranges of 0.067 / 0.064 / 0.060 in case of confirmation for buying.
❎ (DYOR)...⚠⚜
What do you think about this analysis? I will be glad to know your idea 🙂✌
IF you like my analysis please LIKE and comment 🙏✌
SasanSeifi 💁♂️EUR /USD 👉1H🔻 1.084 / 1.080 Hey there, buddy!✌
◼In the 1-hour timeframe, we can see that the price has dropped from the significant resistance level at 1.10 and is currently fluctuating positively, trading around the price range of 1.084. It is currently being traded at 1.094.💹
◼Here's a possible scenario to consider: If the price manages to stay below the resistance levels of 1.095 / 1.098, we may see a more significant correction toward the support range of 1.084 / 1.080 / 1.078. To gain a better understanding of the price's future movement, it's important to observe how it reacts to these resistance levels.💹
On the other hand, if the price consolidates above the resistance levels, there is a higher chance of further growth.❗
⭕Just keep these scenarios in mind as you analyze the market. Remember, things can always change unexpectedly, so stay flexible in your trading approach.
🔹Wishing you loads of success in your trading adventures, my friend❗
❎ (DYOR)...⚠️⚜️
Sure, if you have any more questions or need further clarification, feel free to ask. I'm here to help!✌
And if you found my analysis helpful, I would appreciate it if you could show your support by liking and commenting. Thank you! 🙌

Gold sellGold had broke its Support level on 1912-1910 level and is now the restest of that level is also completed it will also retest its short term resistance or consolidation level on M15 time frame the confluance on selling the resistance on 200EMA and Bearish candels also a evening start before Bearish momentum candles now it will move downwards 👇 with 1:1.5 R:R
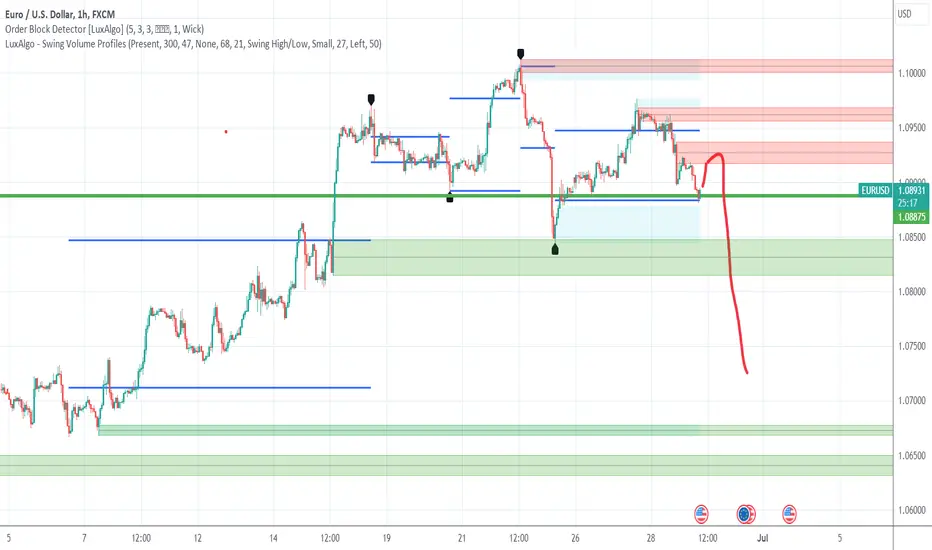
a clear structure mapping of eurusdas it seems market completly changed its way now we are in a bearish side

EUR/USD Prediction on 29.06.2023In the recent months, economic headlines around the globe have been dominated by a singular narrative - the depreciation of the Euro. This piece seeks to shed light on this financial trend, its potential causes, and what it could mean for global economic dynamics.
Over the past few months, the Euro has seen a significant decrease in value when compared to other major currencies. The most prominent among these comparisons is against the US dollar. These changes in the currency market have sparked concern and interest from investors, economists, and policymakers alike.
Several factors can be attributed to the downward trajectory of the Euro. Key among them is the economic disparity within the Eurozone. Countries like Germany have robust economies, while others such as Italy and Greece still grapple with high levels of debt. These economic disparities cause strain and instability within the Eurozone, which can undermine the value of the Euro.
Another contributing factor is the sluggish economic recovery in the Eurozone following the COVID-19 pandemic. While countries like the US and China rebounded relatively quickly, the Eurozone's recovery has been slower and more uneven, due in part to difficulties in coordinating responses among the member countries.
Political instability and trade uncertainties have also played a part in the Euro's depreciation. Brexit and its ongoing negotiations have added to the economic uncertainty, putting additional pressure on the Euro.
Moreover, the European Central Bank's monetary policy has also been under scrutiny. The ECB's decisions to keep interest rates low in an effort to stimulate the economy might have contributed to the devaluation of the Euro.
The effects of the Euro's depreciation are manifold. It makes European goods and services cheaper for foreign buyers, potentially boosting exports for Eurozone countries. However, it also makes imports more expensive, which could stoke inflation. For investors, a weaker Euro can have mixed impacts. It could harm those holding assets denominated in Euros, while presenting a buying opportunity for others.
For everyday citizens in the Eurozone, the falling Euro may make foreign travel more expensive and increase the cost of goods imported from non-Euro countries.
In conclusion, the decline of the Euro is a complex issue with far-reaching implications. As policymakers and economists grapple with this challenge, the rest of the world watches closely, understanding that the ripples from this situation will undoubtedly have a global impact.
XAUUSD: Gold Price Forecast!XAU/USD holds steady above 1,920 level, not out of the woods yet
The Federal Reserve (Fed) has indicated that interest rates may still need to increase by up to 50 basis points by the end of this year. Furthermore, Fed Chair Jerome Powell, in his recent two-day testimony before Congress, stated that the US central bank does not foresee any rate cuts in the near future. The Fed will wait until it is confident that inflation is trending towards the 2% target before making any changes. As a result, the focus will be on the release of the US Personal Consumption Expenditures (PCE) Price Index, which is the Fed's preferred measure of inflation, on Friday. This release could impact expectations regarding the next policy decision.

Gold long idea Based on the weekly market structure the following statements can be made:
- Following the previous 3 week's trend, we are looking at a classic market maker dump&pump scheme.
1) price is dropping on Monday and thuesday.
2) On Wednesday price normally makes a fakeout to the downside, trapping breakout traders
3) Market makers pump prices to the opposite direction on thuesday, collecting the liquidity from the trend.
We have 5 confluences for bullish price action:
1) Price touched a 4h orderblock
2) Price broke below a previous low, creating a discounted price on Wednesday.
3) price created a triple wick rejection with bullish engulfing candle on the 1h chart
4) We have trapped volume from wednesday's New York session
5) selloffs are bought back instantly (seen on the 5m chart)
Trade wisely,
Peter

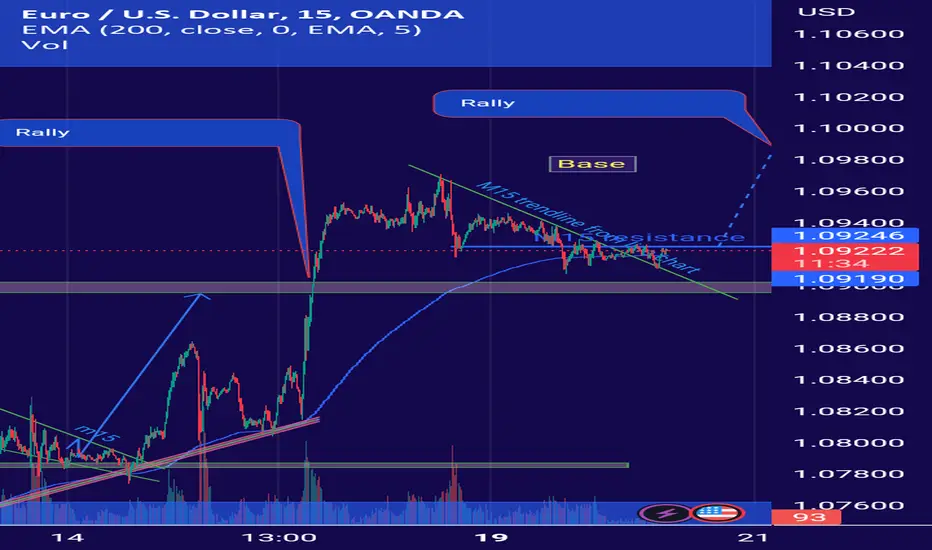
Eurusd buyEurUsd has moved with high bull pressurer to this level and formed a Rally and now its moving downwards to form a base there will possibly be a rally in upcoming time we will be waiting for price to break M15 Resistance level as price has already broke M15 trendline the confirmation to buy trade will be a break out of M15 resistance and retest on level with a price action we be buying this pair another confluance for buying this pair is that price is having support on 200EM and a bullish Morubozu candles while break out of M15 trendline so for a safe trade setup we will wait for M15 resistance breakout and retest
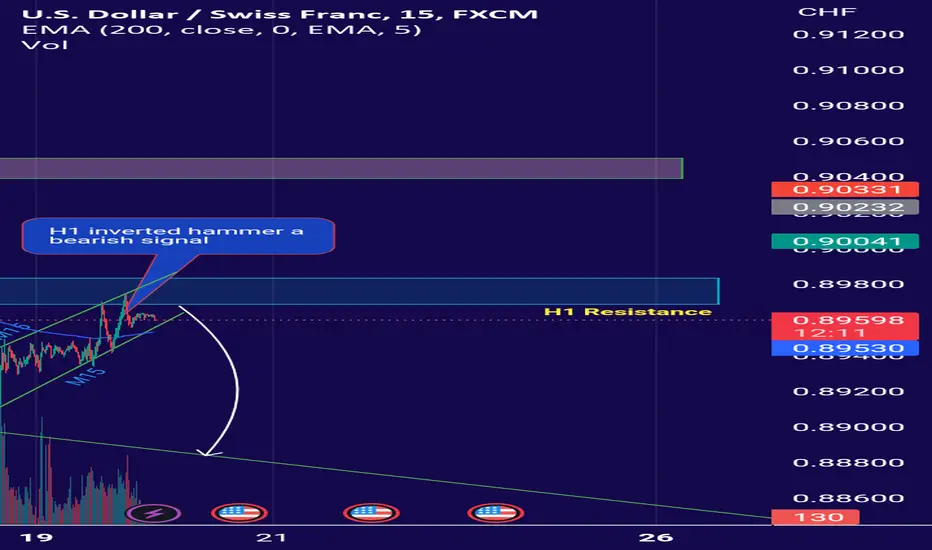
USDCHF sellUS dollar vs swiss franc the pair has pulled over to the H1 resistance zone and on this level it has shown a rejection with an inverted hammer through which it looks like bulls have losen up some control but also am watching this zone as retailers will be misguided here with a buy trade setup as the pair is moving in a channel formation so its possible that pair will fakeout the resistance zone and will come back to its direction selling to its daily level trendline so we will be waiting for a bearish setup to form as a scalper inverted hammer 🔨 is enough for me to enter sell trade but i am waiting for a proper confirmation candle like Bearish Engulfing or a Bearish Morubozu
XTIUSD sellwti crude oil or XTIUSD has formed a wedge pattern and we are watching for price to reach at our resistance level so we will be making a short trade so waiting for price action to form and we will be shorting this commodity there is another confluance for this short trade is 200 EMA resistance so we will be shorting

Can You Trade The Cycle?Hi folks,
We're going to talk about trade cycles today. I hope you love learning! The strongest power is knowledge! We'll be stronger together!
In economics, a trade cycle is a pattern of economic activity that repeats itself over time. It is often characterized by periods of expansion, followed by periods of contraction. The trade cycle can be caused by a variety of factors, including changes in government policy, technological innovation, and consumer demand.
The trade cycle is also known as the business cycle or economic cycle. It is a recurring but not periodic fluctuation found in a nation's aggregate economic activity- a cycle that consists of expansions occurring at about the same time in many economic activities, followed by similarly general contractions (recessions).
There are a number of different types of trade cycles, each with its own characteristics. Some of the most common types of trade cycles include:
Kitchin cycle : The Kitchin cycle is a 4- to 5-year cycle of economic activity. It is named after Joseph Kitchin, an English economist who first described it in the 1920s. The Kitchin cycle is typically characterized by a period of rising prices, followed by a period of falling prices, followed by a period of rising prices again.
Juglar cycle : The Juglar cycle is a 10- to 15-year cycle of economic activity. It is named after Clement Juglar, a French economist who first described it in the 19th century. The Juglar cycle is typically characterized by a period of expansion, a period of contraction, a period of recovery, and another period of expansion.
Kondratiev cycle : The Kondratieff cycle is a 50- to 60-year cycle of economic activity. It is named after Nikolai Kondratieff, a Russian economist who first described it in the 1920s. The Kondratieff cycle is typically characterized by four phases: prosperity, recession, depression, and recovery.
Now, we know what cycles are in the shape of context. There is a million dollars question.
Can we trade the cycles?
As a trader or an investor, we definitely can trade the cycles. However, we need to learn what the cycle is, and how can it start or end.
There are a number of ways that a trader can trade the cycle. Some popular methods include:
1- Using fundamental analysis . Fundamental analysis can be used to assess the underlying value of a security. This information can be used to identify potential undervalued or overvalued securities.
2- Using cycle analysis. Cycle analysis is a more specialized form of technical analysis that focuses on identifying cycles in market prices. This information can be used to identify potential entry and exit points for trades, as well as to forecast future price movements.
3- Using technical analysis. Technical analysis can be used to identify key support and resistance levels, as well as trendlines and patterns. This information can be used to identify potential entry and exit points for trades.
It is important to note that there is no one-size-fits-all approach to trading the cycle. The best approach will vary depending on the individual trader's risk tolerance, trading style, and investment goals .
Final Tips:
📍 Use a stop-loss order . A stop-loss order is a type of order that automatically closes a trade if the price of a security reaches a certain level. This can help to protect your profits and limit your losses.
📍 Use a trailing stop-loss order . A trailing stop-loss order is a type of order that automatically moves with the price of a security. This can help to lock in profits and protect your gains.
📍 Be patient . Trading the cycle can be a patient game. It is important to be patient and wait for the right opportunities to trade.
📍 Don't overtrade . It is important to avoid overtrading. Overtrading can lead to losses and can also increase your risk.
Bonus Chart : US10Y
A task for you! Look at the bonus chart and leave your thoughts considering the correlation between US10Y and SP500 or ONS.

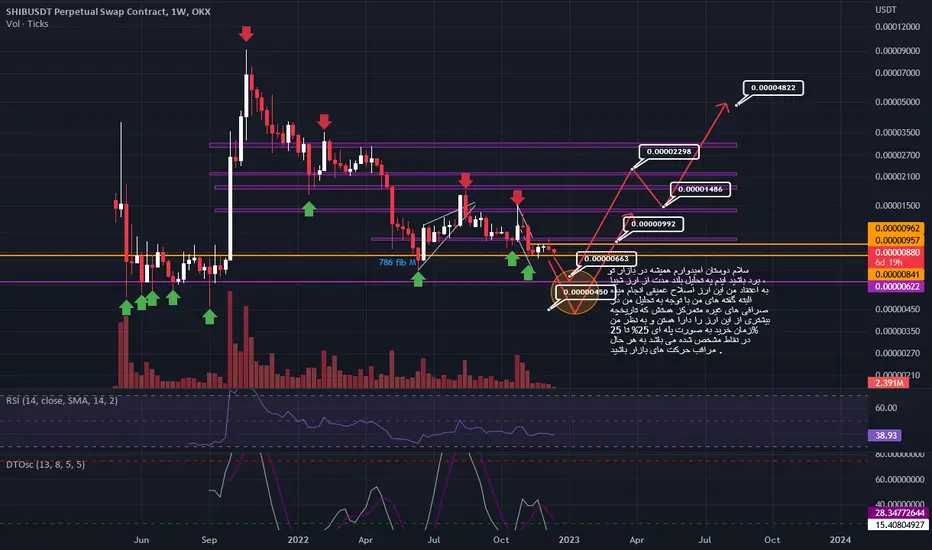
shiba shibusdt Hello friends, I hope you always win in the market. This is a long-term analysis of SHIBUSDT currency. I believe that this currency is undergoing a deep correction. However, my words are focused on other exchanges, which have more history than this currency. There are, and in my opinion, the time of purchase is 25% to 25% at specified points, in any case, be careful of market movements.
Review and Trading plan for 13th June 2023Nifty future and banknifty future analysis and intraday plan in kannada.
This video is for information/education purpose only. you are 100% responsible for any actions you take by reading/viewing this post.
please consult your financial advisor before taking any action.
----Vinaykumar hiremath, CMT

USDJPY Trade 160 Pips TargetYo guys I'm back. I focus on gbpjpy & usdjpy
On the Weekly & daily timeframe I'm bullish, I just follow the daily structure. We see a lot of wicks to the downside and on the 4h timeframe we hit our support level.
I always use 2 Charts (left chart for overall direction on higher timeframes and on the right chart 30-min timeframe for entries.
