What can A.I. powered trading system do to generate alpha?No wonder trading is hard! I have been watching and learning how to trade the futures for the last couple of years and it’s been a remarkable learning curve for me! The dramatically changing market conditions and extreme volatility can make newbies like me get caught up in emotions and left looking for help.
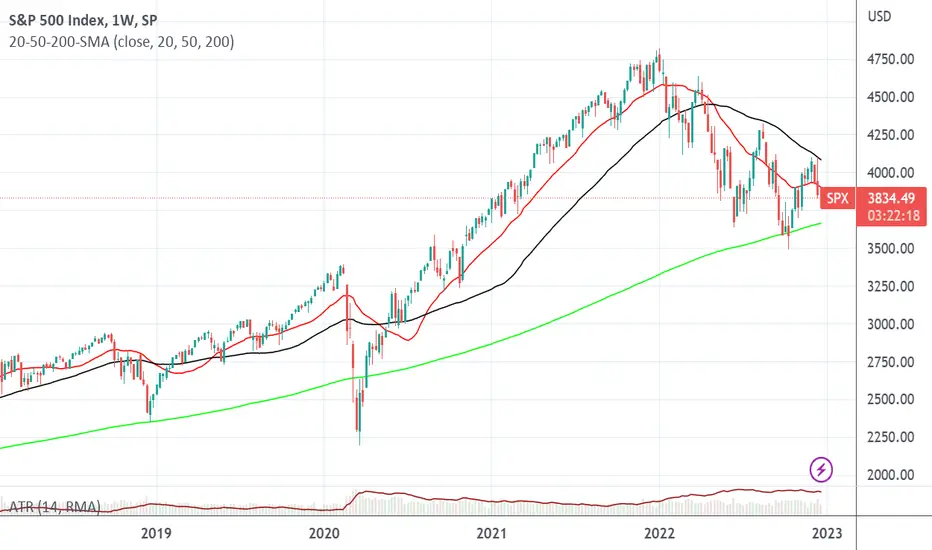
I recently came across a very interesting website that publish their proprietary AI-based trading strategies every morning along with the results these models generated during that trading day. Interestingly, their trading system’s return has been more than double over the last 4 years, while the system’s beta has been ZERO! Does this prove the robustness and fundamental strength of AI-powered trading systems?
Would love to know what other traders think. Feel free to comment.
Traders
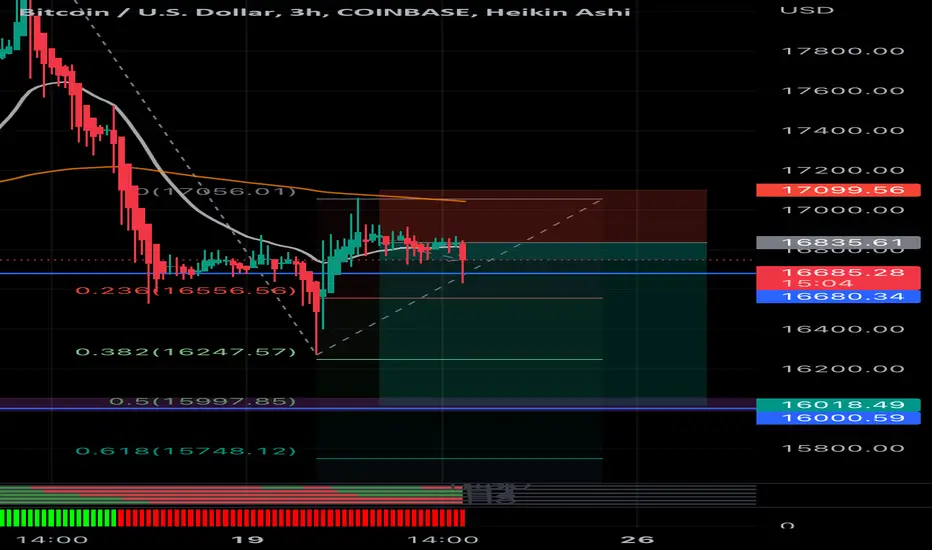
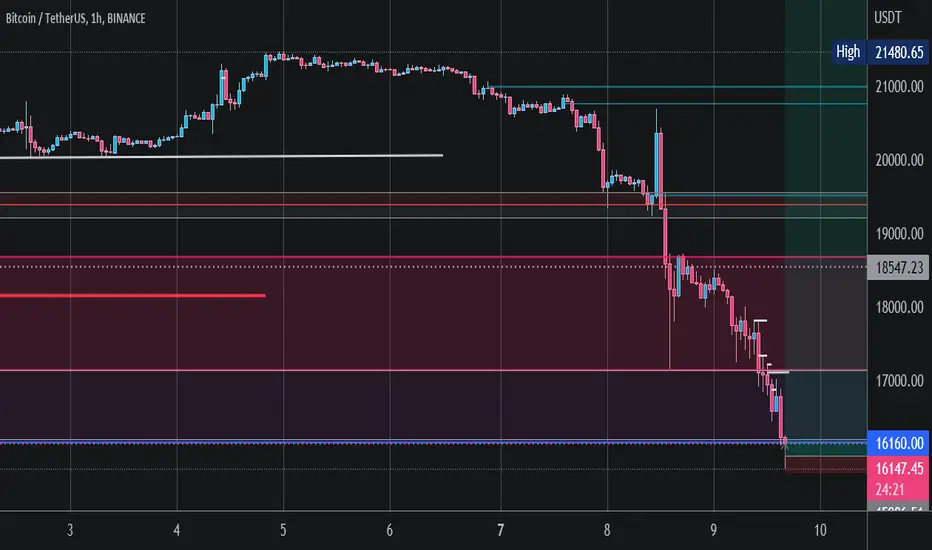
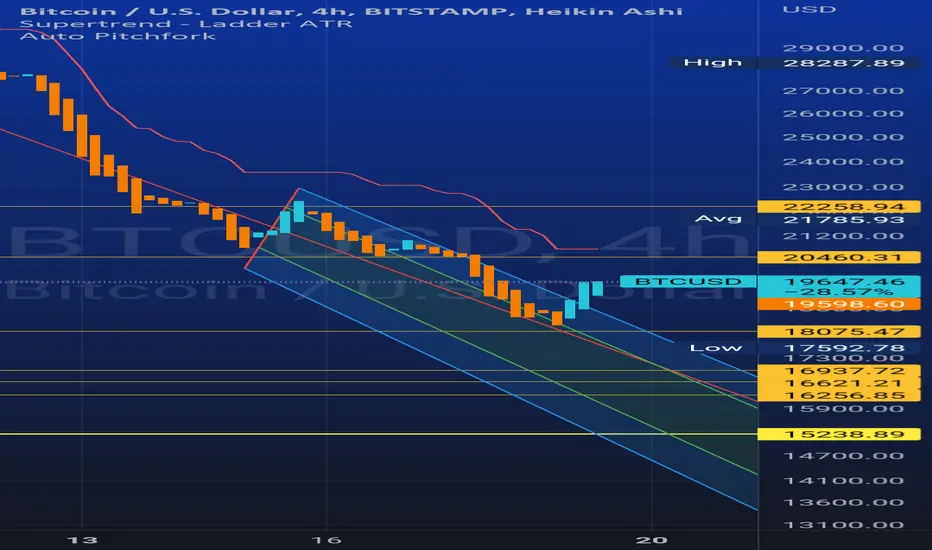
Short BTCShort BTC to 16,000.
Nice strong move down over the 200ema, the ema indicator also now turning down.
16000 aligns beautifully with the 0.5 fib and previous resistance. The move to 0.5 fib has an 85% chance if it clears 16550 area.
Coupled with my Donchain Ribbon showing red throughout and my Heatmap showing lots of red - I like this trade.
Stop at 17100.
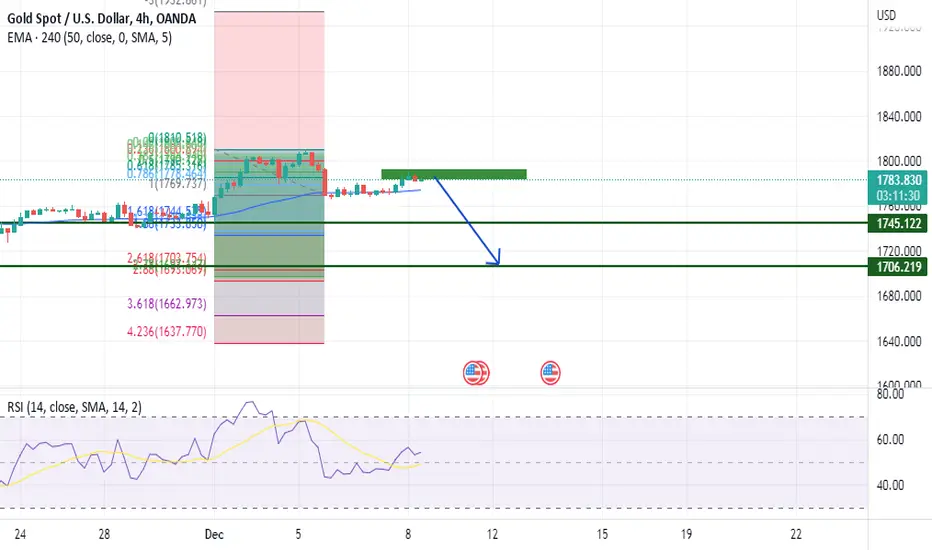
XAUUSD 13/12 : sell view to 1766-1745XAUUSD 13/12
Sell 1786-1790, TP 1766-1745, the best stoploss to break this setup is 1813. However, you can put SL at 1796, in the bad situation when this SL hit, you can wait to sell again
At current price of 1783, you can sell a small trade first if you do not have any sell trades opening now
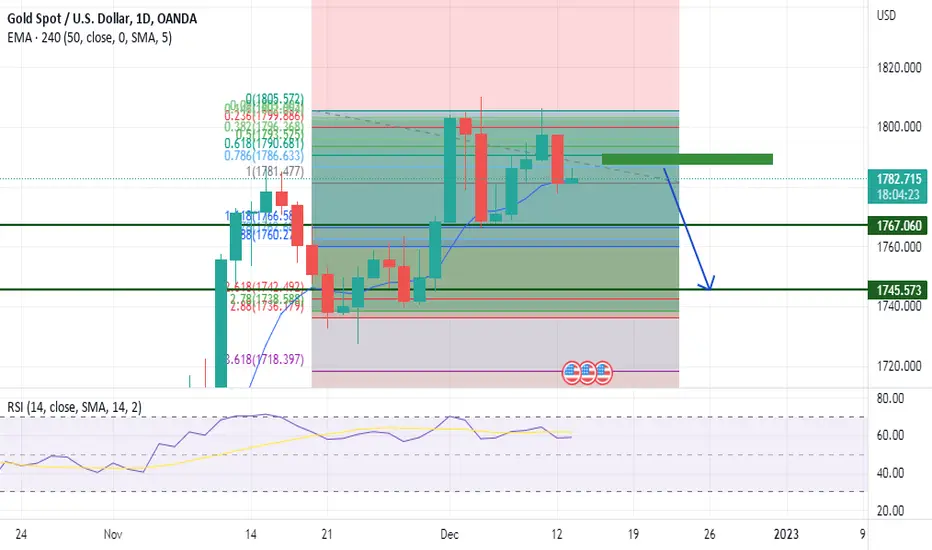
GOLD sell view to 1745 futher 1706GOLD sell 1783-1788, SL 1813, TP 1745 futher 1706
This technical setup is based on Fibonacci retracement + S&D + Price action
How "Smart Money" Uses Your EmotionsWhen trading most of us entry our trades TOO EARLY. Ofcouse we don't want to miss the opportunity to make money. This is one of us basic fear and its called "fear of missing out" Everybody knows this fear but we still feel it. And it is not just trading. You feel it when your friends go out and they did not invite so you feel miserable and left out. So its natural and I struggle with it myself everyday too. The thing you gotta understand is that the "SMART MONEY TRYES TO TRAP YOUR TRADES" using your fear of "fear of missing out".
For example you can see in the chart the circles that I marked when doing my backtest. See Theres normally some type of keylevel like support zone that the price touches. Everyone is expecting that the price is going to bouce after touching the support zone which it does. But before that the price breaks the support zone slighly and traps everyone to get more liquity to the trade. They dont do that to just bully you they do it because they need more contracts to buy and if peapol think its a bear breakout theres a lot contracts for good price to buy. They just try to hedge they position and get the best Risk Reward ratio. You know that feeling when the trade feels perfect and the you get wicked out. I know bro it hurts.
So how can we avoid these LIQUITY TRAPS?
The Markets always tests your patinece in situations like this. But i get that you cant be just patient to make money in the markets because if you have too much confirmation your probably late and if you have too little confirmation your probably in a risky situation. Everyone struggles with this and theres no one right answer. But what i can suggest you to do is wait for the VOLUME GRAB and then entry your trades. Then theres bigger chance to a winnig trade and it will be easier to trade when i dosen't give you mixed signals.
When Trading
1) Be patient
2) Wait for the volume crab
3) Get the confirmation that your strategy needs
Im trying to build a trading strategy to this specific relying on these "Smart Money Traps". So Follow if you wanna see the future UPDATES!

Counter TradeHow to take counter trade ? in this video we try to make it easy to took a counter trade (Against the trend) and to make quick money from market
#nifty
#priceaction #priceactiontrading #optionanalysis #banknifty #bankniftyprediction
#nifty50 #niftytomorrow #niftyprediction #niftyanalysis #niftyfifty #niftytoday #niftybank #banknifty #bankniftytomorrow #bankniftyprediction #bnkniftytrading #charts #technicalanalysis #crypto #sensex #nse #nseindia #bse #optionsellingstrategy #optionstrading #optionsellingstrategy #optionstrategy #optiontrading #optionsellingstrategy

a gift for traders 🔥 🔥🔥🔥how much institutional traders make ?
well this is just an example for you guys
NZDUSD BIG MOVEMENT !Well here we have a good point to take a enter in nzdusd trade as the risk and reward ratio is like 1:3

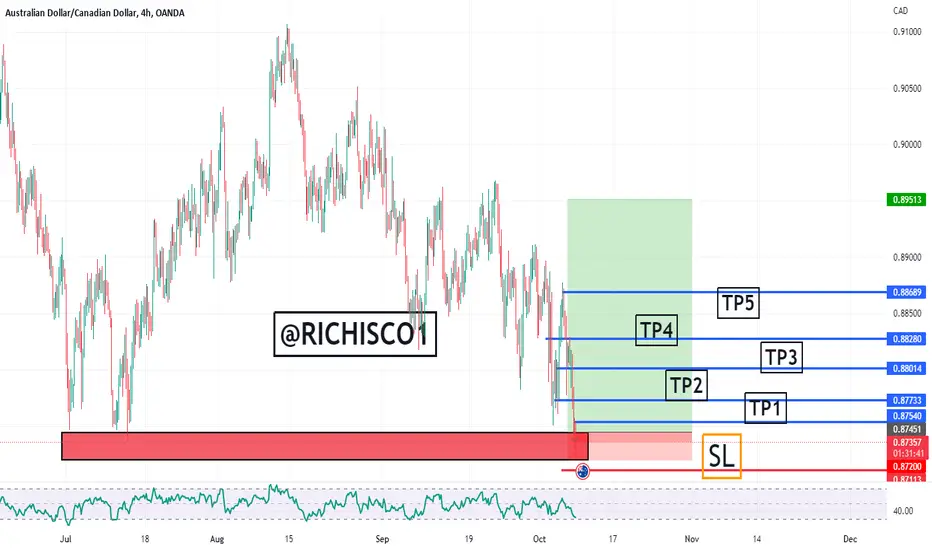
LONG ON AUDCADAUDCAD is on its strong support and may reverse any moment from now. let rock.
NOTE: I am not a financial adviser. risk management is key.
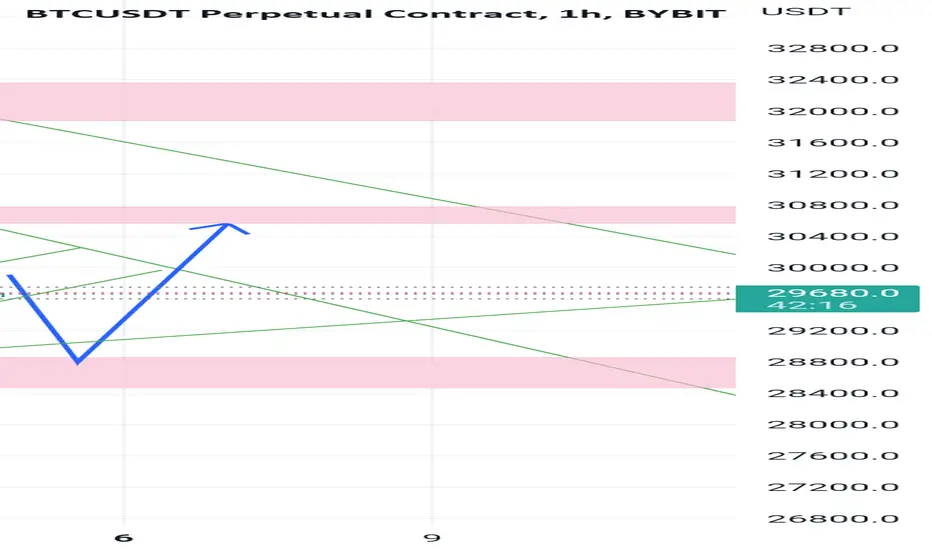
BTCUSDT in 2D T.F Bullish ideaBTCUSDT is Trying to Break a Majour Resistance if break a current restance and closed 50% up in shape of bullish candle so you can follow btc and catch the retracement of btc for long

AHHHH PLEASEE EXPLAIN?? Never seen anything like this charting.... Any explanations or answers please.
FUNDAMENTAL OR TECHNICAL ANALYSIS?
The debate about the most reliable and effective method to trade the markets with is still on.
Whether it is Cryptocurrencies, Forex or the Stock market. It is imperative that the serious trader has an effective tool that will give them an edge in the markets.
Most professional traders in investment banks would argue that fundamental analysis is the most effective method to rely on when making considerations to take a position in the market.
Fundamental analysis is the study and research of a particular asset, whether in the Cryptocurrency market, i.e. Bitcoin, Etherum, Litecoin, or in the Forex market where you have currency pairs like Eurusd, Gbpusd Usdjpy and so on, or in the stock market where there are company shares to be bought like Apple, Amazon and Tesla.
In the Crypto world, the fundamental analyst will focus on the progress of a particular cryptocurrency, this could be measured either through the acceptance of a particular crypto by financial institutions, or companies or country.
An example of this was seen in the market on the 8th of May 2021 when Dogecoin had a rise to it's highest point (0.74 cent) after a series of tweets from Elon Musk (CEO and founder of Tesla).
In Forex the fundamental analyst will look to the GDP (Gross Domestic Product) of a country, or CPI (Consumer Price Index) to make a decision whether to buy or sell.
The fundamental analyst will also study the statement coming from the central bank of a particular currency, i.e. for GBP(Great British Pounds) it will be The Bank of England, for the Euro it will be The European Central Bank (ECB) and for the dollar it will be The Federal Reserve (The Federal Reserve System).
The fundamental analyst studies the statement made by the Central bank governor or other high ranking members before making a decision on whether to buy, sell, or stand aside.
In the Stock market, the fundamental analyst will most likely study the company earnings, quarterly reports and the general health of the company, the fundamental analyst wants to know if the company is in losses or profitable, and if profitable, the fundamental analyst wants to see that the company has a steady equity growth, The fundamental analyst is interested in the leadership of the company, what the company does, and if it's products are in high demand.
All these are factors that guide the fundamental analyst when making a decision to take a position, whether Cryptocurrencies, Stocks or Forex, one thing is certain, and it is that a robust research must be carried out by the fundamental analyst before taking a position in the market.
Most retail traders are technical analysts, and do not look to the Central banks, in the case of currency pairs, company earnings in the case of stocks, or the acceptance by financial institutions in the case of cryptocurrencies.
Instead, the technical analyst studies the charts, the primary objective is to look for recognizable patterns that has been identified in the past and could show up again in the future, albeit with slight difference in appearance.
The technical analyst could rely on the application of traditional technical analysis and make use of indicators, oscillators, trend lines, Fibonacci tool, pattern recognition (divergence, hidden divergence, double tops and bottoms flags e.t.c) with close observation of these tools, a technical analyst could tell with very high level of accuracy the next direction of an asset.
Of course the above statement is true only in the absence of a Black Swan event. The word Black Swan is used in the trading world to identify an unusual day, where things abnormal occurs and could destabilize the market. Examples of Black Swan events are: Brexit, Trump winning the 2016 election in the U.S., and the Swiss national bank removing the cap on the Euro in 2015.
The technical analyst could also rely on harmonics to trade, looking at the patterns on the charts with or without multiple indicators. An example would be the application of the Elliott Wave theory, where there are impulse or motive waves in the form of a five step move in the direction of the trend and corrective waves in the form of a three step move that goes counter trend hence the term corrective waves. The Elliott Wave Theory is an effective method to trade the market if practiced and applied correctly.
In conclusion, it is fair to note that both technical analysis and fundamental analysis like everything else in life have their strengths and weaknesses.
However, it might be a much more effective method to combine both the technical and fundamental analysis of any asset before making a decision. That way one could have the best of both worlds and a higher probability of profitability in the markets.
John Emefeke.
T.A.
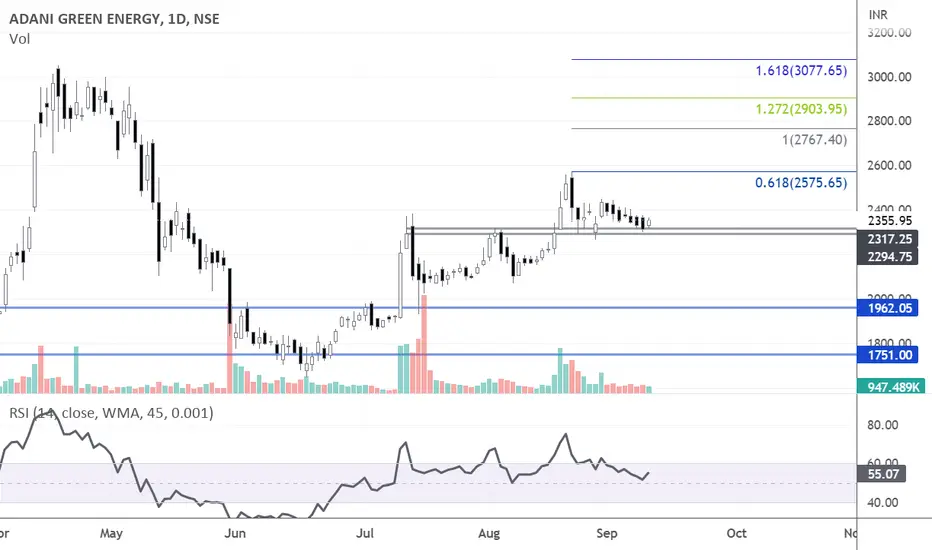
ADANIGREEN - Pullback TradeAdani Green looks good on the daily chart, there is a higher high, higher low price structure on the chart.
Currently, prices are taking support at the previous top ( 2294 - 2317 ).
Holding the support zone, the stock can test 2575( swing) and 2700-2800(positional) levels in the coming trading sessions.
Trade with a good risk-reward ratio
Risk 4% , Reward 8 - 20%
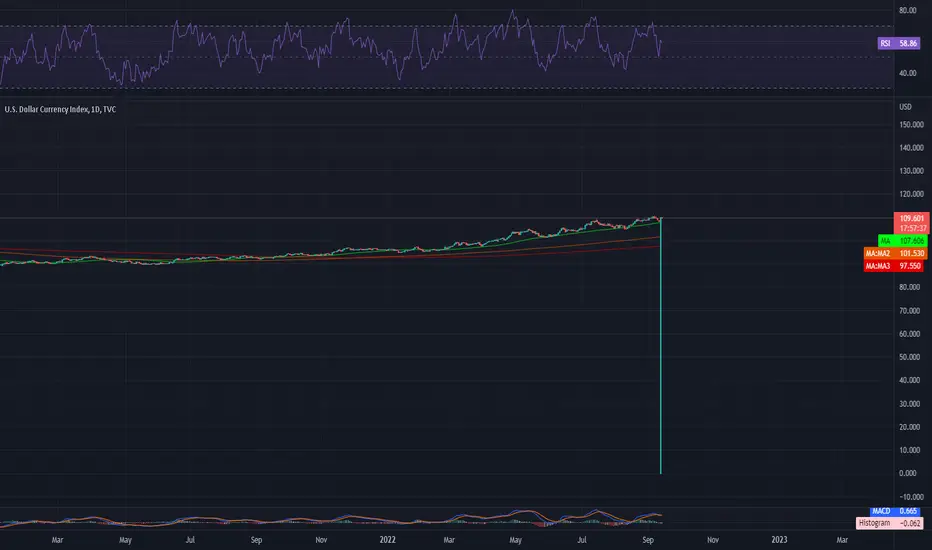
DXY I see some reversal soon Price broke below the pattern that was what I expected. I'm waiting and watching for a bearish flag continuational pattern or any continuational pattern on the lower time frame to take a sell. I'll likely post if there is a correction to continue if possible. This will be my style of taking this trade!
Note it's of a financial advice
Thanks for reading
AS ALWAYS TRADE SAFE AND STAY SAFE!

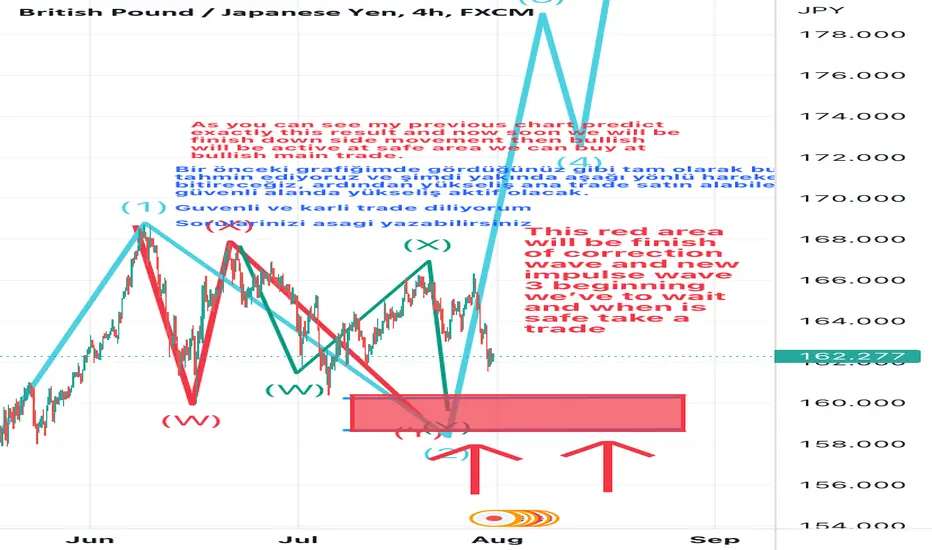
Gbpjpy prediction work well stay on right pathAs you can see my previous chart predict exactly this result and now soon we will be finish down side movement then bullish will be active at safe area we can buy at bullish main trade.
Have a safe and profitable trade
Any question please comment below
BIGGEST TRADING ADVICE IN this video, I tell you the best trading advice without saying a word. ENJOY 💚💡

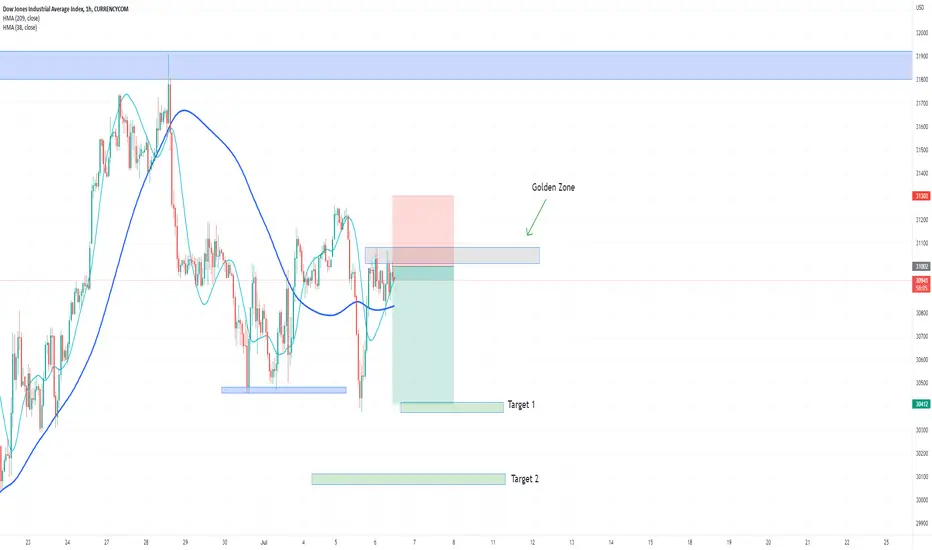
sell Us30 nowus30 now is on golden zone😉
didn't case the resistance and this is a high zone of demand
50% of fibonatchi
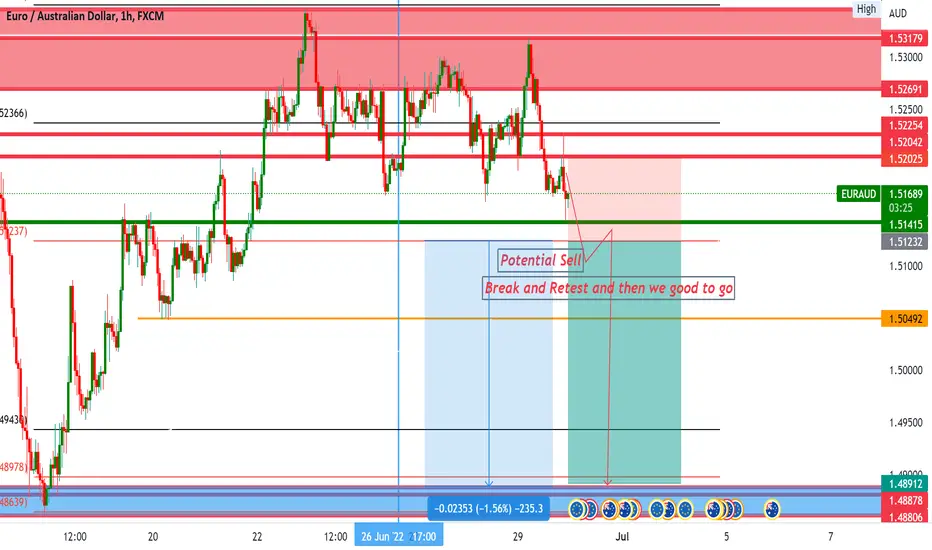
POTENTIAL SELL SETUP ON EURAUD I'll keep it simple we want a break out and retest current support/demand are. Once confirm SELL ENTRY Is Fully activated. Use proper risk management regardless if the market go sideways or in the direction we predict that market is going.
$IBO with a transcendental ascent on the TSX-V index
$IBO has presented a rather magnificent momentum in the market and is moving up with a firm footing. Shares are trading at $0.05 per share with no noted loss percentage
BTC/USDThis is the current sentiment and outlook for BTC @ the moment. The financials apparently run BTC. Whenever the Financials decide 😂😂😂
Bitcoin : the end of the cenemaBINANCE:BTCUSDT
if You Trade bitcoin its Great chance to have big profit Just wait for break out of the trend line with powerful volume watch the green magic
dont forget your risk management and youre trading psychologie

BTC FORMING A BEARISH RISING WEDGE.Bitcoin is forming a bearish rising wedge on the 1HR Timeframe....
Keep watching out for the next big move.
A sell in progress for my fellow traders out there 🤑📉😁.