Gold (XAUUSD) | Trade IdeasSince Mid June 2021, Gold move sideways between 1721.66-1834.2. And for traders who still wanna trade this gold now, I give you some trade ideas like in the chart. You have remind yourself that Gold now under bearish bias. The chance is price can drag down again around 1834.2, so be careful when market already near or around that level.
Good luck then.
Traders

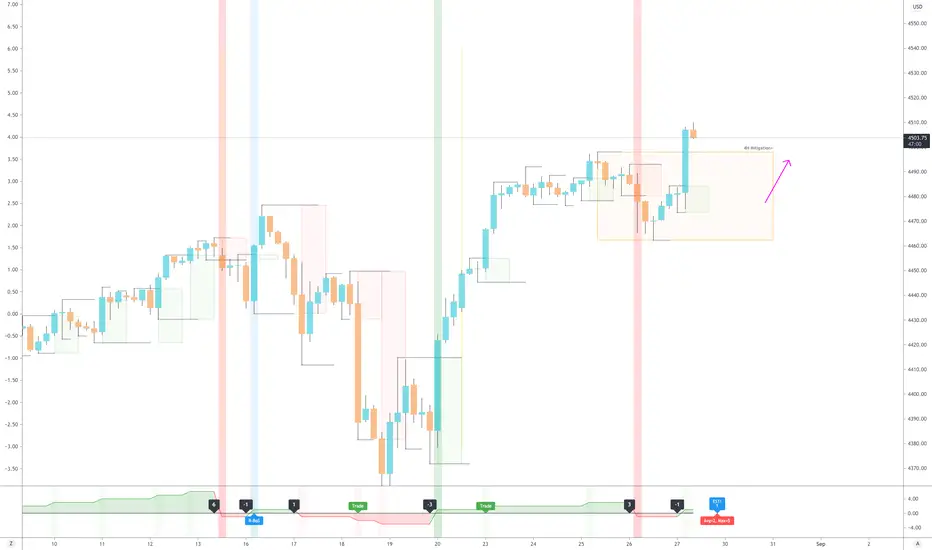
EURUSD | Intra Day Shorts?EURUSD shorts that unfolded earlier today around 1.16587, It presented as a clear trade setup (H&S) as most of us know about this pattern but very few understand the technicals behind it and how it should be traded, I personally didn't take this trade as i was not trading during this time and mostly focus on (London Open) but thought I'll share this anyways and hopefully it might help someone here in their (Trading Journey) so back to the technicals... Entry level would be off the right shoulder that's lined up with our 61.80% fibonacci level and stops can be placed above previous candle closure and 78.50% fibonacci level, any price break above this will indicate a trend reversal and to manage our trade, we would want to be stopped out before the massive move happens. So stops would need to be placed above this level and traded at 1% risk or lower, I personally take all my trades at 0.25% risk regardless how right i am with trading, my main focus in trading is capital protection and it should be yours too. Exit levels on this will be the -23.00 | -61.80% fibonacci.
This is one of many profitable setups that can be traded, however - my best advice is to find one setup and stick with that daily, weekly.
I will start posting more content and trade idea's here later this week.
I'm enjoying it.
Kind Regards.

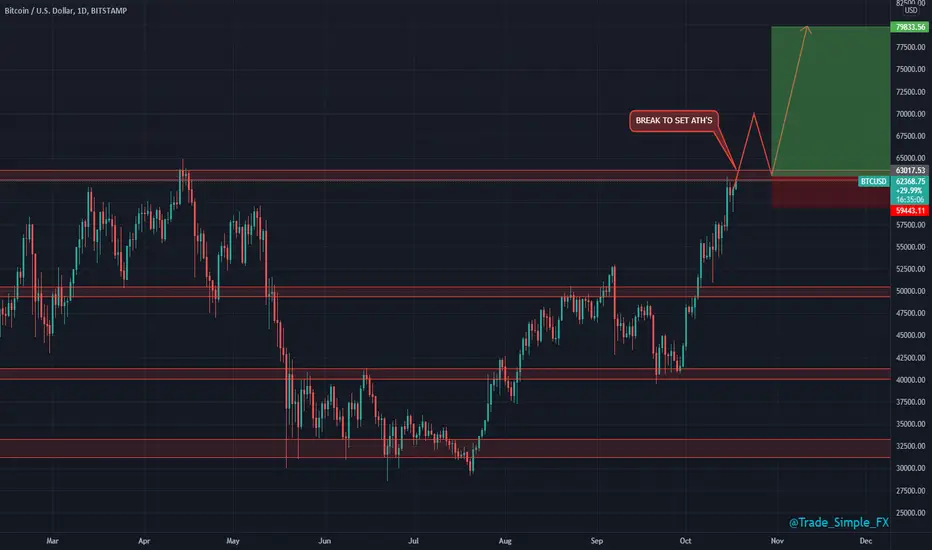
BTCUSD D1 - Long SetupBTCUSD D1
On fire, good week and weekend for BTC and other cryptos. Threatening to set new ATH's as we approach our top end resistance price of $63k.
Awaiting a break and retest before entries for both investing and trading.
We could see some rejections here back down to $50k, this would justify a more healthy correction from the rally starting from $40k, but lets see what happens.
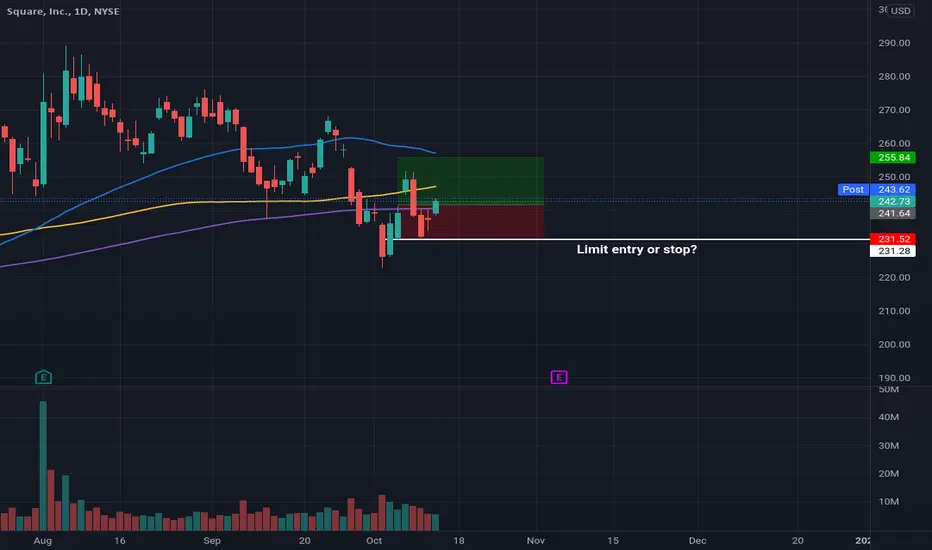
SQ double bottom?This is a very classic setup on SQ. Buying off daily 200 on a double bottom. And in the last 3 bars it was a perfect breakout. Nice close today. Nice increasing volume on the long bearish dip in Oct 4th meaning people are trapped. Nice 1.4 risk/reward ratio.
But the experienced trader inside me is yelling and saying I should buy the stop of this classic setup. What do you think I will do :wink:?
GBPUSD- BULLISH AND BEARISH SETUPGBPUSD
Orderflow- Bearish
- Price retracing for deep pullback to grab some internal liquidity structure with a Bull bias for short term BUY
- Market manipulation
Price left with imbalance in price disagreement with buyers this brings back the setup for the Bears to take charge of the market again
If you find my setup useful please do like and follow

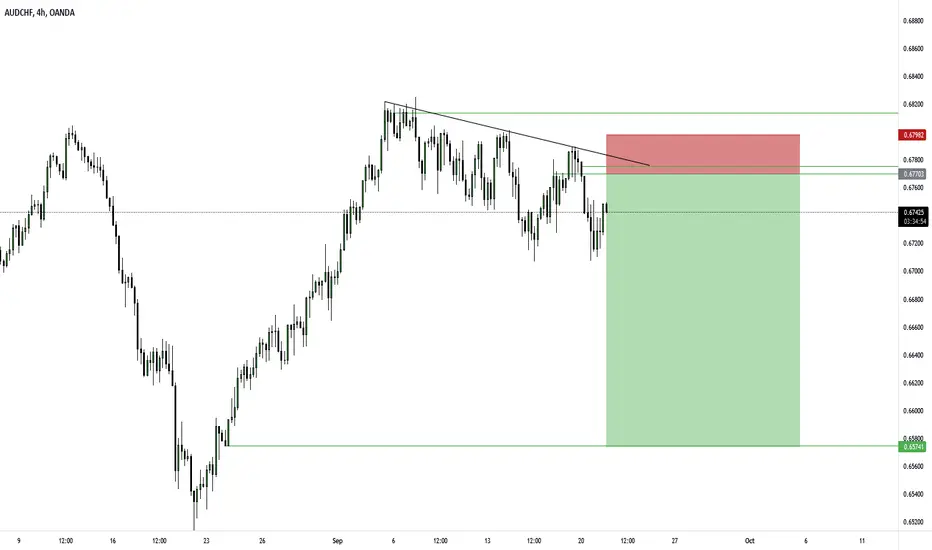
AUDCHFAUDCHF looking forward to drop with AC while we are still in a strong down trend ... i will wait for two hr confirmation when confirmed trade will be called
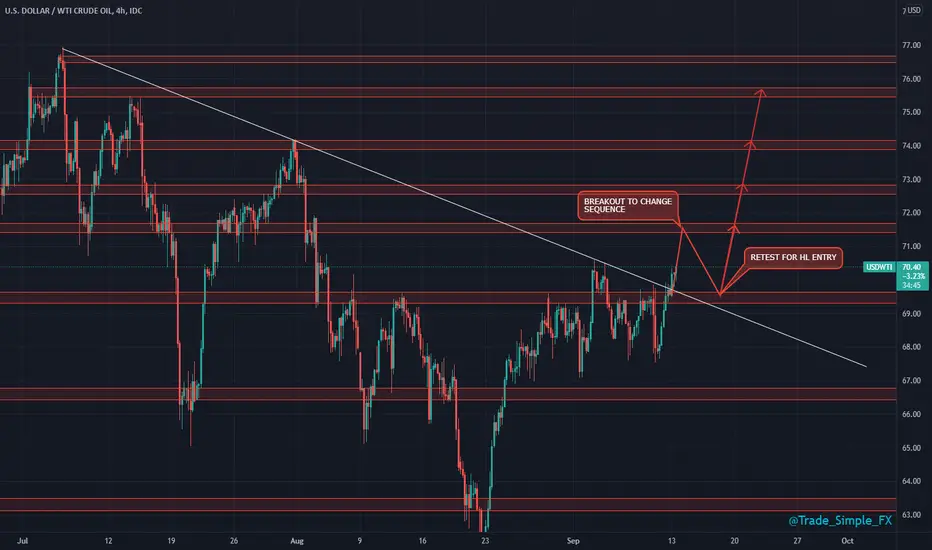
USDWTI H4 - Long SetupUSDWTI H4
Something we were following last week, took a couple of short positions on this pair for 1R and 1.3R before being stopped at entry/profit.
We have now started to see an upside breakout of both S/R and trend sequence. A bit more of a convincing breakout and subsequent retest could offer us long entries.
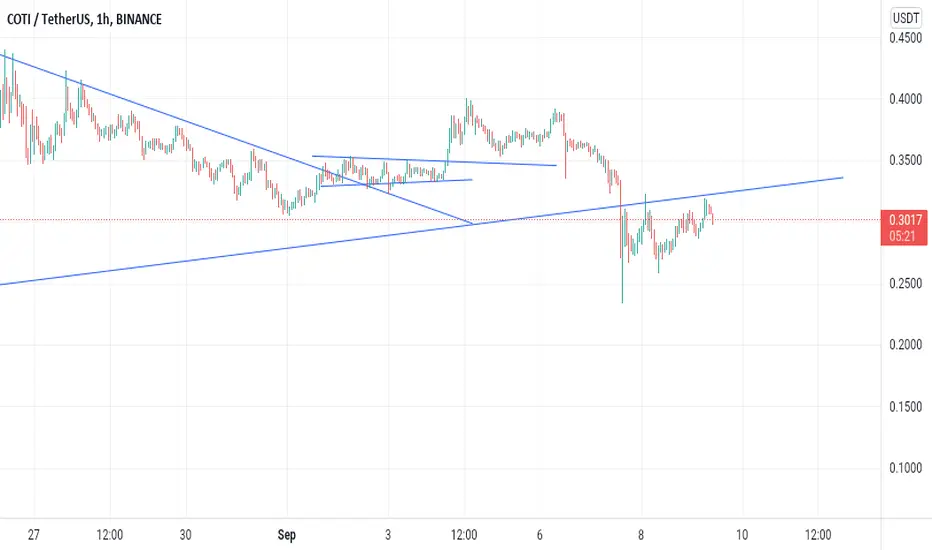
Coti analysis by vicWe are still in a bearish phase because of the bearish spike btc made so bears might show faces on this and any REJECTION from the bull we will go down and vice versa
Like
Share follow up and comment
Note➡️➡️➡️ People that says my analysis aren't correct yàa it might not be correct but as we all know No ONE IS Perfect when it comes to the market
Thumbs up if you like the idea or found it mildly interesting
It's Not a trading Advice
Note always check out your own research before opening any position take note
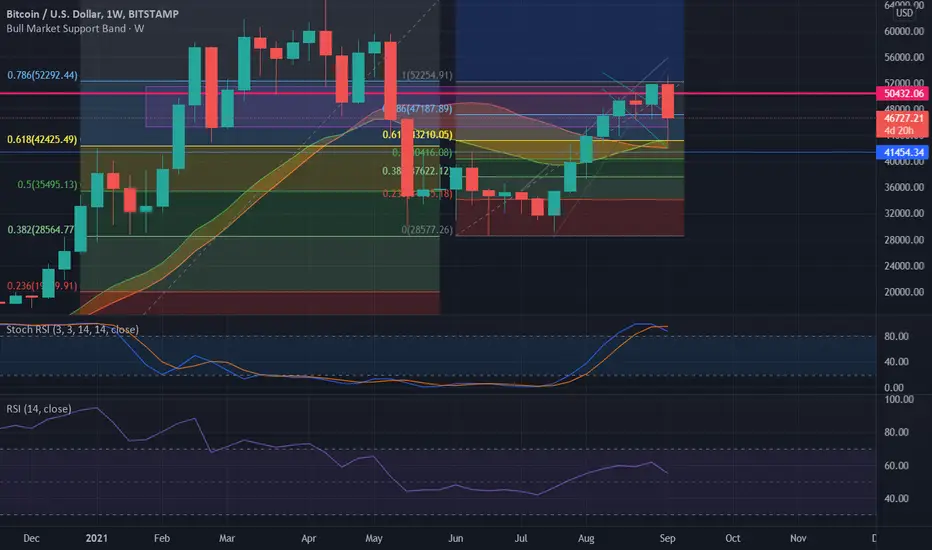
Bitcoin crashed.!!!!! The bull Market support band should hold.Hello Traders,
It was quite a shock yesterday but you shouldn't have been worried if you are following my chart properly. As for those who are new trust me, believe me when i tell you something important that no one would. You don't have to fear anything. Don't get scared of this slight pullback. Look at the bright side you weren't fallen from $64k but just mere $52k with 20% correction. Absolutely normal. You could have easily recovered the profits if you had a backup money which you should always have regardless of the bull or bear run.
So now arises an important question. Where to from here?????????
Fundamental Analysis :
If history has been any indication then we are right on track and we must carry our journey forward. But you have to know its september. Crazy things must happen this month and we have got three major dates for you.
!. On 13th-14th september depending on your timezone we have CPI data coming. A very important if you must know. (April 15) A high CPI is good because crypto loves inflation
2. On 21st-22nd september we have annual meeting of FED's. Some say we might get an idea about taper from there. If taper happens this year then you cant stop this rocket from going to the moon
3. We also should mark those dates when options are expiring. One such is on september 21 and one on last week of september. Do keep that in mind.
Technical analysis :
1. Charts are looking bad tbh but we have good news. No new shorts right now.
2. Fear is back in the market which is good opportunity to fill your bags.
3. Now we must hold bull market support band around 42-43k if we don't then maybe bears smell blood and will attack right away. Even i will join their party XD
4. 42.5k, 36k, 35k 31k, some major resistance to watch out if we break to downside.
Or at the end we all are in a bull trap in the mercy of institutions, financial cartel, big banks, IMF etc
Till then do not trade. Just accumulate with no leverage
Happy trading my bears and bulls
Regards
Dante. An artist of crypto.!!!
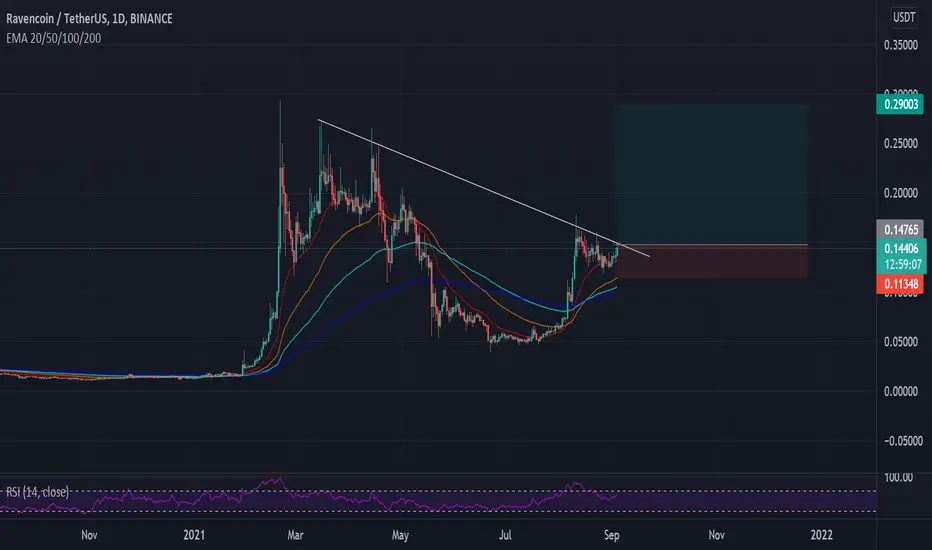
RVNUSDT - End of Cup HandleRVNUSDT - End of Cup Handle
RVN could be about to break through towards higher levels, what do you think?
Support has held and bounce off a few times, could we see 0.3?
Thanks,
TraderPaps
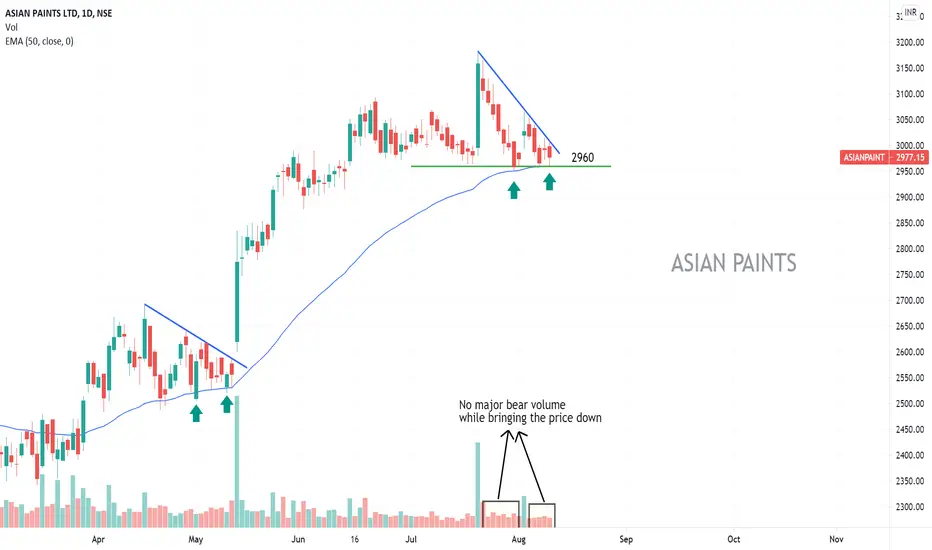
ASIAN PAINTS - Strong support!!.618 Fibonnaci level or 2960 is a crucial support for the stock.
Also, it is respecting the 50 EMA.
Less likely to breach.

It Looks Like A Double Bottom But Very Likely Could Be A TrapI was looking at this earlier as a potential double bottom with bullish divergence and was looking to take a position after the sessions opened but after a few hours of waiting and letting the trading of this asset go on during the sessions i have not seen anything that would signal immediate bullishness.
I think that this "Double Bottom" Has potential to trap many bulls and instead send the price down to around $9.
The signal i will be using to enter short is once the MACD breaks the trendline and crosses bearishly i think we will see a nice move down to the $9s

Short term buy : ES1! / Emini / SPY500Price tried to break lower but got reversed & broke higher.
This has trapped a bunch of seller.
When they exit, it'll create a bullish trade idea.
We can trade along!
BAJAJ AUTO - Multiple Bullish indicator1. Watch the support at 200 EMA always.
2. Formed a bullish candle at demand zone.
3. There was no major sell volume while the price was falling.

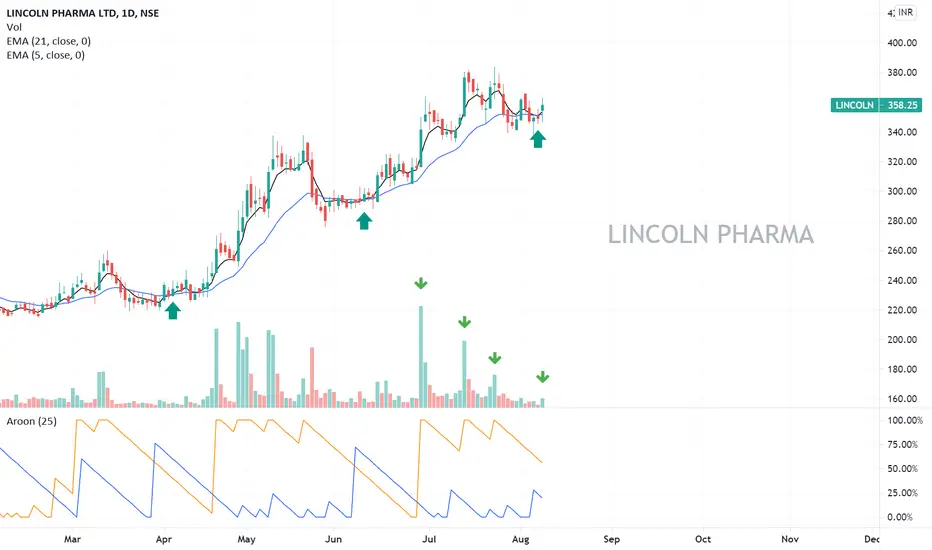
LINCOLN PHARMA - Bullish script!Look at the rally whenever 5*21 crossover happenns.
We have a similar crossover this time.
Also, note the bull volumes in the recent trend.
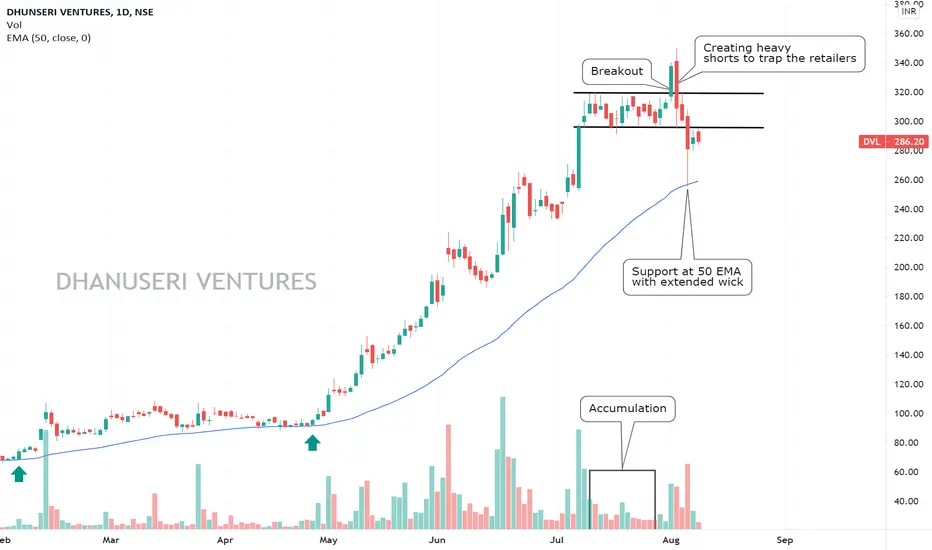
DVL - Fake breakout to remove the retailers!A similar pattern was observed in CDSL near 1200 levels.
A big SHORT was created to remove the retailers by lowering the price to unprecendented levels.
CDSL made a high of 1600 in next 2 weeks.!
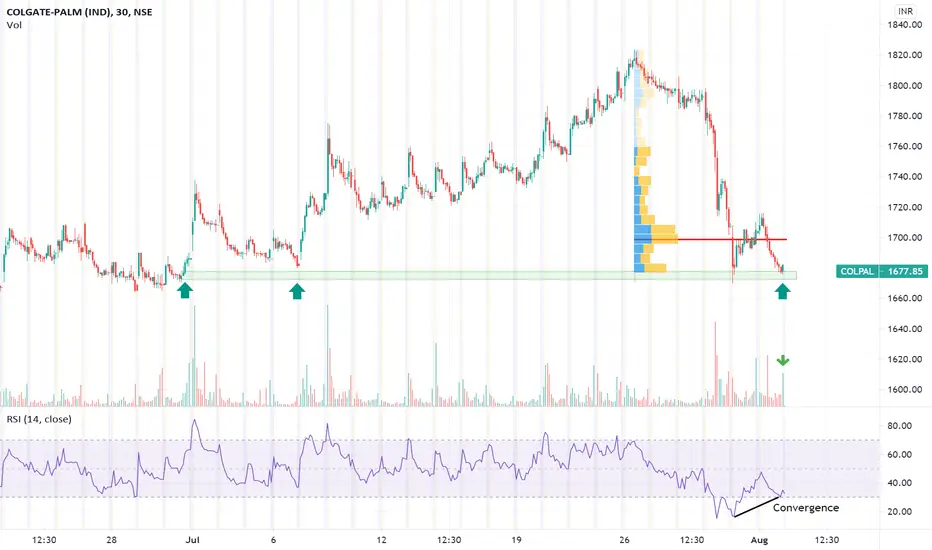
COLPAL - Possibility of a reversalStanding on a strong demand zone.
There are good chances of a reversal from here.
The RSI has shown +ve momentum.
View negated below 1670 close.

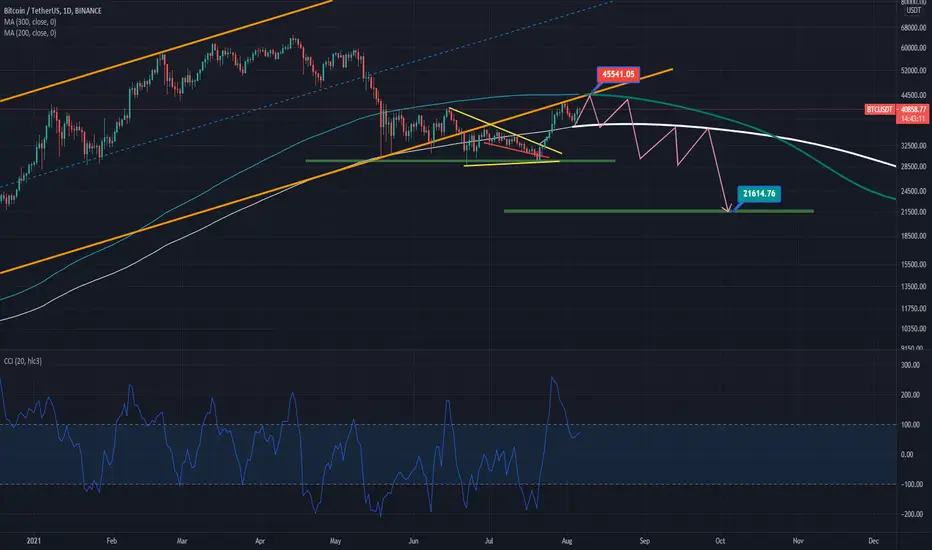
#BTCUSDTPossible move of Bitcoin in the coming days.
The above analysis is a prediction and may be incorrect.
According to the above analysis, MA200 is breaking MA300, which you can see the price reaction between these two MAs
Also, the speed and power of price movement is predicted and drawn based on Price Action.
I hope you do not get fomo and invest with strategy and at more reasonable prices.
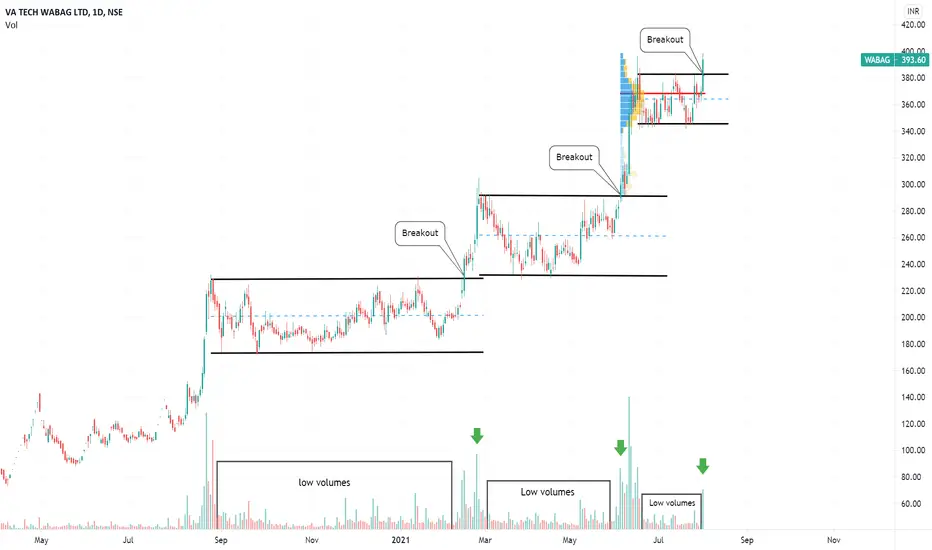
WABAG - Highest strength stockThere is a niche concept of consolidation and breakout going on at the moment.
Poised for an upmove from here!!
Keep SL as today's low.
FIRST TP triggered #BITCOIN+31.26% profit made as planned we might still go forward if a bullish candle close above yea so but for now we are still rejecting the main level so we wait for a break to ride the trend
Like share follow
Thanks for reading ✌️✌️
