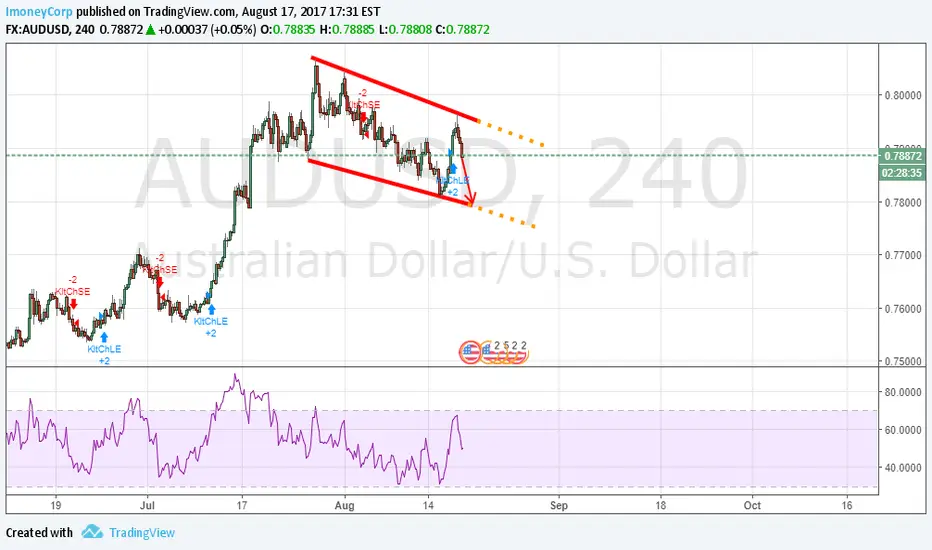
DASHUSD Day Traders' Paradise HereDashUSD
Last comment was waiting for a flag to develop and looking to
buy at 655 which wasn't great considering it spiked to 614.
There was no stop advised here as it's so spikey so if you kept
your nerve here, hats off. It was hairy.
That flag earlier on Dash, now lost in the noise, was a day
trader's paradise. This thing moves so far so fast and in such a
big range, 10% to 20% in every 24 hour period.
Now back towards the top iof its range and likely to unwind
between the top two parallels in near term. A good range for
day traders to play within. Take profits if still long and pick
up some more around 725
Traders
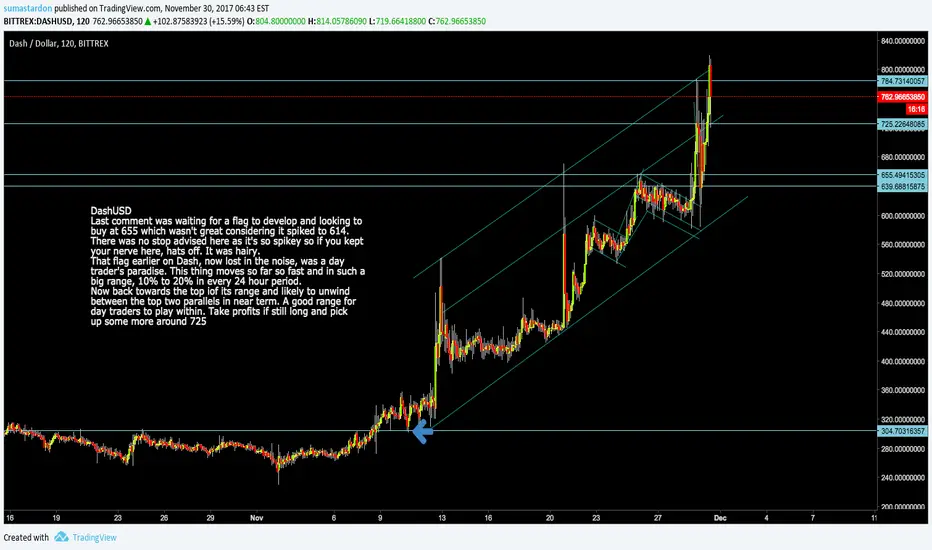
DOW JONES INDUSTRIALS: DOWI A Faithful Friend to TradersDow Jones Industrials: Easier than Nasdaq to Trade
It looks like a lazy continuation pattern is forming back to 22393 before a good rally sets in again. This pattern will only
change on any successful breach of either of the small parallels - to upside follow on successul break of upper
parallel for another test of the larger parallel above.And if the lower small lower parallel is sucessfully breached
on the downside it will seek support off the blue support line at 22995 - just much quicker than if it tracks within the flag.
The 22995 level is important to the medium term for the Dow. And we can see that the entire rally between the two blue
supports at 22995 and 22393 is, so far, uncontested. It would be easy pickings for bears should 22995 fail at any point.
It would fall quickly 600 points (a fabulous short if we see it at any point, worth setting an alert for) to 22393 at least and
quite likely to test the lower large parallel before the next rally could begin in earnest.
But until we see a break of those small parallels that form the flag top, this space belongs to day-traders. The 'perfect'
pattern will hold the flag fromation, zig-zagging down to 22995 on about 6th December before the great Christmas rally
kicks in. Only in the event that the two parallels that form the flag are broken in the interim will volumes pick up.
The three blue support lines then become the next obvious points to short from once broken.
MEDIUM TERM
The 22995 level is important to the medium term for the Dow.
And we can see that the entire rally between the two blue
supports at 22995 and 22393 is, so far, uncontested. It would
be easy pickings for the bears should 22995 fail at any point.
It would fall quickly 600 points (a fabulous short if we see it
at any point, worth setting an alert for) to 22393 at least and
quite likely to test the lower large parallel before the next
rally could begin in earnest.
But until we see a break of those small parallels that form the
flag top, this space belongs to day-traders.
LONG TERM
Long term, for what it's worth, this index should rally at least 4 X from the February 2106 low and quite easily 6 times. America has never had it so good since Ronald Reagan rode into the sunset. Happy thanksgiving to the USA. Long Term Cycle Analysis:
Dow and S&P 500: DOWI SPX500: Super-long-term Chart and analysis
LONG TERM
Over the longer term the Dow is still expected to rally at least 4 X and quite likely 6 x from the February 20016 low at 15513
over the coming 15 years.https://tradingview.sweetlogin.com/chart/DJI/t9MH9rbb-Dow-and-S-P-500-DOWI-SPX500-Super-long-term-Chart-and-analysis/
Last Point: One other thing, this market is one of the best to trade, making conventional patterns, especially in continuation mode - making it muuch easier to 'read' than, say Nasdaq. Look atthe patterns - they're friendly, familiar. Are Nasdaq's? Find a friend you can trust. That would be the Dow.
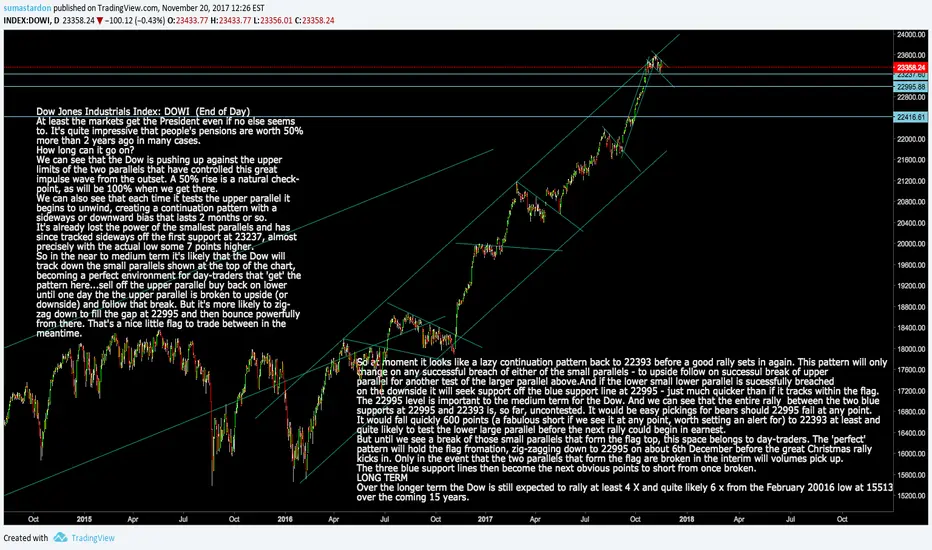
CRB Index: TRJEFFCRB Useful Back-up for Gold and Oil tradersCRB Index Commodities Index: TRJEFFCRB
The CRB index - Back-up Confirmation for Gold and Oil Trades.
It's useful to know which way the greater wind blows before
setting sail. This wind is with the bulls and has been off and
on since June. It's making a nice trend of its own, grinding
away each bear in its path until 195.62 is reached - up about
2.5% from here. Do not consider shorting gold, oil, silver or
copper aggressively until 195.62 is reached on this index, except
near term scalping raids which will carry wiith them all the
risks associated with trading against a trend. Even the deftest
of scalpers will need their A game to make much from
shorting, and will likely have to move fast to bag any profits.
Any bears with a medium term view are going to get crushed.
Can therefore only turn aggressively bearish of Oil once the lower
parallel channelling this impulse wave is broken on downside.
Then you know the greater wind is turning and it's finally time
to change tack and start selling rallies again.
This index has a look of latent strength behind it - 195.62 will
not hold it back for long. Once passed it will rally another 5
points or a firther 2.5% to 203.6. Then look for the wind to
change and at least a 2.5% fall back to 195.6 again. Get this
medium to longer term idea of push and pull and you can
make some very good returns. Good trading to the 3 wise men
who bother to read such arcane research. You will do well.
Never so sure about the rest though...
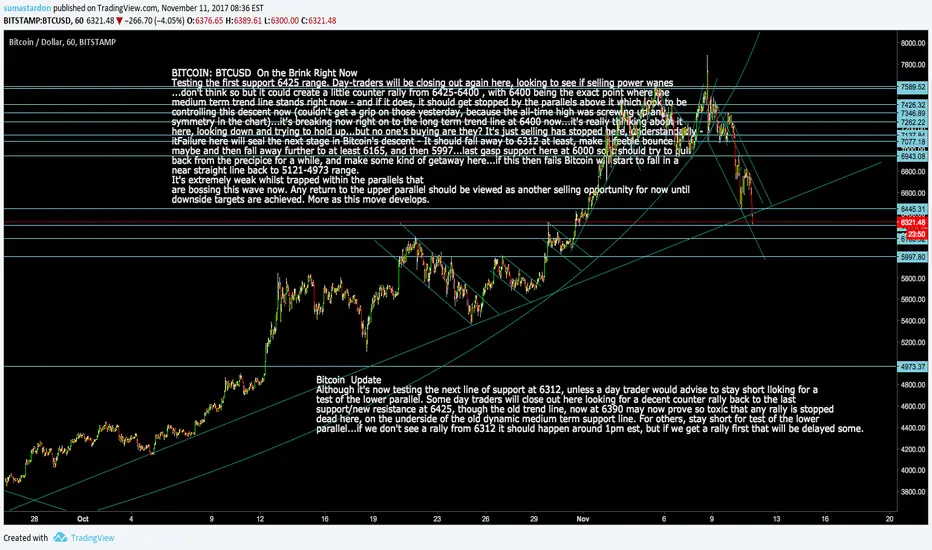
Bitcoin BTCUSD Next support approaches for day-tradersBitcoin Update
Although it's now testing the next line of support at 6312, unless a day trader would advise to stay short lloking for a
test of the lower parallel. Some day traders will close out here looking for a decent counter rally back to the last
support/new resistance at 6425, though the old trend line, now at 6390 may now prove so toxic that any rally is stopped
dead here, on the underside of the old dynamic medium term support line. For others, stay short for test of the lower
parallel...if we don't see a rally from 6312 it should happen around 1pm est, but if we get a rally first that will be delayed some.
If it does rally from 6312, others looking to short this who have missed part of the ride can look to get on at 6420 if seen.


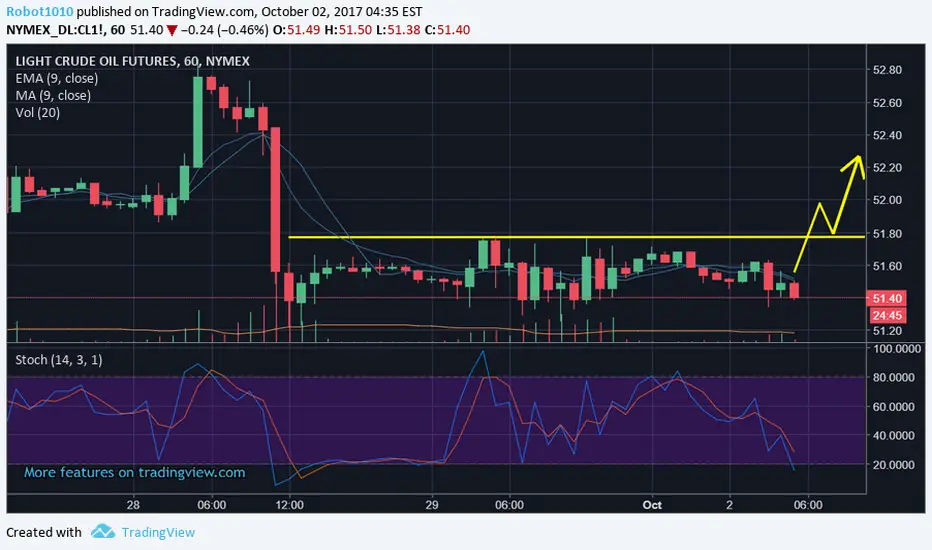
Crude Break Out Looking for a $51.60 break and retest opportunity
2 things here, either go long or GO HOME at $51.62
or wait for the retest of the the $51.65 or so and then
fire away longs
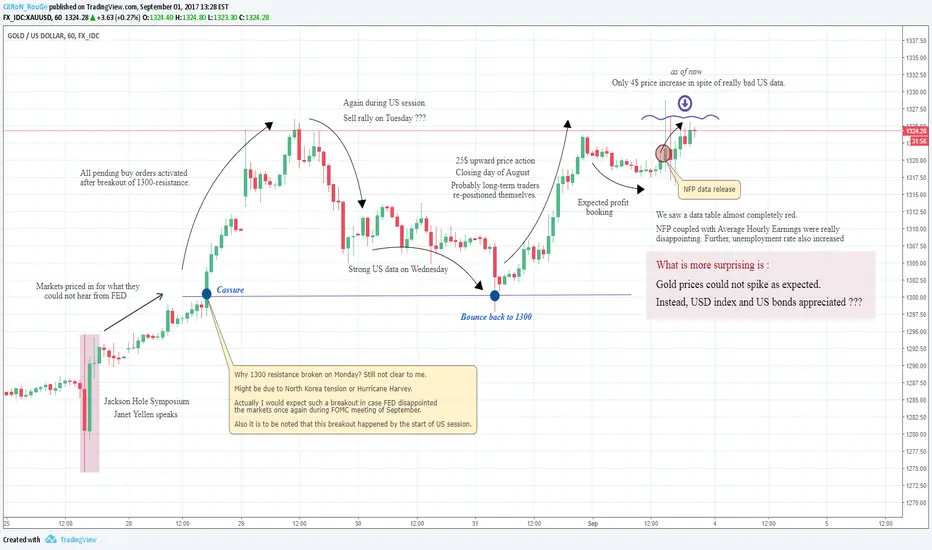
Gold price action this week. And next week ???Here I tried to recall the events affecting gold prices since 25th of August. What is surprising to me are "the breakout of 1300 psychological resistance" and "the unexpected price action of today".
Beginning of next week might be another surprise. Today US data was quite terrible, but USD index and and US bonds appreciated contrary to expectations. I figure out two reasons:
(1) Technically gold is over-bought and traders do not have appetite to buy further at this level.
(2) Yesterday was the last day of the month , we saw that the price of gold increased 25$ in a very short time. If this is due to the long positioning of commercial traders, then we might say that the speculative traders driving the market have taken short positions for the month of September. And if so, this explains that the big traders with short positions did not buy today but instead continued to sell, which would mean a major retracement of prices or a new downward rally is on the way. We will see this in the CoT report to be published Friday next week.
I still can not find a driving reason for the breakout of 1300 level suddenly on Monday???
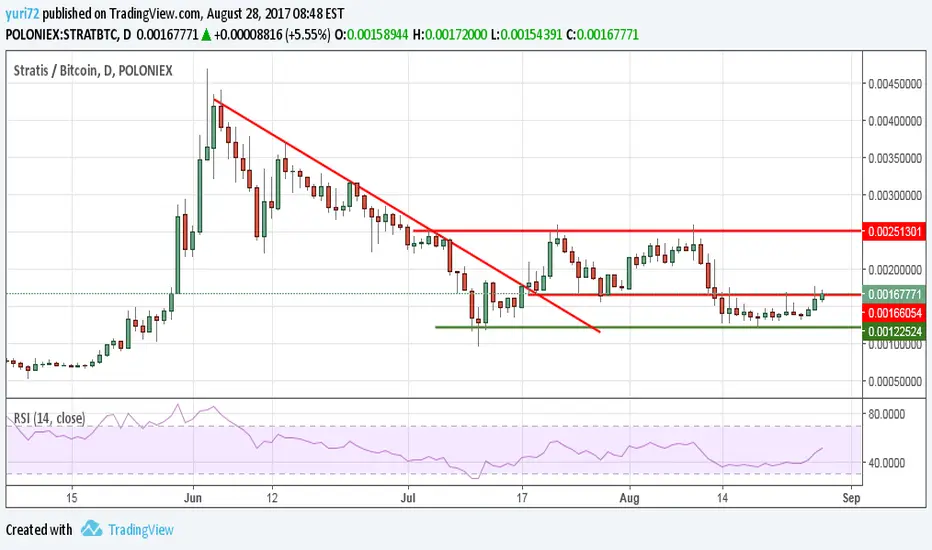
Stratis crossroads within rectangular pricemovementSix weeks ago Stratis broke a downward resistance line only to get caught in horizontal price movement. Current boundaries are around 0.001225 at the bottom and 0.0025 at the top. Still a very nice playingfield for traders! Currently Stratis price is at a resistanceline within this rectangular box (around 0.00166). A break of this intermediate line would see Stratis move up towards the upper horizontal line, otherwise the bottem of the rectangular box looms again!
Be aware there are buzzes of news coming out for Stratis in the near future.. this might be the reason behind the last 3 green candles.. No way of knowing how the possible news will play out: break or disappointment.. be careful!
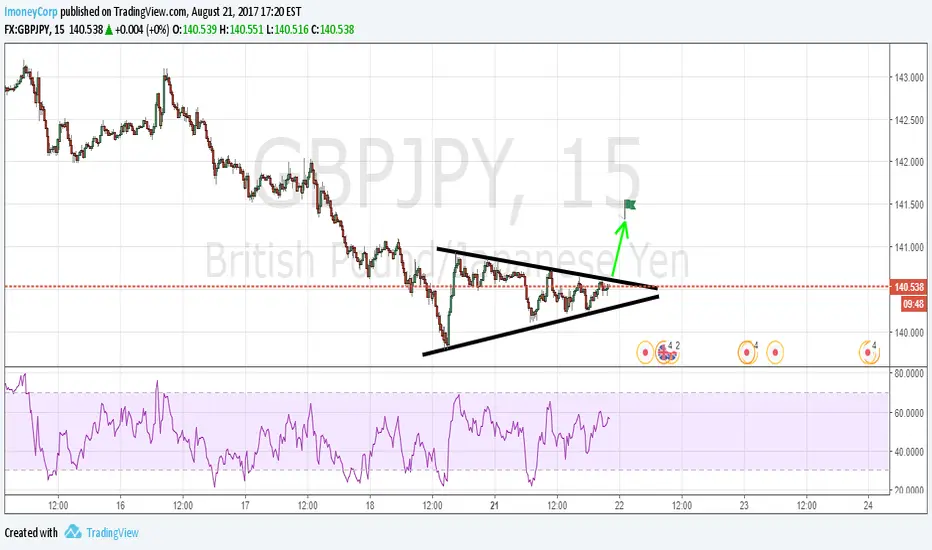
TRIANGLE ON THE GREAT BRITAIN Vs US DOLLAR SETUP FOR LONGTRIANGLE ON THE GBPUSD pair identified at 22-Aug-0630. A good setup for going long. This pattern is still in the process of forming. Possible bullish price movement towards the resistance 141.29 within the next 14 hours.
Supported by RSI above 50%
Remember use good risk management.
Avoid greed at all costs.
NB: iMoneyCorp ideas are merely presentations of his analysis of the markets and not presentation of any actual position of the market at the present time. Copy them at your volition. Your capital is at risk.
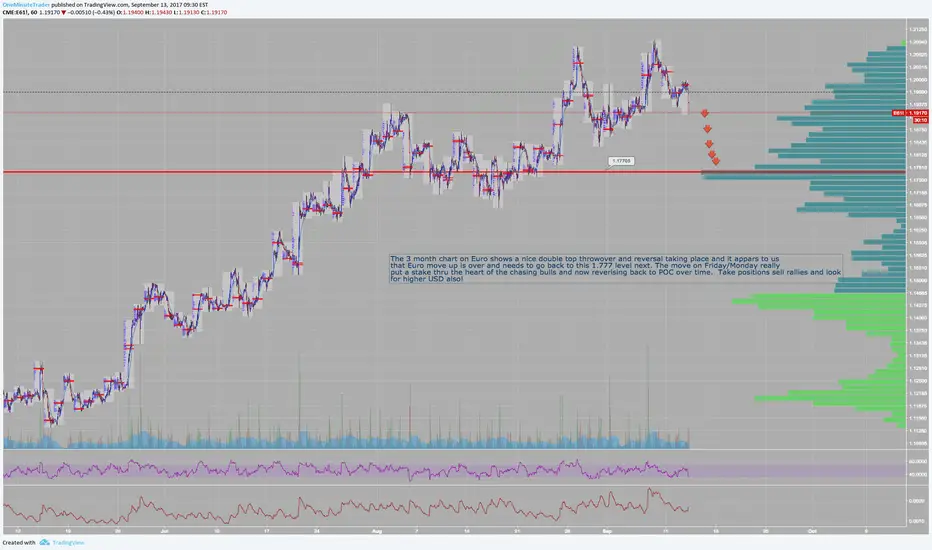
BREAKOUT ON EURO Vs US DOLLAR 240A breakout is happening on the EURUSD pair and expected to reach the 1.1922 level. Check it out and see if it is a setup you may want to be a part of.
Remember in trading only one thing matters, good risk management. That is it.
Trade wisely and watch yourself rise to the top. This can be day one or one day situation. You decide.
NB: iMoneyCorp ideas are merely presentations of his analysis of the markets and not presentation of any actual position of the market at the present time. Copy them at your volition. Your capital is at risk.

CHANNEL DOWN USDJPY FOR SHORTING OPPORTUNITYChannel down emerging on the USDJPY pair. Expected to reach 180.340 level. Check it out see if it interests you.
Remember good risk management cannot be ignored at any point.
Trade wisely.
Only you can move your destiny forward. One day or day one! You decide.
NB: iMoneyCorp ideas are merely presentations of his analysis of the markets and not presentation of any actual position of the market at the present time. Copy them at your volition. Your capital is at risk.

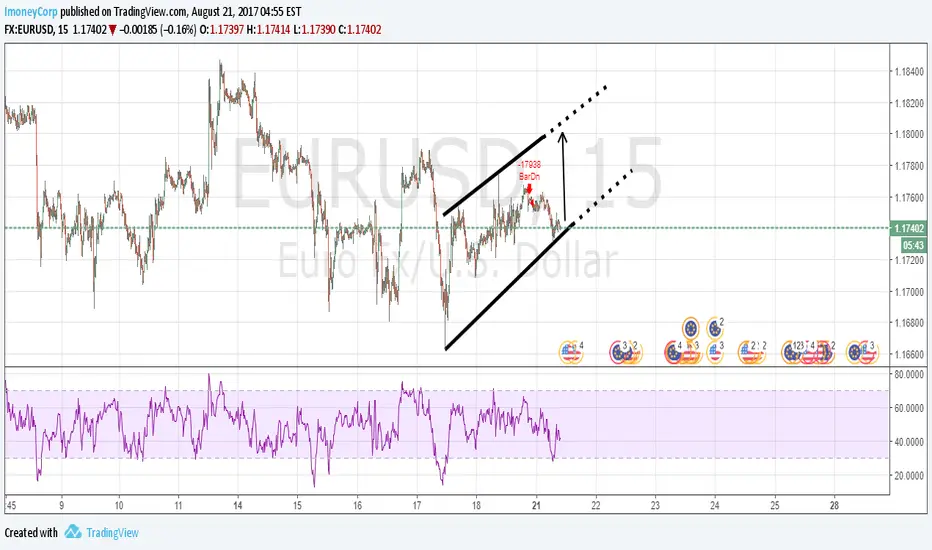
CHANNEL UP EURO Vs. US DOLLAR 15A channel is emerging on EURUSD 15 for a long trade opportunity with a target of 1.181; check it out and see if it interests you.
Remember to use good risk management.
Nobody ever did it big unless it was too risky to do it.
Good luck.
NB: iMoneyCorp ideas are merely presentations of his analysis of the markets and not presentation of any actual position of the market at the present time. Copy them at your volition. Your capital is at risk.
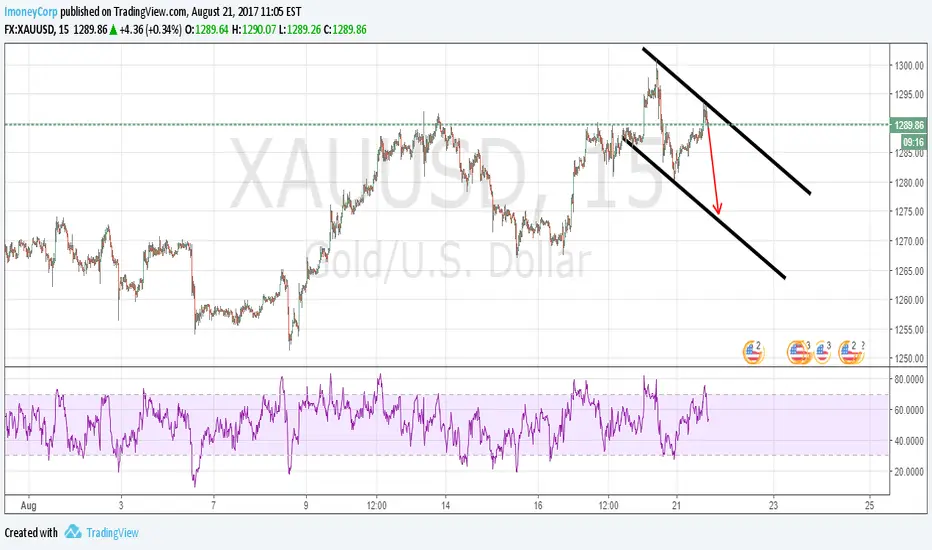
FALLING CHANNEL GOLD SPOT 15A falling channel on gold spot 15 is emerging. It is my strong believe that we will see levels of 1274 reached. I have entered a short position at this point in time with a take home profit of 1274.
Check it out see if it interests you.
Remember good risk management is key.
Keep your eyes on the stars and your feet on the ground. You can reach for your dreams without having to fall.
NB: iMoneyCorp ideas are merely presentations of his analysis of the markets and not presentation of any actual position of the market at the present time. Copy them at your volition. Your capital is at risk.
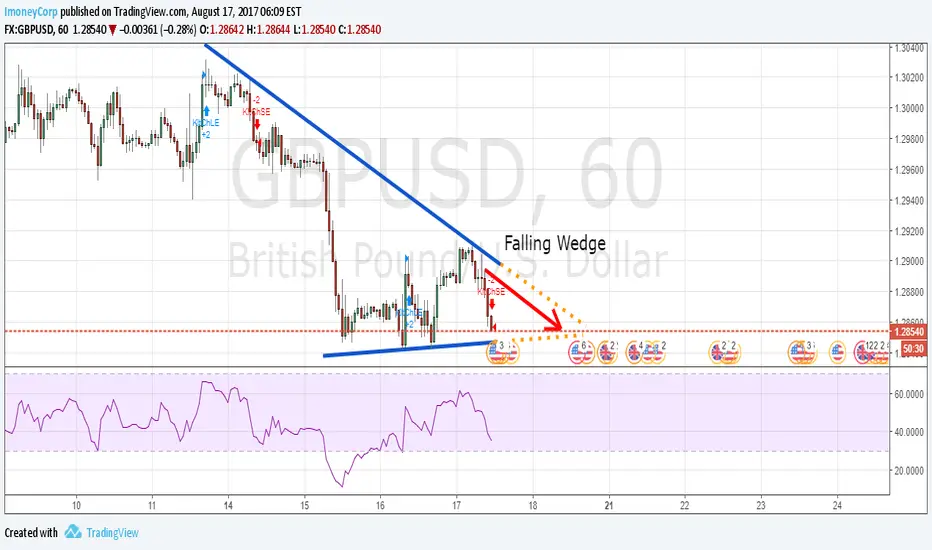
FALLING WEDGE US DOLLAR Vs. CANADIAN DOLLAR 15A falling wedge is emerging in the USDCAD pair. My only target for profit would be 1.24 Check it out and see what's up.
Remember to use good risk management.
It is only a matter of time before you understand the key to your destiny was always in your hands.
NB: iMoneyCorp ideas are merely presentations of his analysis of the markets and not presentation of any actual position of the market at the present time. Copy them at your volition. Your capital is at risk.

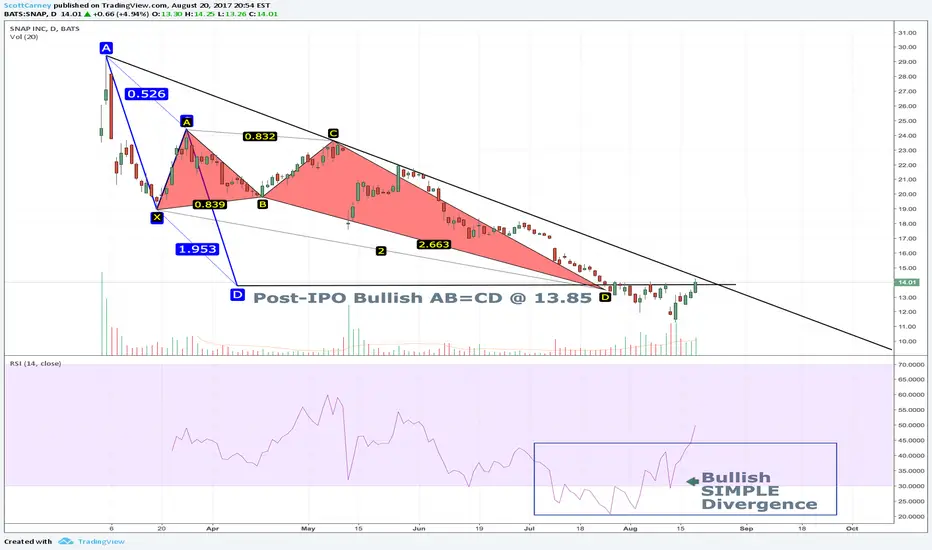
SNAP or CoverSNAP has hit the BIG AB=CD target @ 13.85, exceeded the harmonic support zone a bit much and is now back at the pattern completion point.
GOOD NEWS = Clear Simple Bullish Divergence is supporting the pattern zone.
BAD NEWS = Time is up. The tolerance of further consolidation should now be limited, as the entire scenario has been "vetted".
Any long positions must realize some immediate progress above $15 for this still to be a worthy opportunity.
Tighten stops, manage aggressively and demand follow through or we will scratch this out @ b/e for a later entry.
UPRISING CHANNEL SETUP FOR LONG USDCAD SHORT-TERMLong: @ Current point; 1.24828, TP: 1.31702, ST: 1.23613
There is an upward channel forming on H4 of the USDCAD pair. My take is I will be looking to go long short term and looking to take profit at the identified point above.
Check it out see if it is a setup you might be interested in.
Remember to use good risk management. Avoid exposing your account and treat the markets as your investment ground. All rules apply. Good management of time, risk and money is the key to winning. Avoid greed at all cost.

CHANNEL DOWN in EURJPY @ 15 MinutesThere is a channel down in EURJPY forming @ 15 minutes. Check it out and see if it interests you.
Remember use good risk management. And avoid greed at all times and at all costs.
You may last longer. Remember it is not that you are not good at this, it only that you need to be better at risk management. That's all.
Good luck.
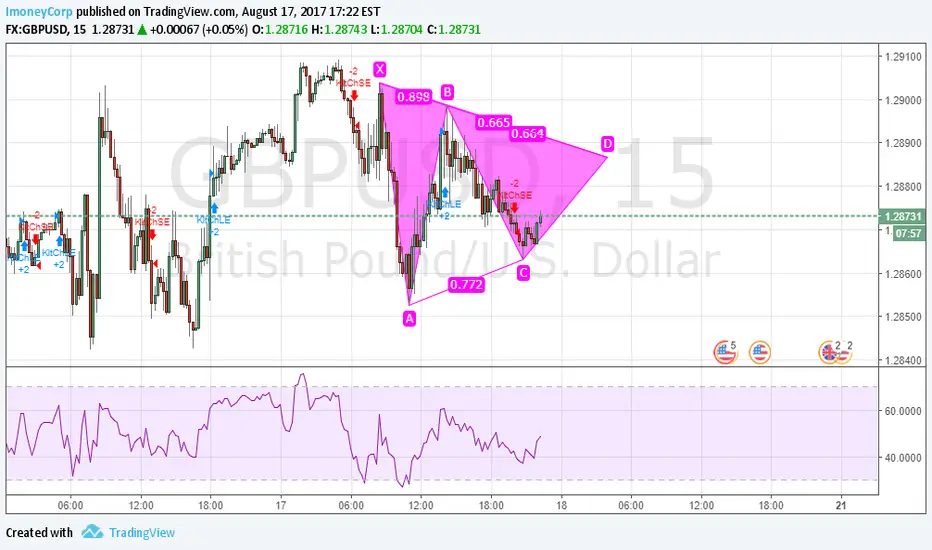
BUTTERFLY IN GBPUSD To Go LongCheck out the butterfly pattern in GBPUSD pair with an expected 1.28 to 1.29 reach. See if it is a setup you maybe interested in.
Remember to use good risk management and have confidence in yourself.
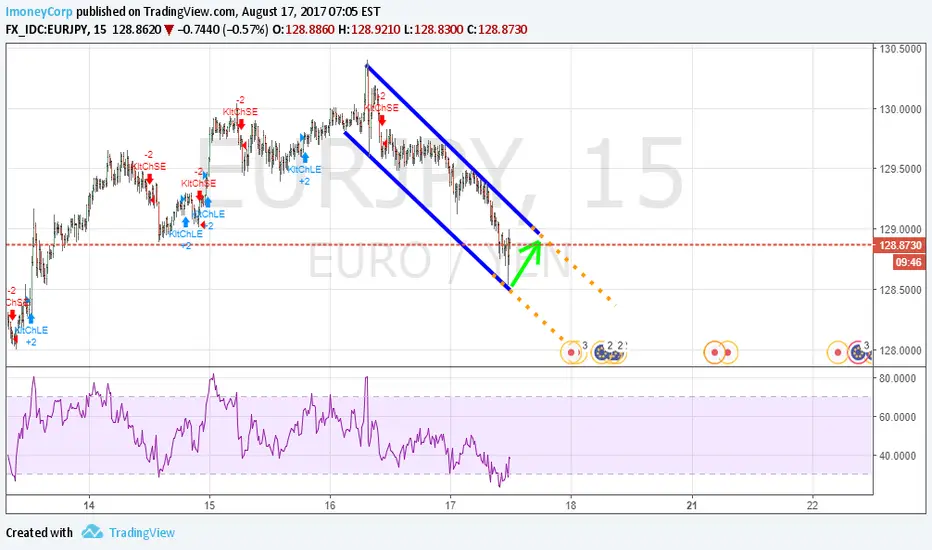
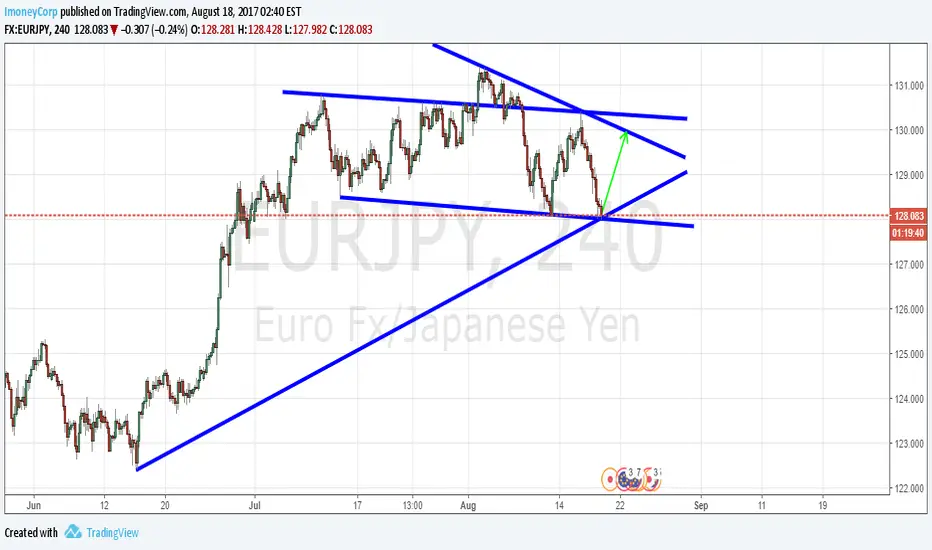
EURJPY FALLING WEDGE INSIDE A BEARISH CHANNEL EMERGINGTake a look at EURJPY pair; there is a converging wedge for a chance to go long short-term up to 128.839 but the wedge is inside a bearish channel emerging. So that is another opportunity to go bearish long-term. Check it out for simple trade setup and see if it is a trade idea that might interest you.
As always remember to have good risk management and plan your entry and exit in a calculated manner. It is the wise traders that make a living out of trading not wishers of luck.
All the best.
CHANNEL DOWN AUDUSDCheck out the Channel Down in AUDUSD and watch out for the setup that is formulating towards the .775 level.
Remember as I always say, use good risk management, point out the best entry point and the best exist point. Always follow the trend.
Good luck.