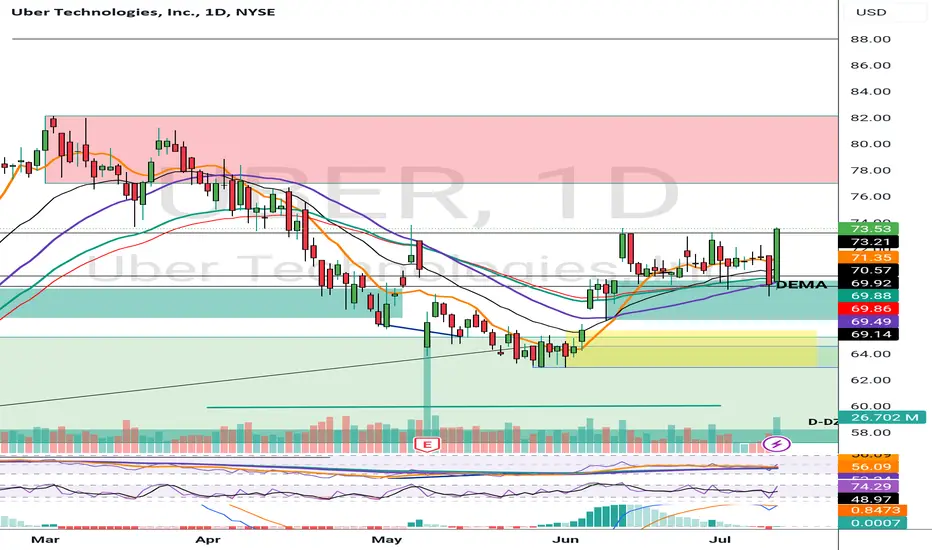
Uber looking bullish July 11 2024Uber is looking bullish and can do 80+ as there is nothing to stop price at the top.
Traders
Why BTC is bullish yet !!Im bullish on btc cause of 3 reasons in terms of fundamental vision :
1- fear of MT.gox repayment is over the truth (FUD)
becoase :
a) reapments will be gradual
b) BTCs will be repay by several CEXs (pervent from drop)
c) creditors wont sell btc at once cause of tax
2- capitulation of miners were done! : according to onchain data
3- selling by Germany GOV is related to order of the court , not for Getting profit .
dont sell your crypto !

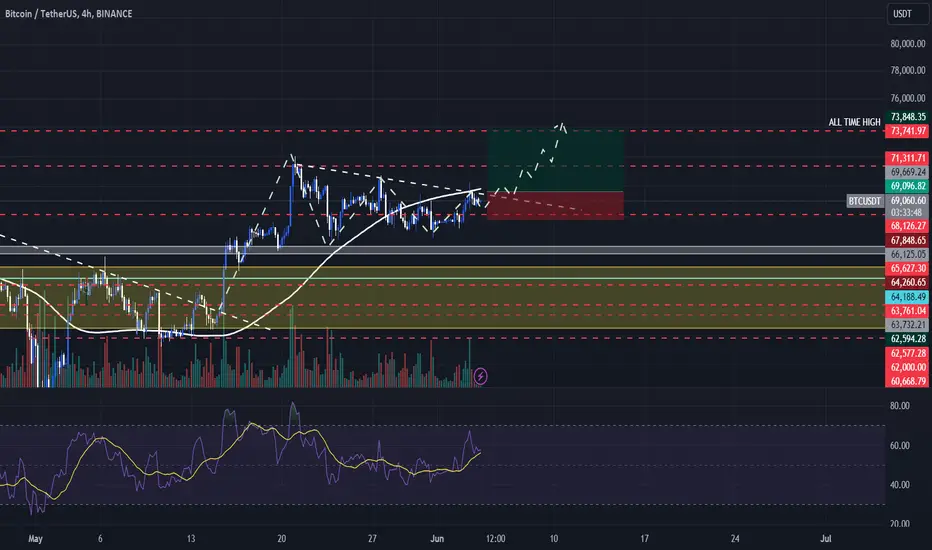
BTC/USDTthe orenge base is weak and breakable!
but i think 2 blow zone are great for getting confirmation to upside!
lets see guys !
NFA-DYOR

Gold Market Analysis and Sell Signal Report
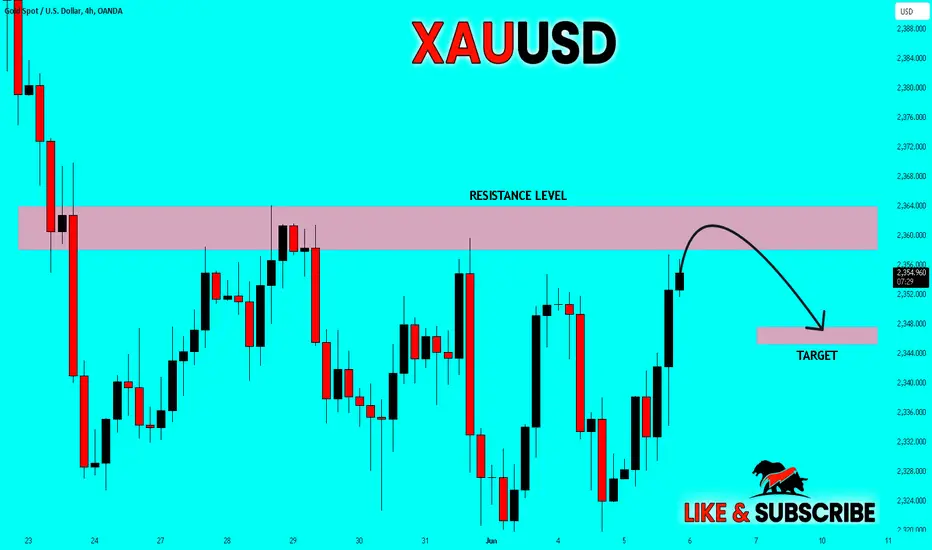
Current Resistance Level
Gold (XAU/USD) has recently encountered resistance at the 2361.00 level. This resistance has been tested multiple times, suggesting potential downward movement if it holds.
Technical Analysis Overview
- **Resistance Level:** 2361.00
- **Support Levels:** Key support levels to watch include 2356.00, 2351.00, and 2346.00.
- **Trend Analysis:** The trend shows potential bearish signals if gold fails to break above the 2361.00 resistance level.
Sell Signal Details
- * *Entry Price:** 2361.00
- **Take Profit Levels:**
- **T1:** 2356.00 (50 pips)
- **T2:** 2351.00 (100 pips)
- **T3:** 2346.00 (150 pips)
- **Stop Loss:** 2371.00 (100 pips)
#### Market Sentiment
Investors are advised to consider the strong resistance at 2361.00 as a potential point for initiating sell positions. With the entry point at 2361.00, the outlined take profit levels provide a structured approach to maximizing gains while minimizing risks.
Risk Management
It is crucial to adhere to the stop loss at 2371.00 to protect against potential upside risks. This strategy ensures that losses are limited, while the potential for profit remains high given the strong resistance level.
Investors FAQ: Providing the Best Analytics
Investors FAQ is committed to providing top-tier analytics and signals for forex trading. Our comprehensive market analysis and carefully curated signals are designed to help traders make informed decisions and maximize their trading potential.
Risk Disclaimer
Trading in forex and commodities carries a high level of risk and may not be suitable for all investors. The high degree of leverage can work against you as well as for you. Before deciding to invest in forex or commodities, you should carefully consider your investment objectives, level of experience, and risk appetite. There is a possibility that you could sustain a loss of some or all of your initial investment and therefore you should not invest money that you cannot afford to lose. You should be aware of all the risks associated with forex and commodity trading and seek advice from an independent financial advisor if you have any doubts.
---
#GoldAnalysis #ForexTrading #SellSignal #MarketAnalysis #InvestorsFAQ #TradingSignals #RiskManagement #TechnicalAnalysis #Forex #Commodities
Please ensure you adapt your trading strategy according to your risk tolerance and market conditions. Happy trading!

BAKE Prints Bullish Crossover — 36% Potential + Solid Backtest RBakeryToken flashed a bullish MACD crossover on the daily chart.
Based on backtests, the signal provides a solid win rate of more than 90% for 2% and 5% gains. Even for 10% gains, the win rate is more than 82%.
Additionally, the trend indicators are entirely bullish across all timeframes. Momentum indicators are neutral, which further backs the bullish setup.
Summarized, indicators signal a super interesting scenario for an entry.

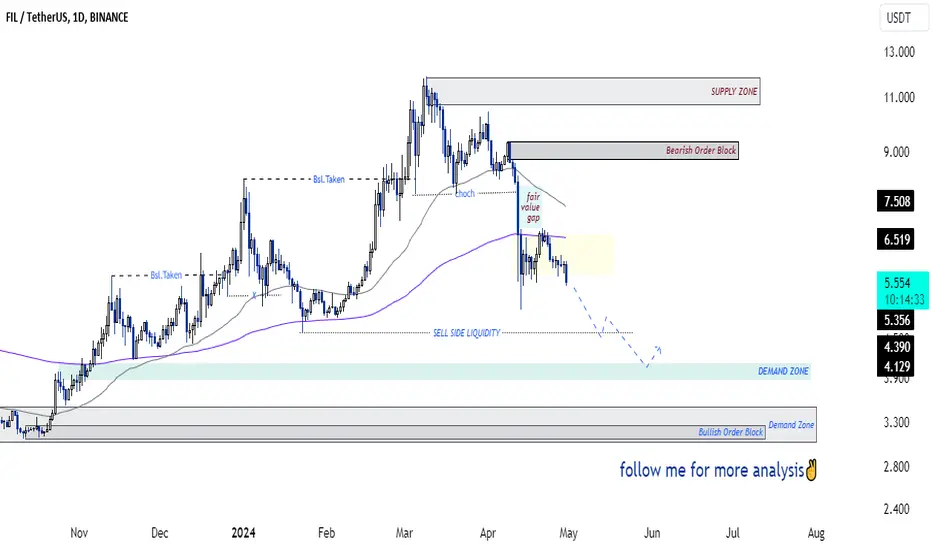
SasanSeifi 💁♂ Daily Analysis with Key Support Zones🔻 Hey there, Let's take a look at the daily timeframe of BINANCE:FILUSDT .
As you can see, the price has been on a downtrend since the $11 zone. Currently, after some minor fluctuations, it has been rejected from the 200 EMA and is trading around $5.50. The price is more likely to move downwards. If it consolidates below $5.35, we can expect a further correction toward the SELL SIDE LIQUIDITY and the $4 demand zone.
Key support levels are $4 and $3.50. There is a higher probability of a positive reaction from the $4 demand zone. In case of a correction, we need to see how the price reacts.
The potential trend is also highlighted in the chart above. Additionally, if the $4 zone breaks down, the $3.50 correction target can be considered.
Remember, this is just my personal analysis, not financial advice. Do your own research and make informed decisions.
Happy trading!✌😎
Sure, if you have any more questions or need further clarification, feel free to ask. I'm here to help!✌
if you found my analysis helpful, I would appreciate it if you could show your support by liking and commenting. Thank you!🙌
Possible Retest for WTI Crude Oil.WTI Crude Oil has been in a consolidation Phase since the beginning of the month. After breaking out of it recently, I expect the price to go up the decision Point Zone and to then drop.
Lets see if this trade works out.
TVC:USOIL

GOLD POTENTIAL SHORT|
✅GOLD will soon retest a key resistance level of 2363$
So I think that the price will make a pullback
And go down to retest the demand level below at 2347$
SHORT🔥
✅Like and subscribe to never miss a new idea!✅
GBPJPY TRADEThe market forms a double top , I already took that trade to the down side gaining 2000 $ and now i'm entering on another trade to the downside aiming for 2.51 to 1 RR , SL at 198.953 and TP at 197.454

BTCUSDT TRADE I'm very bullish on BTC , as we see we are on an uptrend , so we are looking to buy BTC , i'm waiting to take a buy position when the trendline is broken and I'm gonna aim for the 73998.06 and stoploss is gonna be in the 67902.47 . i'm not sure about the Stoploss area because i haven't seen the price breaks the trendline yet.
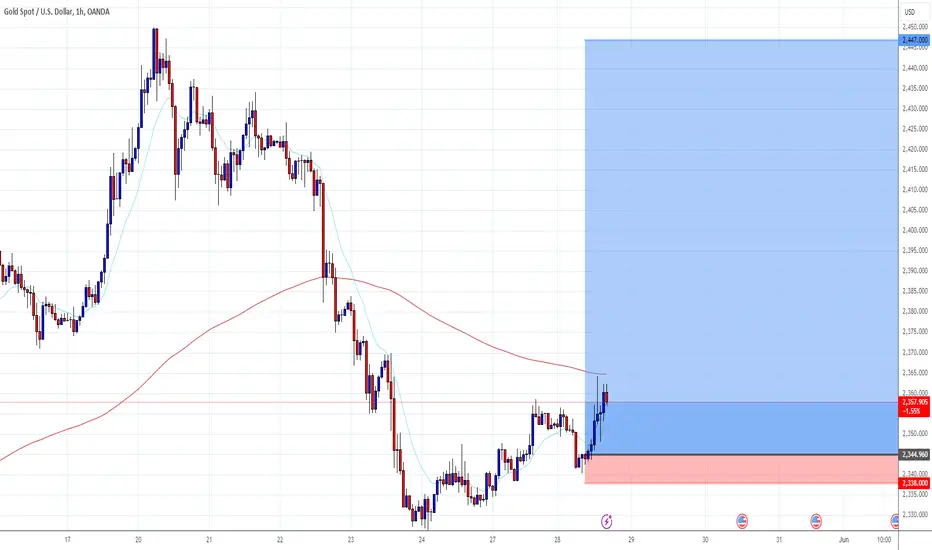
XAUUSD LONGSeing Great Long idea on XAUUSD after nice drop which gives us quite nice entry price with a good Risk Reward
HSBC "Amazing Opportunity"After the UK CPI came hotter than expected, short positions are shining on the horizon. The UK100(FTSE) index looks over-extended to the bullish side, but better than shorting the index itself is finding a highly correlated with the index position, which in our case is HSBC.
As you can see the periods in the past are marked with verticals, whenever the index corrects HSBC follows. Currently, the level at which the stock price is sitting is at a weekly resistance zone.
Most traders who are only attracted to the risk-to-reward ratio would most likely skip such an amazing opportunity. Here comes the options. I am not going to short the stock itself but rather buy put options. To be even more specific I am buying puts at 44$ which costs 0.50$ for the 21st of June.
Long story short with 3000$ dollars you can buy 60 puts.
At 40$ your puts will be worth ~12,000$ or slightly more due to the premium.
You may say But what if it goes up and I lose my 3K, but that's not the case here.
The moment I am buying the puts I am buying 1000 shares long.
At 43$ my stock shares will be exactly 3K$ profit so my initial investment is fully covered on top of that I can still sell my put options even though they will be worth around 0.10$ but still possibly +600$.
To keep it simple:
At 40$ your 60puts will be worth 12,000$.
12,000$- 3,000$(cost of puts) - 1000shares*-4.30(4300) so we will have net profit of +4,700$
The potential win versus the initial investment may seem as unfavourable but keep in mind we are making an arbitrage trade here and the chance of losing capital is close to zero.
The ATR (Average True Range), which represents the average movement of an instrument for HSBC is 1.65$ on a weekly basis. This means that the 5 weeks we have until the strike of the option we can easily expect 4-5$ to move in either direction.
On top of that, we have NVIDIA reporting Q1 aftermarket, which will set the tone for the markets for the rest of the week.
Every comment gets answered:)
Before you jump on this financial rollercoaster, remember: past performance is like your ex's mixtape—nostalgic but not always relevant! 🎢💸 Always consult with a financial advisor before you trade your lunch money for stock options.

xauusd recent update
In our previous analysis quoted above we have referred 2407 area as the area of retracement as there is strong support in that zone. and as we predicted the same happened the market retraced from than zone and again hit back the zone creating a DOUBLE BOTTOM and again goin up to nearby resistance zone.
support and pivot 2407-2405
if this area is not breached then market will fly back to 2445 zone.
bullish targets : 2415
2421
2433
2445
bearish targets : 2401
2397
2391
2382
2376
follow us share us and like us
happy trading❤️

EURUSDDaily Euro Time Frame Analysis
Euro is likely to have a percentage correction from this range and then continue its upward trend.

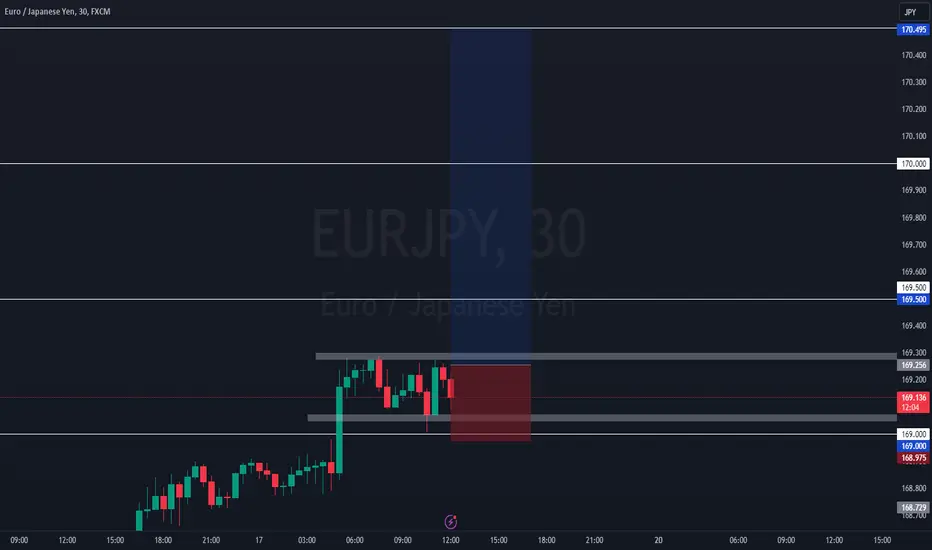
ENTRY SIGNAL: BUY EURJPY Conditions:
1. Break and closure above current 30 mins high (169.227)
2. Price remains inside 169.291-169.064 range (fakeout to the bearish side would be a deal sweetener)
ENTRY above 169.227
SL 168.975
TP 170.495
Warning:
1. trading derivative could result to loss of your capital, kindly apply caution and use only the money you can afford to lose.
2. Previous performance is not a guarantee that my signals will profit you. Accept and implement this idea at your own risk.
3. You are advised to apply proper risk management while trading derivatives...!!!
BR,
Kings
Learn how to trade. See my signature below or visit my profile for more details
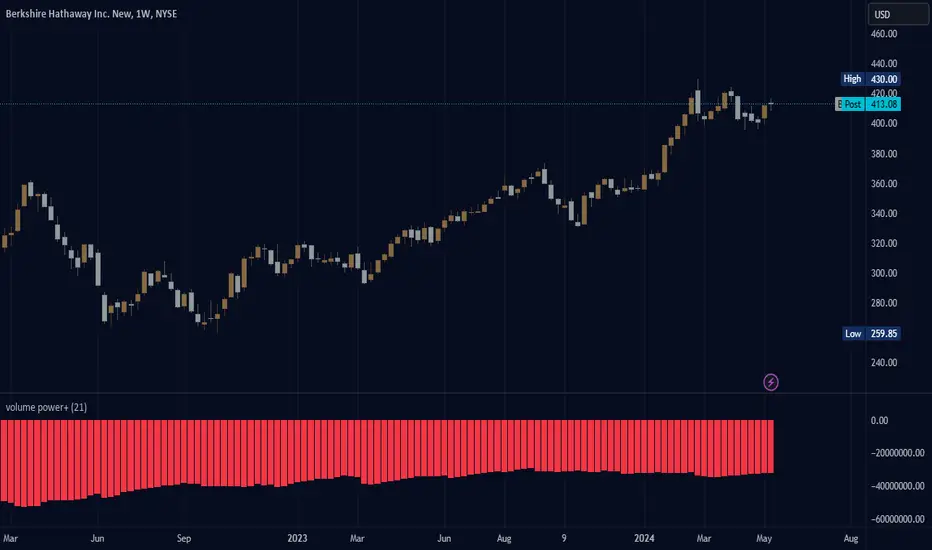
BRK.B "always bearish" Based on a bull baer power indicator of "push/pull" type; after I edited the dimensions of the indicator for volume instead of moving average I found BRK.B new to always be Bearish. Unlike BRK.B NEW, the BTC indicator had bearishness many years ago and since is Bullish. Too bad I can't overlay to different charts to show each individual indicator representing each in the same image; if only. It appears people are always trying to defeat Berkshire Hathaway with volume. Unless the edits I made to the indicator represent nothing. Sometimes a nothing indicator an imagined concept reveals as much information as if it was real.
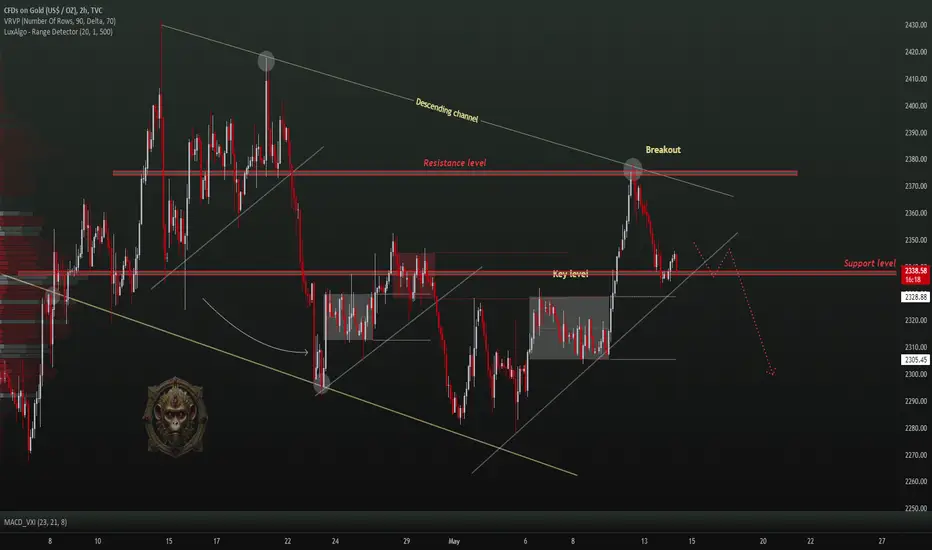
GOLD → Trade Analysis | SELL SetupI have two options here; bullish continuation from here or bearish break.. more chances on continuation! Hello Traders, here is the full analysis.
I think we can soon see more fall from this range! GOOD LUCK! Great SELL opportunity GOLD
I still did my best and this is the most likely count for me at the moment.
Support the idea with like and follow my profile TO SEE MORE.
Traders, if you liked this idea or if you have your own opinion about it, write in the comments. I will be glad 🤝
Patience is the If You Have Any Question, Feel Free To Ask 🤗
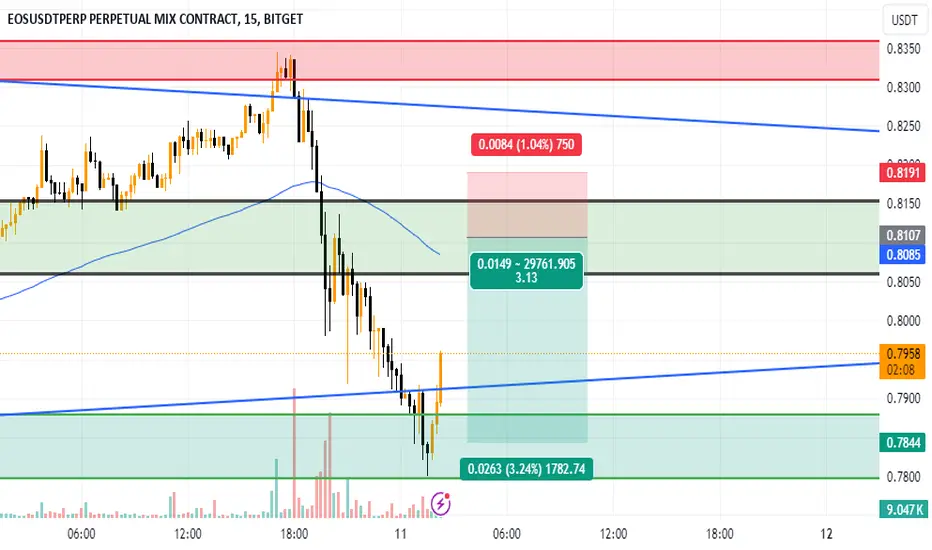
sell trade coming in EOS USDTstoploss 0.8250
entry 0.8112
take profit 0.7918
trail your stop loss to entry
enjoy the signal
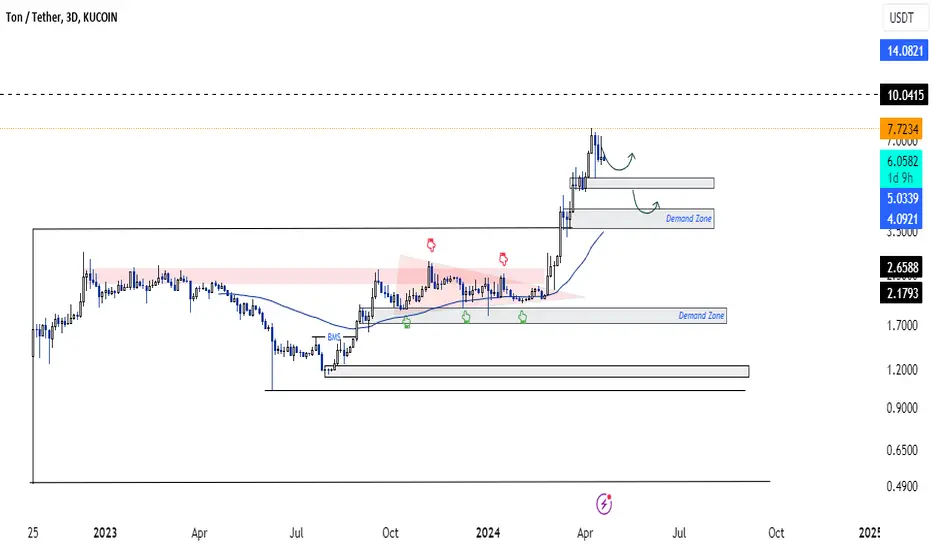
SasanSeifi 💁♂ TONCOIN -$10 /$14 ❗❓🤔Hey there,✌
Toncoin ( KUCOIN:TONUSDT ) has demonstrated a remarkable upward trend, surging over 250% after breaking through the $2.50 resistance zone. While the price has encountered resistance at the $7.50 level and is currently trading around $6.00, key support levels at $5.00 and $4.00 could present attractive entry points for long-term investors in the event of a price correction.
From a long-term perspective, TON has the potential to continue its upward trajectory, aiming for the $10.00 and $14.00 resistance zones. However, it is essential to observe how the price reacts to these support levels during any potential correction to understand the continuation of the price trend better.
Remember, this analysis is based on technical indicators and price movements and should not be considered financial advice. Conduct thorough research and due diligence before making any investment decisions.
Sure, if you have any more questions or need further clarification, feel free to ask. I'm here to help!✌
if you found my analysis helpful, I would appreciate it if you could show your support by liking and commenting. Thank you!🙌
GBP/USD Trade SetupGBP/USD has formed a symmetrical triangle pattern on the 30-minute timeframe, and a breakout has already occurred.
We are currently waiting for a retest to enter a SELL position, based on candlestick confirmation patterns at the retest level.

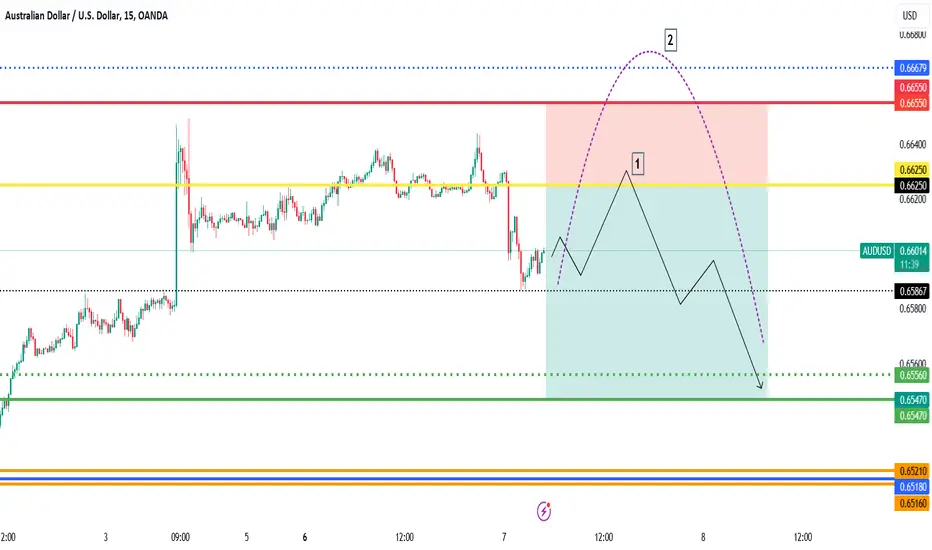
"AUDUSD 15 MIN"📍 In the EURUSD currency pair, we can pursue a sell trade with a predetermined stop-loss and take-profit. 🔻✌️
The second movement scenario is also identified by aggregating different sell orders in a higher timeframe. 📉📈
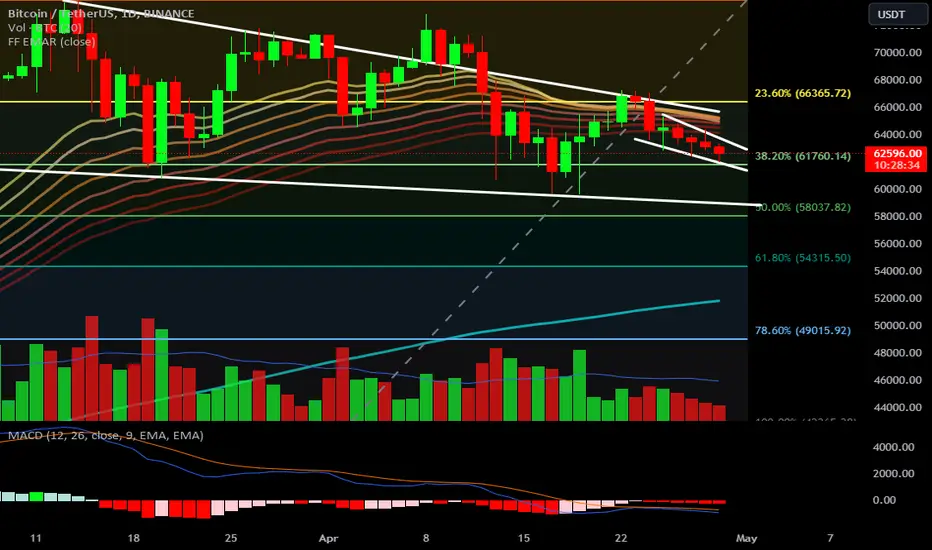
Bitcoin Market Analysis Post-Halving
After seven weeks of bearish sentiment, the Bitcoin market looks significantly different from the bullish euphoria experienced during the climb from $42,000 to $73,800. Now, with less than 48 hours left in the monthly candle, we stand at a critical juncture that could define Bitcoin's trajectory for May.
The Moving Average Convergence Divergence (MACD) indicator, commonly used to identify market direction, has entered what is known as the "red valley." This signaling suggests that we may be entering a more prolonged bearish period than initially anticipated by many analysts and crypto enthusiasts.
Currently, the BTC/USDT pair is trading around $65,500, facing significant challenges on shorter timeframes to generate the liquidity needed to break through key resistance levels. This stagnation below all-time highs could be interpreted as price consolidation before a potential significant move.
Investors and traders should closely monitor candle closes on higher timeframes and market reactions to crucial resistance levels. Patience and technical analysis will be essential tools for navigating the turbulent waters of the post-halving Bitcoin market.
THIS IS NOT A FINANCIAL ADVICE
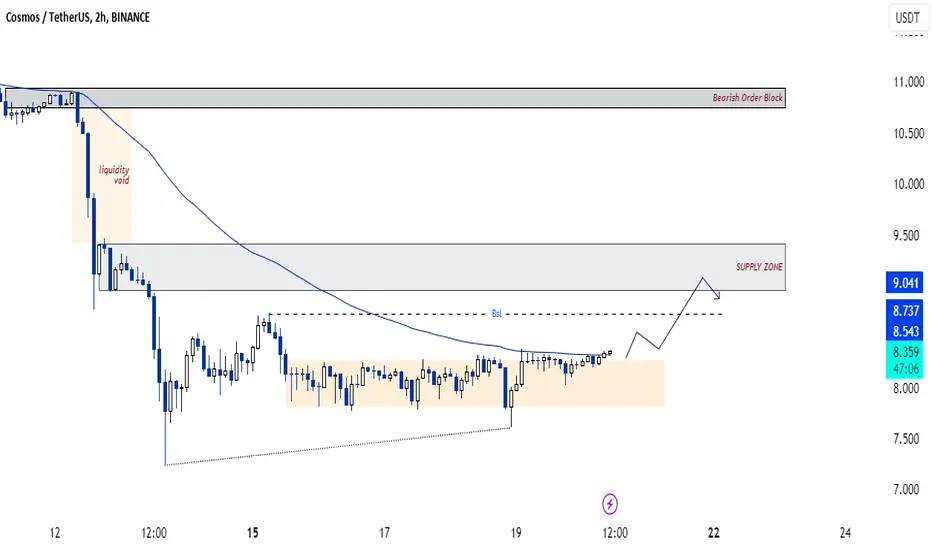
SasanSeifi 💁♂Short-Term Price Movement in 2-Hour ChartBINANCE:ATOMUSDT As observed in the 2-hour timeframe, the price is currently trading and ranging within the $8.37 price area after minor fluctuations. The price is crossing above the EMA60.
Short-term Scenario (2 hours):
If the price consolidates above the EMA60, a potential short-term scenario could be for the price to move towards the $8.50 - $8.70 zone with minor positive fluctuations, followed by a minor pullback and another upward movement towards the $9 supply target zone. To better understand the continuation of the price trend, observing how the price reacts to the supply zone is crucial. The potential short-term trend is also illustrated in the above chart.
This is not financial advice. Always do your research before making any investment decisions.
Sure, if you have any more questions or need further clarification, feel free to ask. I'm here to help!✌
if you found my analysis helpful, I would appreciate it if you could show your support by liking and commenting. Thank you!🙌