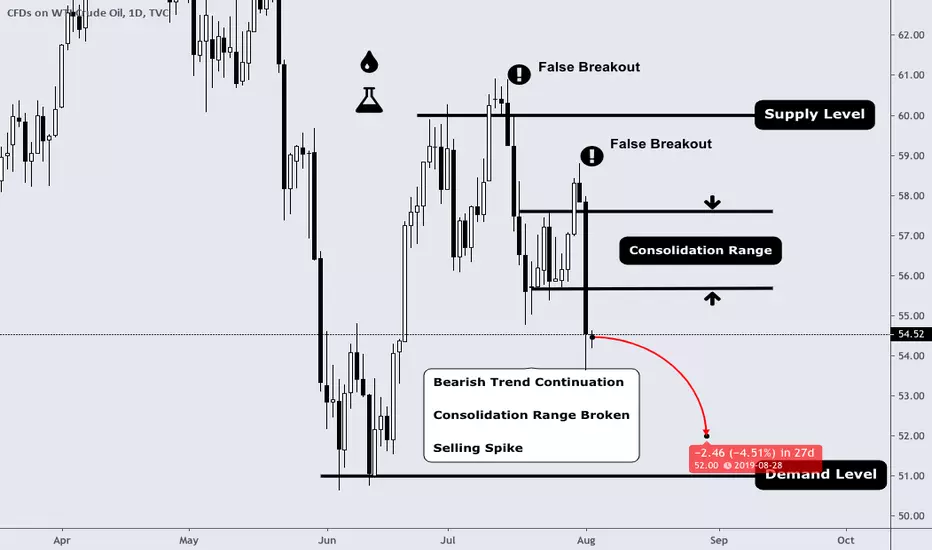
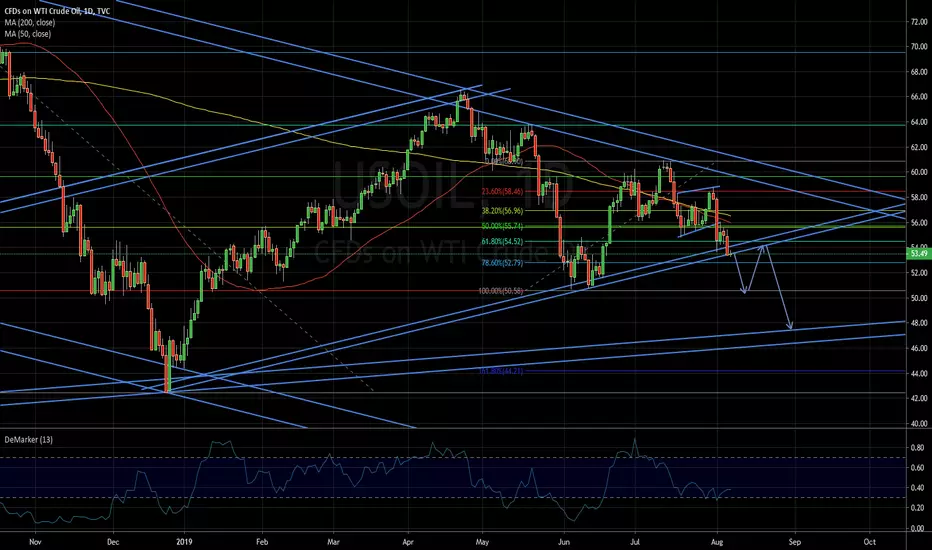
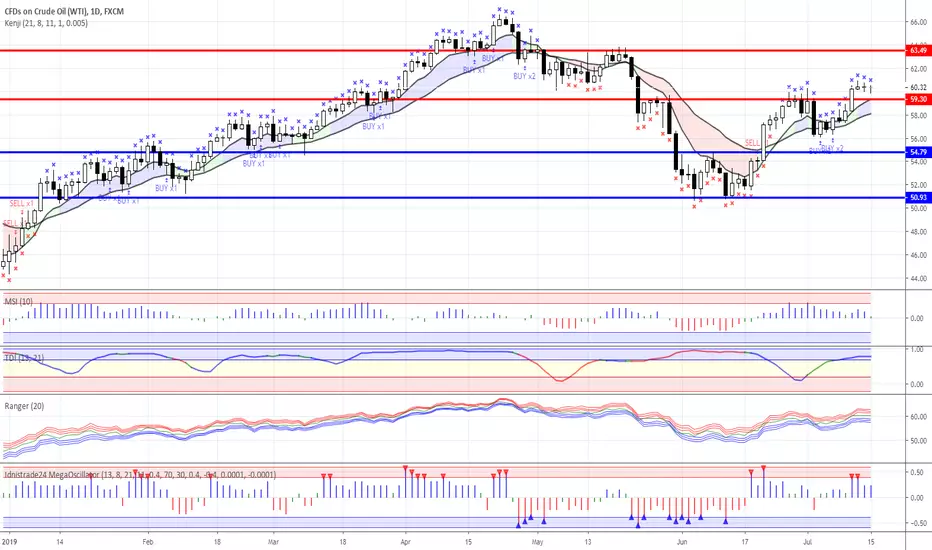
Overall view of WTI Crude Oil - Midterm AnalysisFundamental View: Oil prices fell almost 7% on Thursday, the most this year, as President Donald Trump’s threat to put additional 10% tariff on China hammered a market already tanking on disappointment over an inadequate U.S. interest rate cut. The fragile economy and looming oil supply surplus will almost certainly be exacerbated by the escalation of the trade war. As a result, the pitfalls for oil are growing.
Technical View: Since the end of June, oil has been on a bearish trend while trying by two attempts to drive prices higher. The 8 consecutive days of consolidation built-up enough volume to create a false upside breakout and dip the energy commodity more than 8%. It is now a selling spike phase eager to settle the security around the demand level .
Target: Stay bearish and sell any high point while we don't break upside 56.000 and aim a take profit around @52.000.
Tradewar
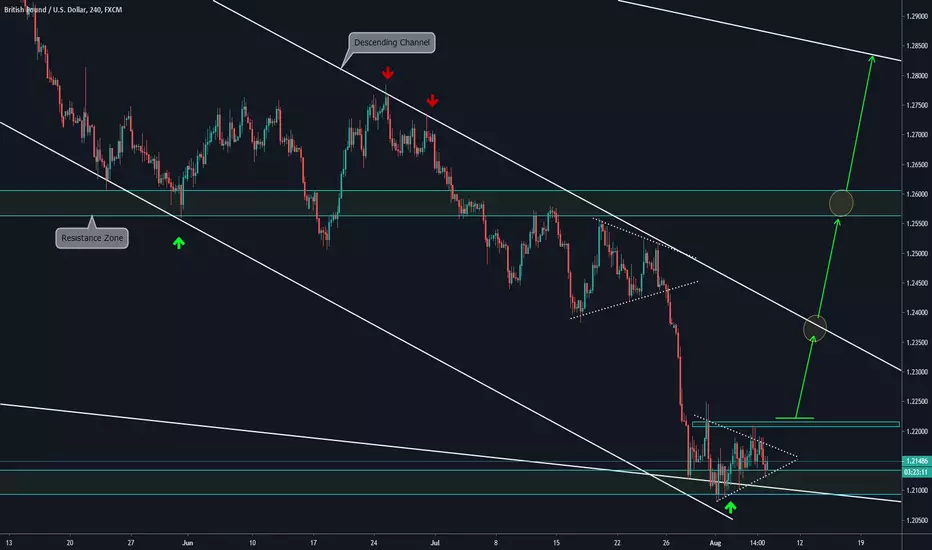
GBP/USD Ready for the Bullish Movement? 4H CHART EXPLANATION:
Based on the Higher Timeframe Analysis, we consider that this pair is on the end of the Bearish Trend. On the 4H timeframe, we would wait to the breakout of the last maximum Levels to be broke to consider placing a trade. The short term targets are the Top of the Descending Channel, the Resistance Zone, and the Lower timeframe Descending Wedge.
MULTI TIMEFRAME ANALYSIS:
-Daily:
-Weekly:
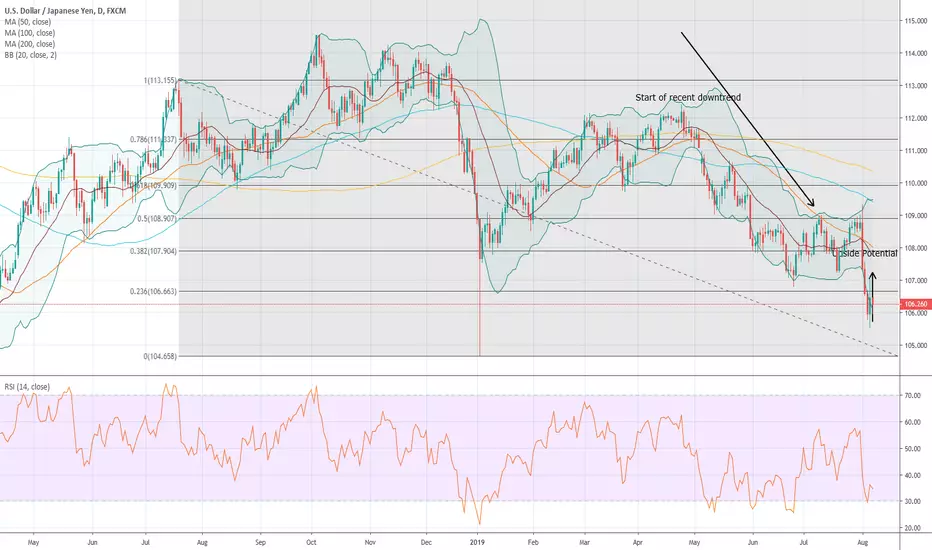
USDJPY - Long Upside PotentialWe have been long USDJPY and see the current level as an opportunity to increase our position due to alleviated concerns over the current state of the US/China trade war. This is highlighted by the S&P 500 rising 1.3% yesterday and White House adviser Larry Kudlow advising that the US is still open to negotiation with China. Therefore we still hold our long position but would not want to see the market drop below the Fibonacci support Level at $104.658 and on the upside in the near term we are aiming for the currency pair to cross the Fibonacci resistance level at $106.663.
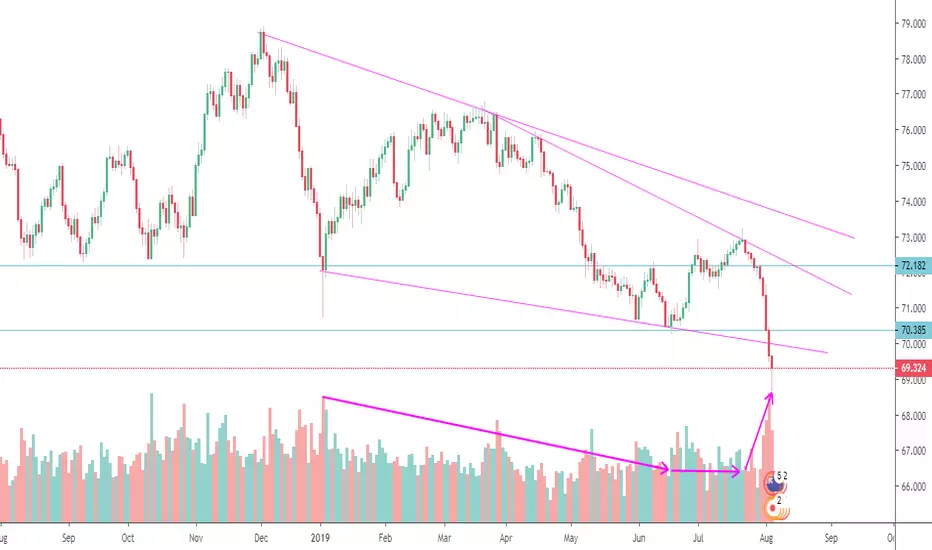
Crude remains in bearish territoryThe first potential bearish flag I analyzed has played out though with a delay, and since price has managed to reach the first target to the lower diagonal support. With overall negative sentiment around the trader war and demand for Oil, I will be expecting the price to breach the support for a move lower towards 50.58 price level zone. The zone has proven to be a strong support level, so I'll be expecting some bounce from there before the price to continue lower.
US-China trade war is starting to get out of handChina loses patience. After Trump attacked China, markets have been waiting for China to the response.
Sino inflicted several very strong and unpleasant hits for the United States and Trump personally.
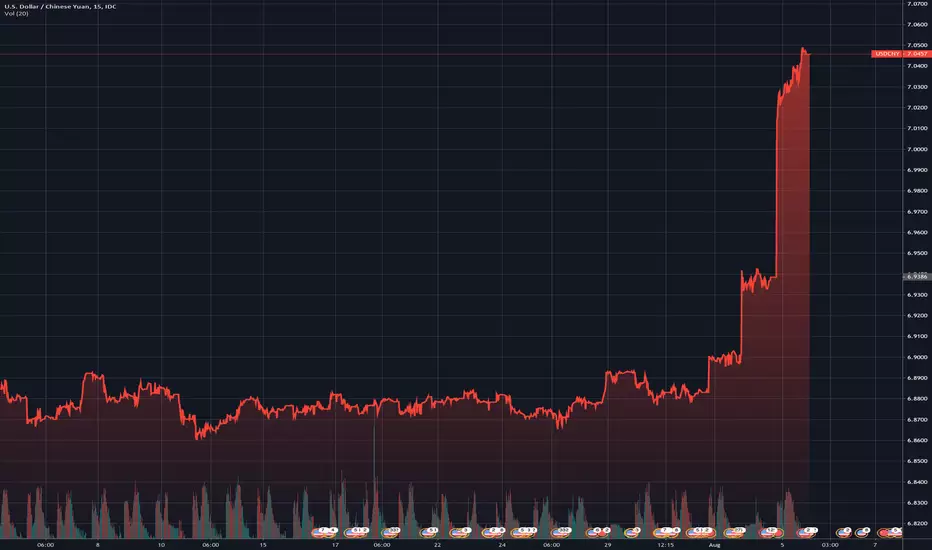
One . China lowered the value of the Yuan below its 7 to 1 peg against the dollar in response to a new series of U.S. tariffs. Thus, China partially solves the problems of its exporters arising from US sanctions. Recall, exporters are going to benefit from the devaluation of the national currency. As a result, with constant sales volumes in dollars, exporters receive more. Which, in fact, artificially inflates the financial results of exporters. Note that Trump for more than a month has been talking about the need to devalue the dollar to support American companies, but so far he cannot find support either from the Ministry of Finance or from the Fed. At that time, China one day solved this problem for itself.
Two . China Halts U.S. Agriculture Purchases. One of Trump's main complaints against China was the decline in US agricultural imports. What caused direct harm to US farmers and the US economy as a whole. So, the Chinese government has asked state-owned enterprises to suspend US agricultural imports. This is a severe hit to the pride of Trump and the US economy.
Three . Bank of America Merrill Lynch warns that China may cross out US administration’s success in restricting Iranian oil exports. US the sanctions and about 2 million barrels per day of crude has been forced out of the oil market, and BofAML believes that China if desired, can return a significant part of them - about 1.5 million b / s. What does this mean for the USA? A powerful diplomatic slap in the face, as well as potential problems for the whole US oil sector. The simultaneous release of 1.5 million b / d of oil to the market will lead to a sharp drop in oil prices. Analysts voiced estimates of decline up to $ 40 per barrel. And this will put the US oil industry on the brink of survival, or even beyond.
Total - everything is bad. Trump may well go to the next level of the conflict escalation. Too painful hits inflicted by China. And this means that commodity assets, including oil, should be sold. A save haven should be bought. We sell the dollar because one of Trump's possible reactions is the dollar devaluation. Currencies from developing countries are also worth selling. The Russian ruble which is under triple (or quadruple) pressure: falling oil, trade war, Russia's Central Bank cut its key interest rate, new sanctions by the United States, dispersal of rallies in Moscow, and this is not counting the main reason for the sale of the ruble - a weak economy of the Russian Federation.

HSBC (HK Entity) One of the two largest financial players in HK, and most certainly a derivative trade of the larger macroeconomic story. Keep this chart handy near-term.

China's Next Move - As of late Monday, US Treasury Secretary Steven Mnuchin formally designated China as Currency Manipulator. If we weren't already in a trade war, this is undoubtedly a tipping point as to how aggressive the administration is willing to get with their trading partners...
Apple - Neutral Hedge PositionOn our post earnings analysis on the 31.07 we were bullish Apple as the stock was trading at $217 and had crossed the $213.5 Fibonacci level. We were therefore expecting that Apple could potentially hit all time highs but as we feared could happen a souring of US/China trade relations has caused a sharp reversal in Apple's stock price and we have therefore fully hedged our position whilst we await further developments in the equity markets.

Daily viewIn this vision its obvious that the price has lost the position of being ina bullsish direction and also we see the failed double top pattern. So even if the pullback is one of the assumptions, the Newsland dollar has choosed its way and the trade war has choosed the Japanese yen...
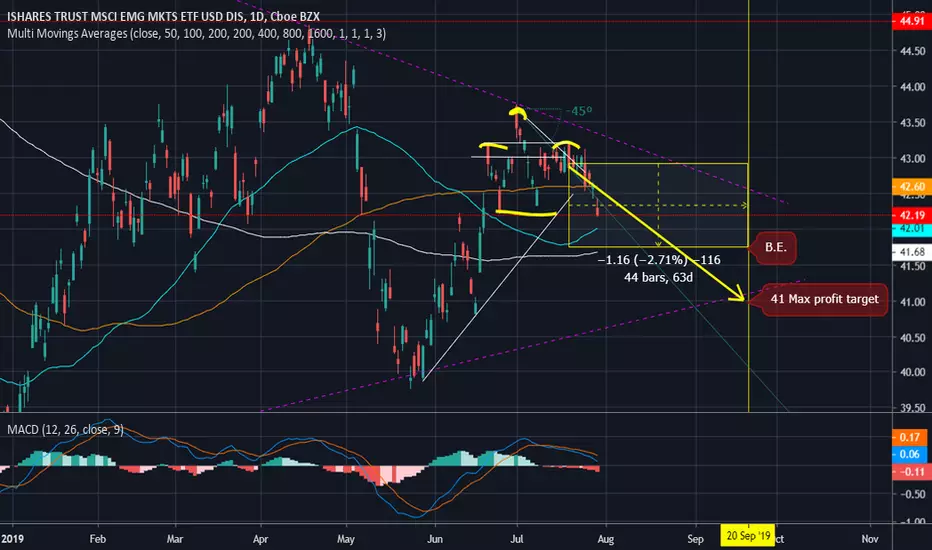
Update: EEM bear put spreadForgot to publish this idea a couple weeks ago:
BOT +2 VERTICAL EEM 100 20 SEP 19 42/41 PUT @.25
- pays 150 on max profit at 41 range on expiry
- breakeven at expiry 41.75. Needs a 2.7% drop to break even on the trade.
Slightly positive right now, and progressing well overall.
I put this trade on mid month when the EEM was around 43.
Looks like a type of H&S pattern forming. Watching the 42 range for neckline failure .
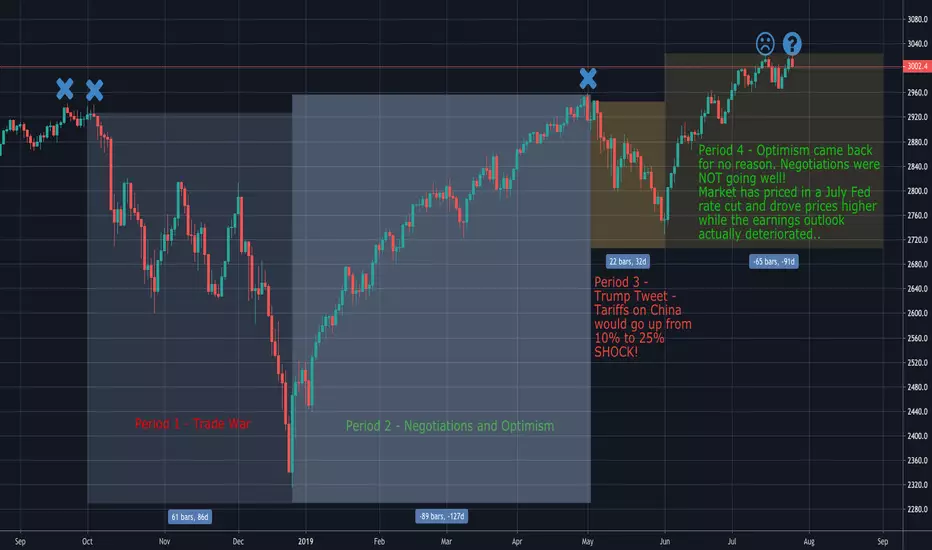
When Trump Made America Great Again - SPXSP:SPX
TVC:SHCOMP AMEX:VEU
TVC:SX5E
AMEX:VEU
1, Vertical lines: Thin Orange is Trump wins election. Thick Orange is start of Trump presidency
2. Chart Lines:
White is USA stock market, S&P500
Blue is the European “Dow Jones”, Euro Stoxx 50
Orange is the market cap weighted index of the entire planet’s stock markets (the 44 countries with capital markets), except the S&P 500. “All World minus USA” ETF.
Red is China stock market.
Summary:
Between January 29th and May 24th, 2018, The U.S. went from lagging the World’s stock market to clearly leading the Earth’s stock. I propose this is a direct result of the announcement and implementation of Tariffs. 1st with $50B of tariffs on China on March 22nd, 2018.
- I had initially thought this was due to Brexit (Britain exiting the European Union), However, the Brexit vote happened in June 2017, and actually seems to have boosted their markets.
- For symmetry, and to compare apples 2 apples, this chart is in log percentage format.

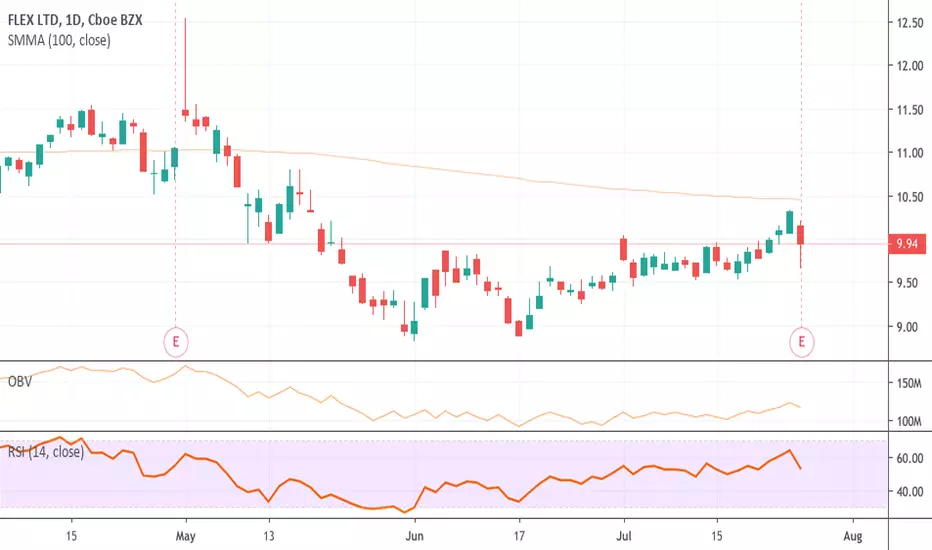
Huawei not happy with FLEXFLEX is suffering from the trade-war between Trump and Xi (US and China).
Huawei is "angered" at how FLEX has managed the situation.
They report earnings today after hours. (July 25th)
I would sell all my position right away.
SP500 won't go much further up from 3000Below is technical analysis based on chart readings. Refer to chart for macro commentary.
SP500 meaningfully tested 3000 five times in the past 12 months.
First two formed an M resistance - didn't break through.
Third time was also two very close attempts - didn't break through.
Finally, in July, we have seen 3000+ twice. One's already past us, the other one - we are in it right now.
Does this look familiar to you? Another M shape maybe?
Coupled with the macro conditions, I believe the market cannot go much higher from now on, and will correct 10-15% by Dec 2019.
I have sold my SPY . Planning to enter below strategy this week:
Short 270 SPY call Dec2019
Long 300 SPY call Dec2019
Initial credit to buy TLT
Monthly covered call on TLT
I will close above strategy by Dec 2019. Fingers crossed.
GBPJPY LONGThis pair has shown a strong bullish momentum yesterday and looks set to continue this today.
I have drawn up two potential buy zones on this 4 hour chart.
Looking to enter on pullbacks to these zones.
Trade safe and good luck!

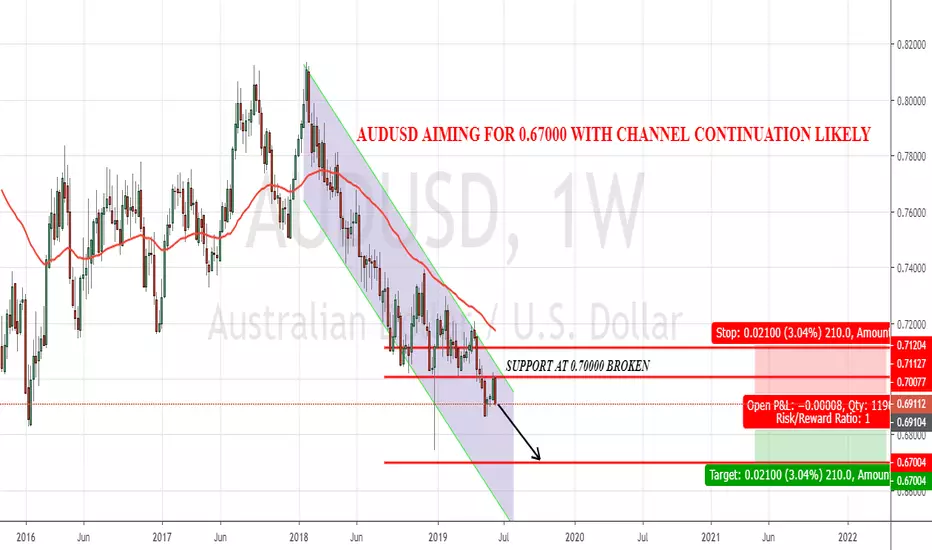
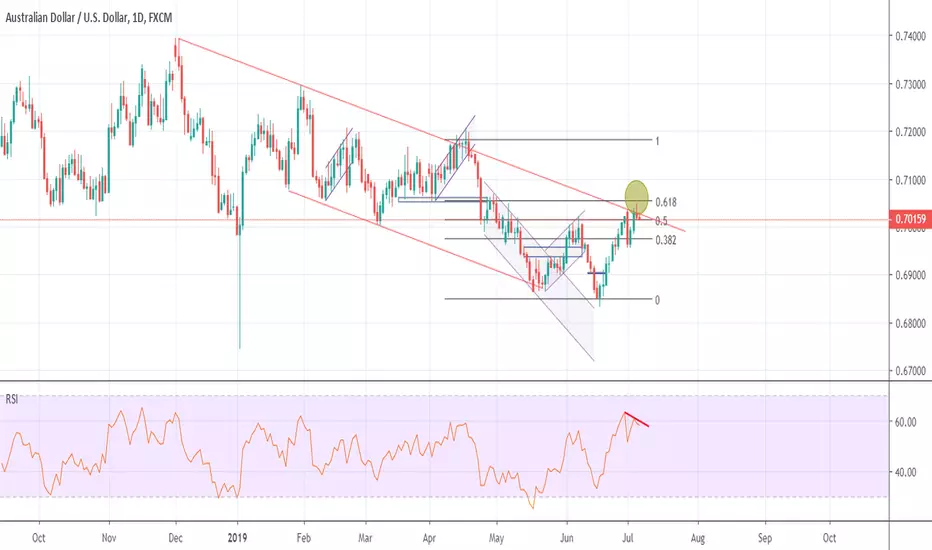
AUSSIE Likely To Slump Towards 0.6700 Level. A SHORT SWING TRADENow that The RBA has cut its interest and the economy not doing so well we could see this pair slump to 67 cents!
Bare in mind that the 0.7000 level is a very crucial resistance at the moment and any upward momentum is unlikely to happen as the trade war persists putting pressure on the AUD.
0.67000 level is another crucial support that has been drawn from the monthly charts and in my view this where the price is headed next. so below are the trade details. shall there be any updates i will update them below
TRADE ENTRY LEVEL: 0.69100
STOP LOSS: 0.71100
TAKE PROFIT: 0.67000
RR: 1:1
TRADE TYPE: SHORT
CHEERS
FOREX, ruble, August and Jaroslaw KosatyThe fact that there was no fundamental force majeure yesterday led to the “calm” Wednesday. In fact, the last statistics outcome prepared in line with forecasts as well as UK inflation rate. After crossing the new local Minimum yesterday, the pound “changed the situation” in the afternoon. So, we recommend looking for points for its buying.
Traditionally we cannot but mention Mr Trump’s Twitter account which he uses as “negotiation table”. “We have a long way to go as far as tariffs where China is concerned, if we want. We have another $325 billion we can put a tariff on, if we want,” Trump said. As the result Gold at 1430. So, we recoomend to sell gold from these points, and buy it from these 1400.
As for the Russian ruble sellings. Well, August is not “the luckiest” month for the ruble. “ August's” Force majeure situations, as well as fundamental negative have affected the ruble. Start with the August Coup (1991) and default (1998) to Kursk submarine disaster and Russian-Georgian (2008) and Russian-Ukrainian wars (2014). In this light, Jaroslaw Kosaty, a currency strategist at Poland’s largest bank, sees the currency sinking about 9% against the dollar by the end of the year. His forecast of 69 rubles per dollar. The reason is that Bank of Russia’s switch to monetary easing. Therefore we recommend selling Russian ruble.
The Federal Reserve abandoned foreign-exchange-market intervention. Recall that a strong dollar is on Trump’s way. As a result, his verbal attacks are becoming more aggressive and let the markets suspect that the United States will move from something in mind to something in kind. Treasury can intervene without the Federal Reserve's agreement (2000). We are waiting to see if it happens again. But the rick factor exists. The most interesting trading option is short dollar. Therefore, we continue to recommend looking for points for dollar sales in the foreign exchange market.
Our trading preferences for today are as follows: sell US dollar, oil, ruble and gold, but buy the pound.

BTC - Short updatePlease see previous idea for in more in depth logic.
As kind of expected, the price reached and rejected off the 4.618 advancement.
From here, BTC has the potential of turning bullish again once the daily crosses over the 2/1 line. Potentially within a couple days from now.
That could cause it to make another run at breaking 14k
But until a breakout is confirmed, the trend suggests bull trapping be happening.
Good luck!
Consequences, oil surplus & dollar in troubleThe previous week provided quite eventful for the financial market. Now, the market expects the Fed to cut the interest rate this month. The probability of such outcome is 100%. So, there is a conundrum, reducing by 0,25% or 0,5 %? After two days of Fed Chairman Jerome Powell's testimony to Congress making the US dollar a weak player as a short dollar.
The current downtrend is just a beginning as the US dollar is at extremum point. In addition, as the USA monetary policy has shifted supporting bearish trend. The one and only important data will be Retail Sales Report in the USA, therefore, we sell the dollar.
Force majeure events are near term and not supporting the current market conjuncture that has been named as long-term Surplus. International Energy Agency 2Q 2019 the surplus was 900 000 b / d. As we can observe the OPEC + No. 2 did not precipitate the commodity deficit.
Since 2011 oil consumer demand growth rate is at its lows, we will sell the oil.
Trade war is the reason for all the trouble the economy is facing. China reported a data pact with macroeconomic data: GDP and industrial production growth rate, retail sales indicator.
Despite the fact that the outcome is better than expected, GDP growth was 6.2%, which is below the minimum mark of 6.5%, which the Chinese Government put in its long-term development strategy.
Earlier, China reported a decline in exports by 7.3%, and Singapore (one of the world's most export-dependent economies) reported a decline in GDP in the second quarter by 3.4% (the maximum decline since 2012).
Our trading recommendations for today are as follows. We continue to look for opportunities to sell the dollar in almost all pairs (USDJPY, EURUSD, GBPUSD). Sell the Russian ruble and oil. We continue to sell the oil near the highs and buying from the lows.
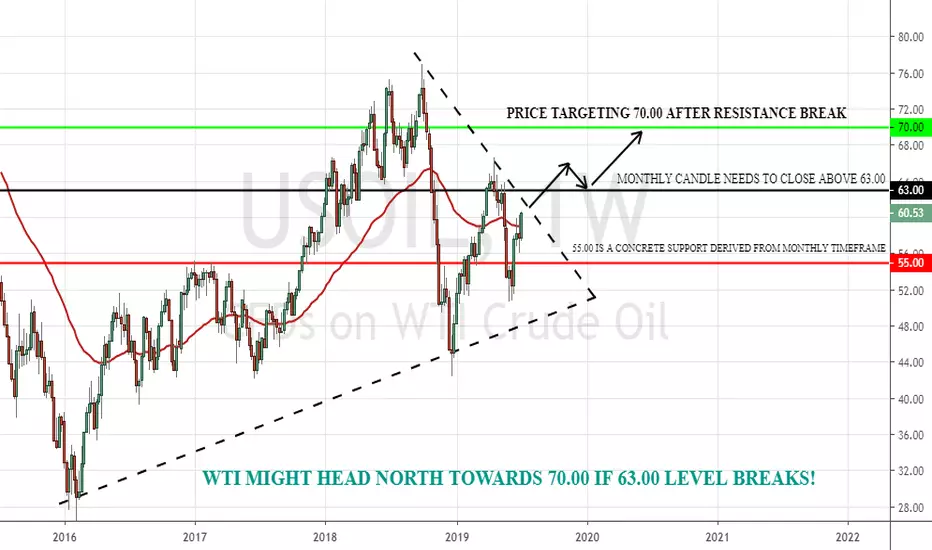
WTI (USOIL) Might Target $70 Amid Iran Tension & Supply Jitters!The 3 horizontal lines visible in the main weekly chart of WTI are concrete support and resistance levels taken from monthly TF. Currently the price is at 60.00 and there is a descending trendline preventing the price from climbing further. From a technical perspective, once this trendline breaks, the price on the monthly charts must close above 63.00 concrete resistance. This is just to add gain further confluence and confidence in our potential trade. Once the monthly candle closes above 63.00 we could wait for the price to retrace slightly before executing a LONG trade to target 70.00!
On a fundamental perspective there are 2 factors in our favor. First one is the IRAN tensions with the US and now potentially U.K. US putting sanctions on iranian OIL is bullish for the WTI and the tensions is just further strengthening this aspect. Secondly, the storm in the gulf is limiting the drilling activities which is also bullish for the OIL. Lastly the the deal that is binding OPEC & NON-OPEC countries seem to be going okay so far as they all want the price of OIL to rise.
One thing that is bearish for the WTI at the moment seems the ongoing tradewar which if no deal could be made, the demand for OIL would decrease!
So it remains to be seen in the coming weeks how the situation develops. Shall there be a trade entry i will post in a new post.
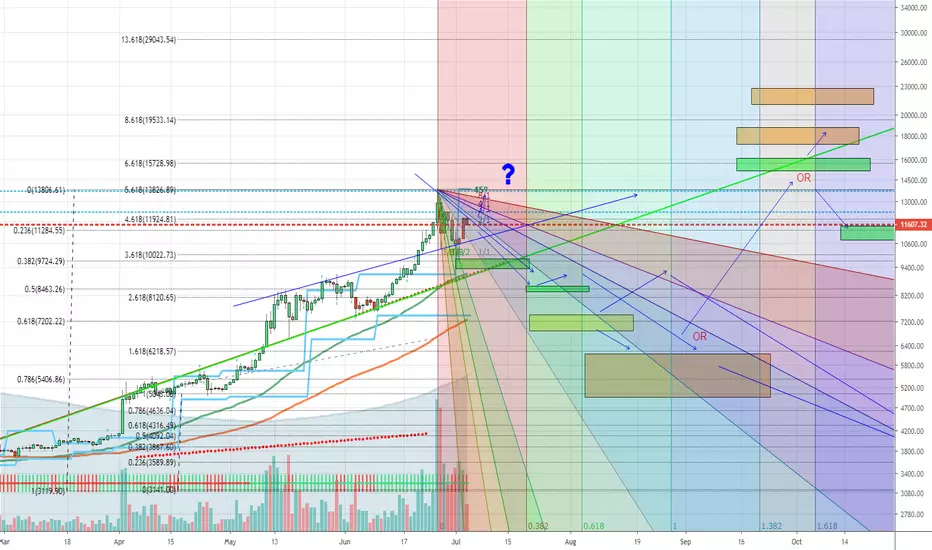
SP500 could see 3300 by late October and here's howIn this video, I explain the basics of using Fibonacci, time application and geometry to predict the future.
TLDR: SP500 will hit 3045 and while it could reject here, it looks quite bullish and 3307 is worth betting on.
The rising wedge will break and we could see a December style dip around late April, early May 2020.
Getting to 3300 could be a slow melt up over the next few months, with a total break down in trade negotiations being a possible/likely catalyst for the break down.
BTFD will work for as long as the market believes the Fed can engineer the economy.

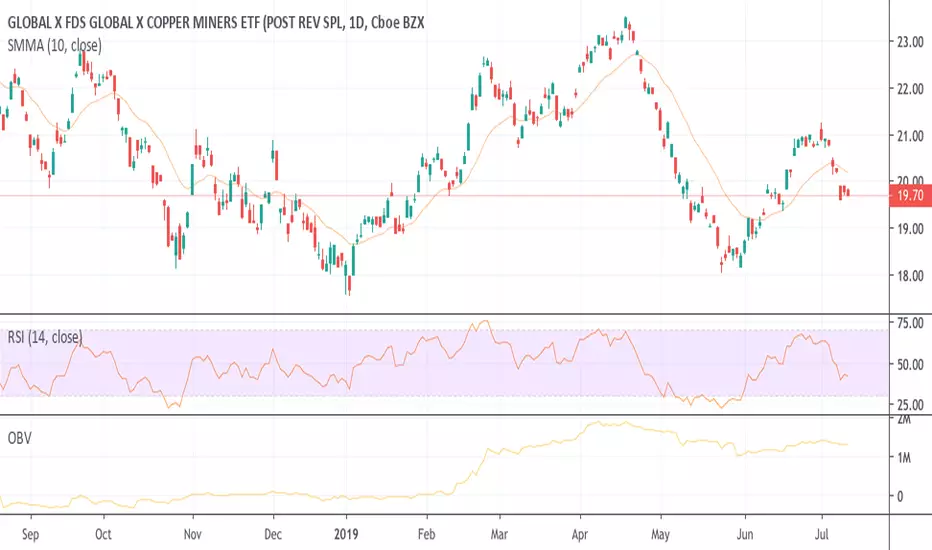
Copper --> Trade war indicatorConcern grows over global economic slowdown. The US continues to be a leader (for now).
China is the largest copper consumer, and has been beaten down. Technicals don't look good at all. At least there is no divergence.
If Trump and Xi don't reach a deal, you must know - copper will absolutely go down.
P.S:
COPX (Global Copper miners)
CPER (United States Copper)
AUD/USD: Fake breakout on dailyHi guys, AUDUSD is forming a promising setup on the daily chart.
The price made what looks like a fake breakout with a bearish pinbar candlestick near the 61.8% Fib level. The level also aligns with a horizontal and trendline resistance.
The RSI formed a bearish divergence in a pair that is overall in a healthy downtrend.
Let's see what today's NFP will give us, and bear in mind that a US-China trade truce or any positive news on that matter may support the Australian dollar.
Please hit the "LIKE" button to support our work. Thanks!
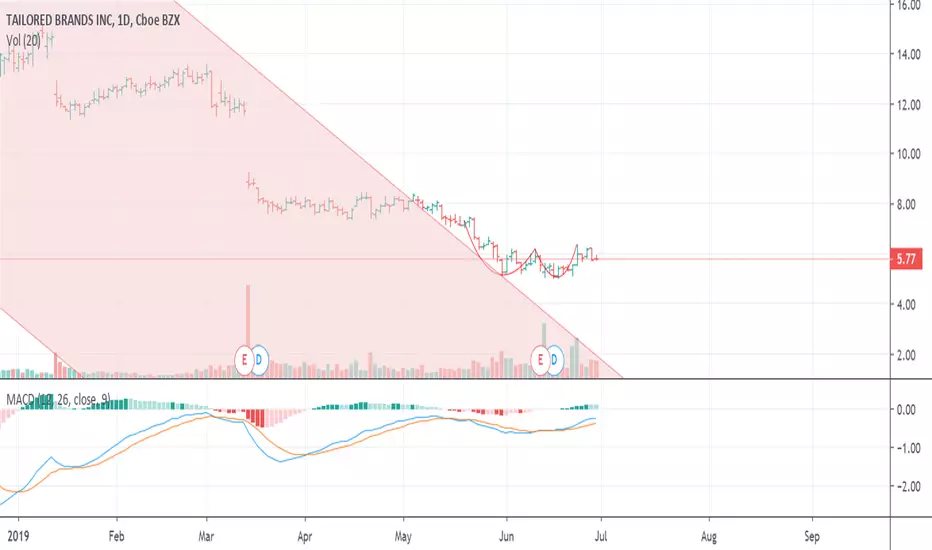
Tailored Brands channel break, double bottom, short squeezeTailored Brands has been in a *steep* decline since its high of 35.86 in May 2018. It fell all the way to just above 5.00 this month. Wow.
However, I see signs of reversal.
Firstly, we've broken out of the downward parallel channel that the stock inhabited for a year.
Secondly, We've formed what looks like a double bottom pattern.
Thirdly, the stock's fundamentals are starting to look better. Its 3.82 P/E is attractive, and its forward P/E of 3.07 is even better. In the last 3 months, insiders purchased a net 143,015 shares-- much more than the net 36,253 shares they purchased in the 9 months previous. TLRD beat estimates on its last earnings report, and it said encouraging things on its last conference call about reducing China exposure. Plus, there's news this weekend of renewed trade talks between the US and China.
As a bonus, short interest is 35.47% of float, which makes this stock a good candidate for a short squeeze. If the year-long trend changes and the price begins to rise, it could do so very quickly.