6 ways to stop loss in gold
Take profit and stop loss are one of the most important links in the entire trading system. After studying this article, you will be able to thoroughly understand the stop loss method.
You can bookmark it before reading it. If you feel that you have gained something, you can like it, thank you.
1. 6 stop loss methods
Stop loss means that when our order loss reaches a predetermined value, we need to close the position in time to avoid greater losses.
In a complete trading system, stop loss Stop loss is divided into static stop loss and dynamic stop loss.
Static stop loss means that after the order enters the market, the stop loss is set at a fixed stop loss space, or the stop loss amount remains unchanged. Once the market trend is unfavorable, the stop loss will be closed when the set position is reached. For example, after an order enters the market, set a stop loss of 100 points, and close the position when 100 points arrive.
Dynamic stop loss means that the standard of stop loss in the trading system is dynamic. When we hold a position, the market is constantly fluctuating, and there is no fixed point for when to stop the loss. We must observe the dynamic market changes until there is a trend that meets the stop loss standard, and then stop the order. For example, when holding long orders, the stop loss standard is that the market forms a short reverse break position structure, and we will stop the loss manually at this time.
Method 1: Fixed stop loss space, or fixed stop loss amount.
This is a relatively simple static stop loss method.
After the order enters the market, set a fixed stop loss space, for example, after an intraday trading order enters the market, set a fixed 30-point stop loss. Or set a fixed amount stop loss, for example, if the order loss reaches 1% of the principal, the stop loss will be stopped.
There are also traders in the stock market who stop loss at a fixed percentage of market retracement, for example, stop loss if the stock falls by 5%.
In this way of stop loss, the space for stop loss should be determined according to the specific volatility of different varieties.is absolutely necessary, and a trading strategy without stop loss will eventually end in loss.
Method 2: Stop loss at high and low points.
High and low point stop loss is the most common stop loss technical standard, and it is also a static stop loss method.
The market always operates in the form of waves, so there will be continuous rising or falling callback highs and lows. These highs and lows are also called inflection points. In actual combat, the starting point of the wave or the inflection point of the callback is used as the stop loss point.
After the bottom of the market breaks, open a position. There are two ways to use stop loss at high and low points. One is to place it at the inflection point, and the other is to place it at the starting point of the wave.
The inflection point stop loss, the stop loss space is small, the profit and loss ratio is good, but the fault tolerance rate is low, and it is more aggressive.
Stop loss at the starting point of the market, the space for stop loss is large, and the profit-loss ratio is worse, but the fault tolerance rate is high and more conservative.
This stop loss method is also relatively flexible, as the volatility changes, the stop loss space will also be adjusted.
Method 3: Combine technical stop loss.
Stop loss combined with technical positions refers to the combination of key positions of technical indicators in actual combat, and stop loss when the market breaks through these technical positions. For example, important support and pressure levels, or technical moving average levels, etc.
Method 4: Stop loss in trend reversal pattern.
This is a dynamic stop loss method. After the order enters the market, the market goes out of a reverse structure or form. At this time, it can be understood that the trend has reversed and the order is stopped.
In actual combat, you can combine your most commonly used criteria for confirming reversals. You can use the crossing of moving averages, or the breakout of trend lines and channel lines, etc., as long as the standards are consistent.
Method 5: Stop losses in batches.
In an order, set multiple stop loss standards, and stop losses in batches in proportion to different stop loss points.
This is a compromise stop loss method. Set different stop loss points through different stop loss standards to disperse the risk of stop loss.
In actual combat, it is often encountered that after the order stop loss, the market reverses and goes out of the original trend. At this time, because the order has stopped loss, it is very disadvantageous.
The operation of batch stop loss can keep a part of the position when encountering this situation, and can continue to make profits after the market goes out of the direction again.
Method 6: Moving stop loss.
Trailing stop loss means that after the order enters the market, the market develops in a favorable direction. After leaving the entry point and gradually generating profits, the stop loss is adjusted from the original stop loss point to a more favorable direction. The market gradually develops and the stop loss Also adjust gradually.
Moving stop loss is a bit like the left and right feet when climbing stairs. When your right foot goes up the steps, your left foot will follow. Every time the profit increases to a certain extent, the stop loss will follow.
The first purpose of trailing stop loss is to preserve capital, so most of the time the first step of trailing stop loss is to move the stop loss to the cost price.
In this way, even if the worst result is encountered, the order will be out of the market without loss. After setting the trailing stop loss, the order will no longer lose money, and even the profit has been locked. At this time, the psychological pressure of holding positions is very small, which is conducive to the execution of transactions.
These 6 stop loss methods, you can choose the appropriate method according to your own trading strategy
OANDA:XAUUSD OANDA:XAUUSD COMEX:GC1! TVC:USOIL BINANCE:BTCUSDT.P COINBASE:BTCUSD
Trading-ideas

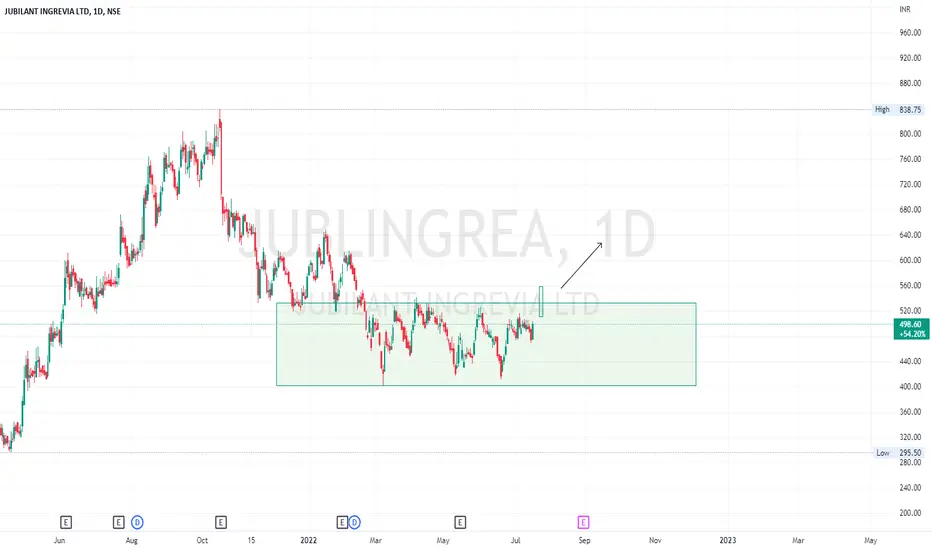
Jubilant Ing box consolidation breakoutBox consolidation going on, we need a strong green candle closing above box for long entry. SL will be below box on closing basis.
Good for swing trading and investment too.
Debt free company with good FII holding.
Can break ATH and make new lifetime ATH
Please like and subscribe.
Education purpose only.
-Saptarish Trading
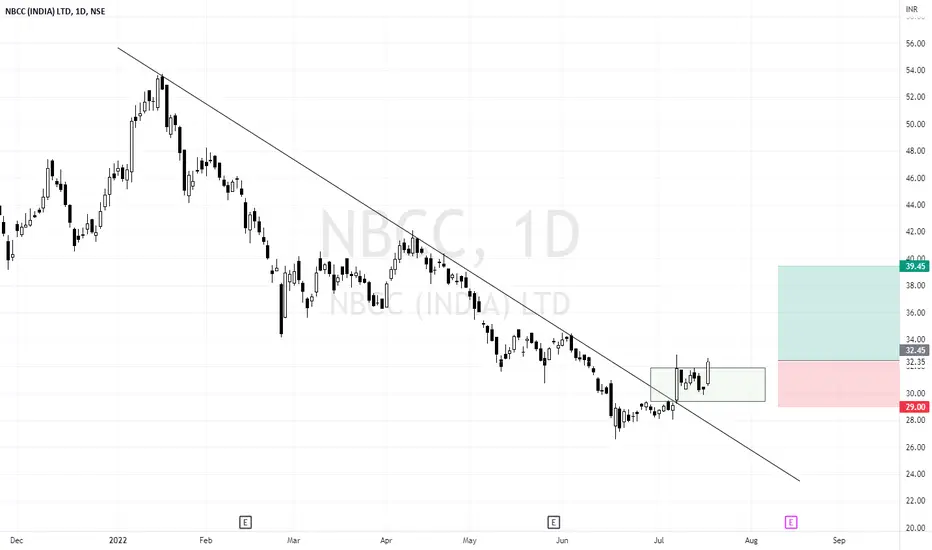
NBCC Long setupNBCC broken long above 33 for targets of 35-40+.
SL below 29 on CLB
Company is almost debt free.
Company has been maintaining a healthy dividend payout of 40.53%
-Saptarish Trading
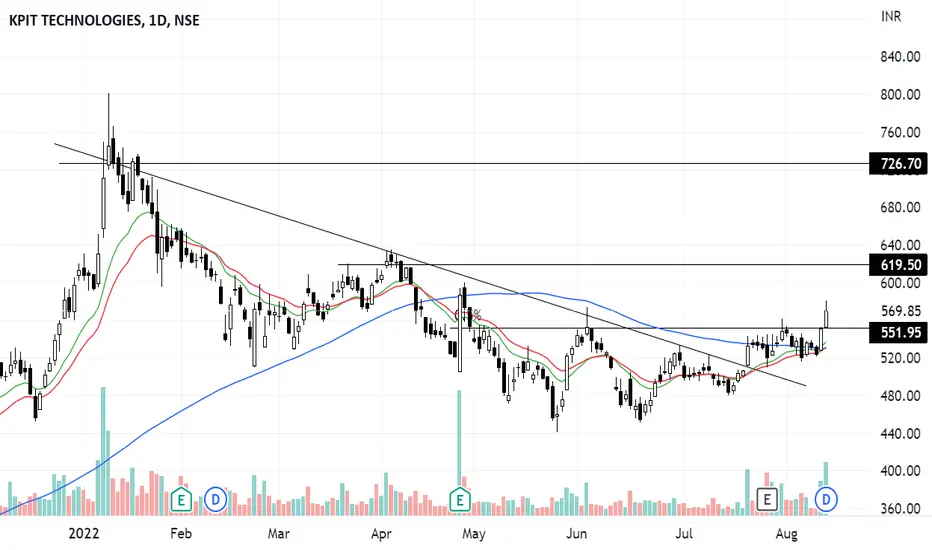
KPIT TECH long setup for swing tradingKPIT TECH has broken resistance trend line and closed above recent swing high, now making higher highs on weekly timeframe.
Closed above 50% fibo retracement level.
Long above 575, targets are 600, 630, 650, 670, 700+, SL 510.
-Saptarish Trading
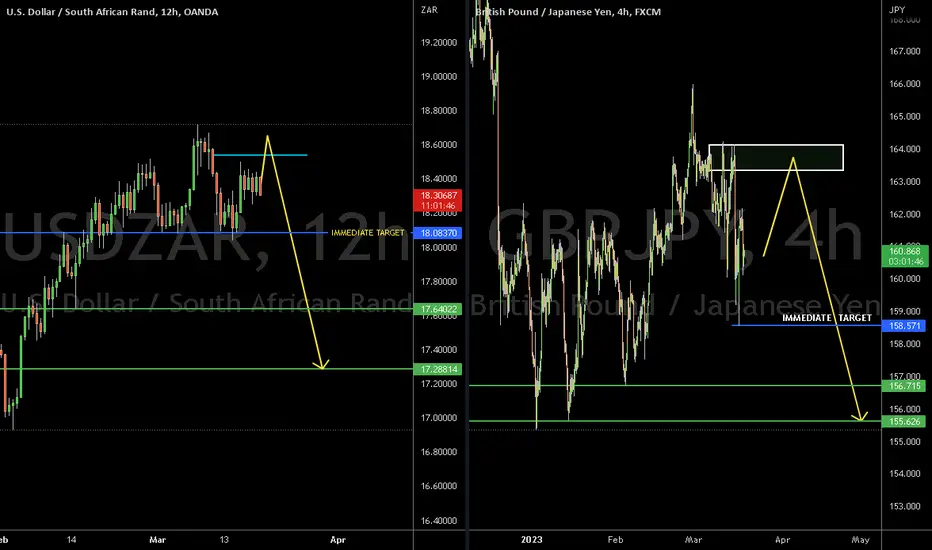
USD MXN | GBP JPY | DECRYPTERS HI people welcome to Team Decrypters
We are Bearish on Both pairs ( GBPJPY & USD MXN )
Both should give Decent selling opportunity and could be Trade of week
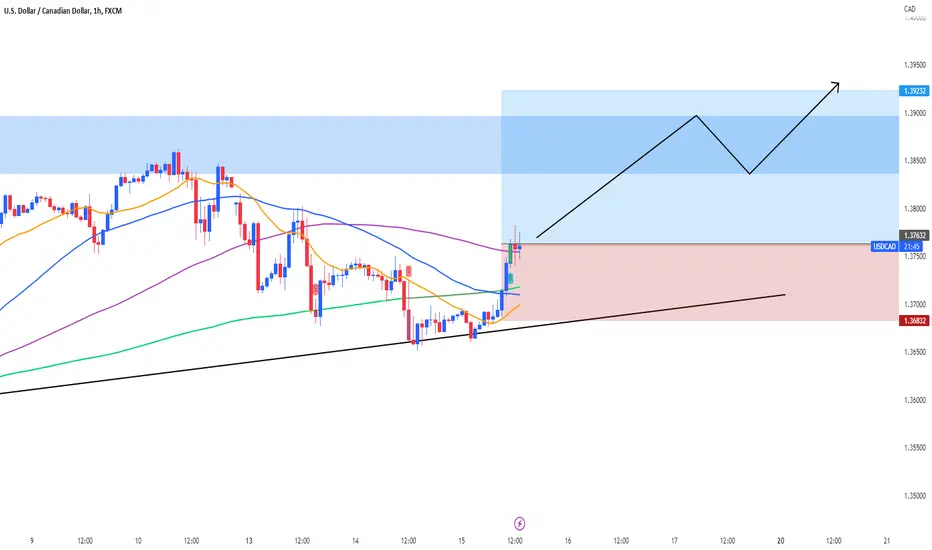
USDCAD | DOES LOOK LIKE A GOOD BUY Hey Traders!
everyone It had that nice bullish pressure breaking past moving averages, lower timeframes are showing great candlestick formations to continue its bullish pressure. stoploss also covers all the moving averages makes it a little safer trade as well.
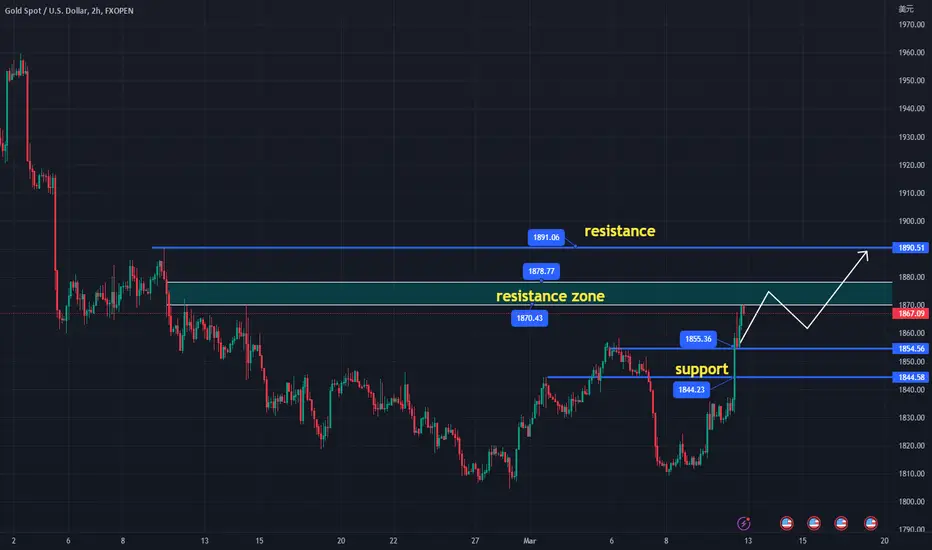
Will gold continue to rise?
Gold skyrocketed to around 1870 after the release of the non-farm payrolls report, and this is the question that most investors are concerned about: will it continue to rise?
I believe it will, and it may even reach around 1890-1900.
Why do I say this? Let's analyze it from the fundamental and technical perspectives.
As we have discussed in previous articles, the non-farm payrolls report is likely to be bullish for gold and drive up the price, and this judgment has now been confirmed, so the fundamentals are in line with expectations.
From a technical perspective: Gold experienced a V-shaped reversal this week after hitting a low, with the weekly chart closing out and the price now turning from weak to strong. The daily chart shows a continuous increase in positive days, with increasing trading volume and the price forming a bullish trend. The 4-hour chart has formed a double-bottom support rebound, and the price continues to rise with a positive momentum. The Bollinger Bands are opening upwards, the MACD is showing a bullish crossover, and the red momentum bars are continuously rising, indicating that the current price is in a strong bullish trend. Therefore, the focus should continue to be on long positions.
However, the current decline of the US dollar is about to form a triple bottom support, and gold may experience a correction. This is not bad news, because the recent rebound of gold has been too fast. If it can adjust and then gather momentum for an upward surge, it would be a healthier and more optimistic trend. The overall upward trend remains unchanged, and I believe that breaking through 1900 is not far off.
Therefore, try to buy on dips. Specific trading space charts have already been drawn, and attention should be paid to support near 1845-1855 in the short term. The first resistance above is around 1880-1890.
More detailed strategies will be provided according to market fluctuations. Follow the homepage ↓ to get real-time information.
OANDA:XAUUSD TVC:GOLD COMEX:GC1! FXOPEN:XAUUSD
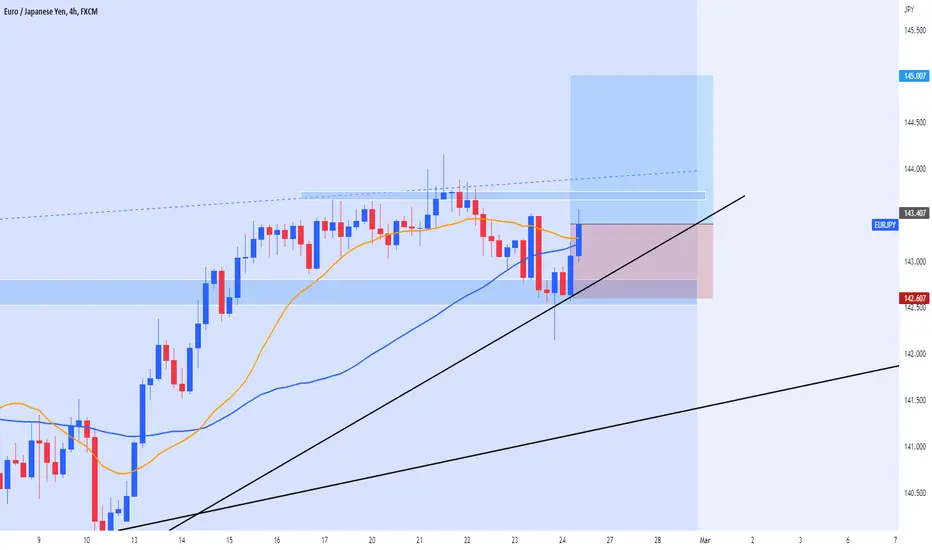
EURJPY | COULD BE A GOOD BUY IN NOW Hey Traders!
I believe EURJPY has a good chance to go up to re-test previous top level, if broken we should see this trade trend further.
AUDCHF | THIS COULD BE A GREAT SELLHey everyone due to FOMC later today markets are not moving as much as not giving a clear indication of direction, this is usually due to news anticipation and everyone wants to see a clear trend before they react, so AUDCHF was pretty much the only choice on the table, it broke the neckline of a head and shoulders pattern, broke the previous support and now should be going down to re-test previous bottom level, if broken then we will see this trade further dropping down, ma's also cover stop loss so should be able to ride any of the volatility on this pair.

AUDNZD BUY - If bullish engulfing candlestick closeHey Traders!
Everything is trending up nicely, a rejection to the moving averages and not forming a bullish engulfing candlestick, if this manages to close bullish then we can definitely enter trade long to re-test top level, if broken then it should head much further.
I like the idea, just wait for closure before entry:)

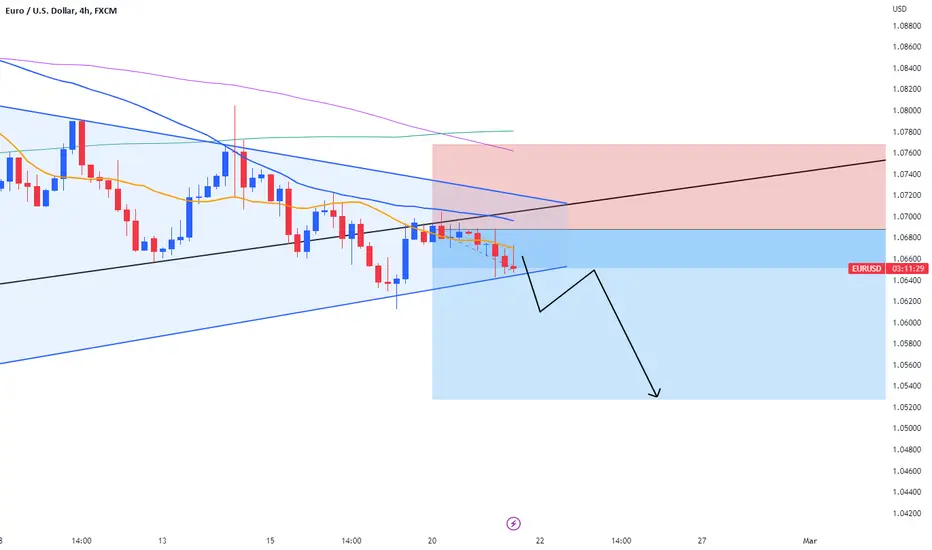
Selling Opportunity: EUR/USD Drops on PMIHey Traders!
👨💻 Technical: If we manage to break the up-trend and have a push exhaustion scenario, with a bearish engulfing candlestick as confirmation to go short, this trade would do great! :)
🎯 For an ideal entry: Wait for a push exhaustion cycle to happen, enter on completion of exhaustion.
ONLY ENTER IF IT BREAKS OTHERWISE NO ENTRY.
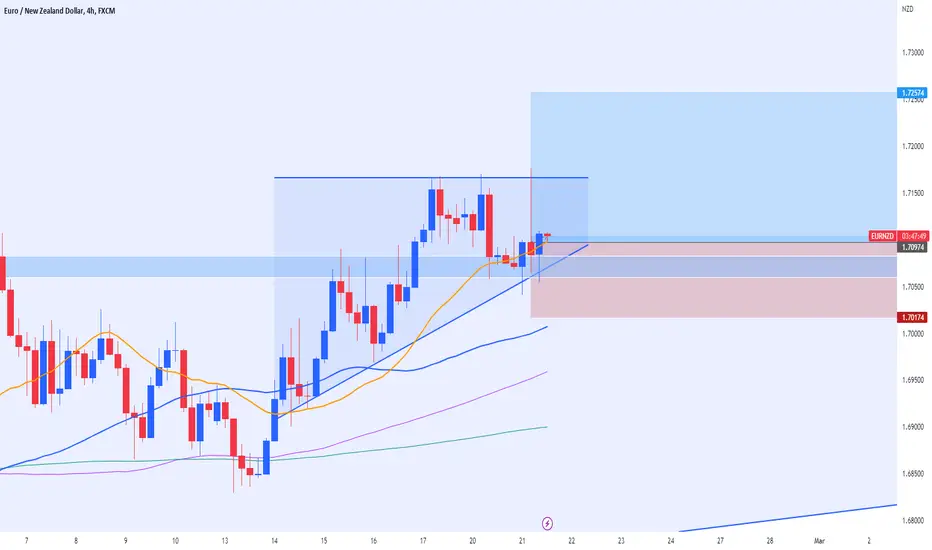
Riding the Wave: Profiting from the EUR/NZD Currency PairHey everyone, eurnzd looks like a nice buy to re-test the previous top level, everything seems to be trending towards the upside on the higher timeframes. We had a daily resistance broken hence the horizontal line crossing stoploss. We still have not yet crossed the 1h 50 ma line, once this is crossed this trade becomes very bullish. 📈❤️
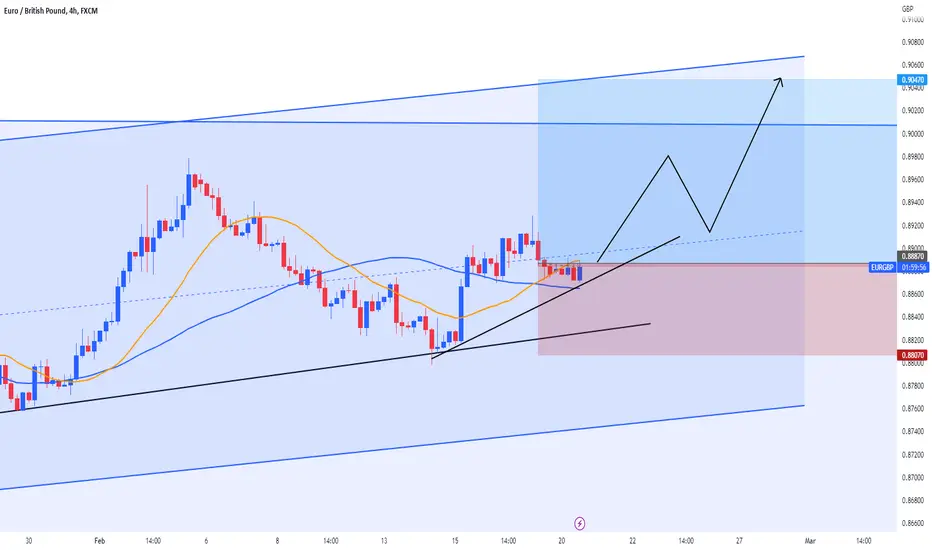
Buying EUR/GBP When the Moving Average BreaksHey Traders!
If moving average of 20 is broken you could potentially look to long this position, everything trending towards the upside besides the 1h timeframe, if that breaks this could make this trade super good, for a nice re-test the previous area top.
P.S if no break then no entry
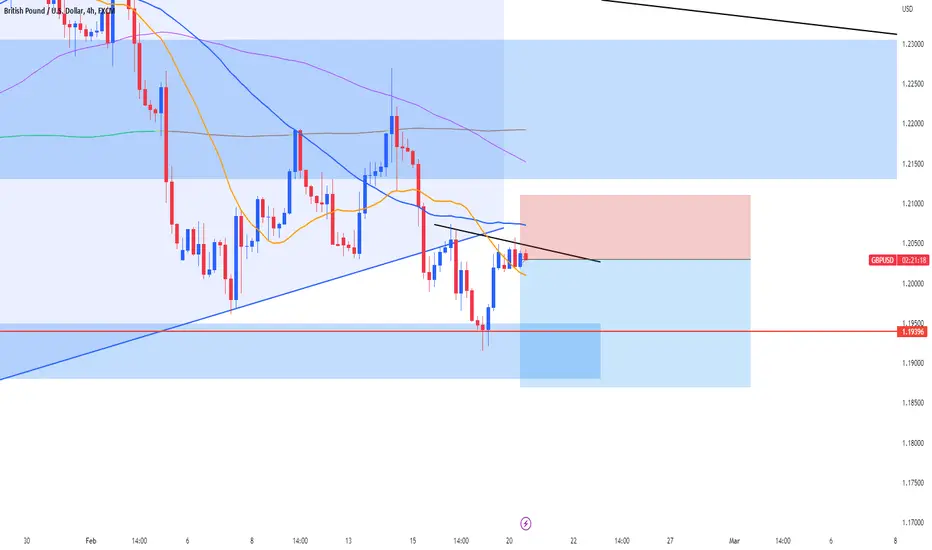
Cable at a Crossroads: A Bearish Case for Selling GBP/USDHello Traders!
👨💻 Technical: Similar scenario to EURUSD we had a nice shooting star close on the 4h and a nice push exhaustion cycle near the moving averages, but is that enough? well we still have not broken the 1h MA's which would make this trade from good to great, so we need to be careful about that. We also have a strong area of support market with a red line.
🎯 For an ideal entry: Same as eurusd, you either enter now and risk the 1h moving averages will be broken, or wait until they do break, have a push exhaustion and enter short.
Bearish Signals: EUR/USD Sell Opportunities Ahead?Hey Traders!
🔻Potential SELL setup for: EURUSD
👨💻Technical: Candlesticks are near moving averages, should be a good turning point for the trade, however the 1h has not yet crossed them, so you might want to wait for that to happen before you enter, we also broken daily trendline with a push exhaustion cycle finally complete, recent shooting star on the 4h does give more bearish bias.
🎯 For an ideal entry: You either enter now and risk the 1h moving averages will be broken, or wait until they do break, have a push exhaustion and enter short.
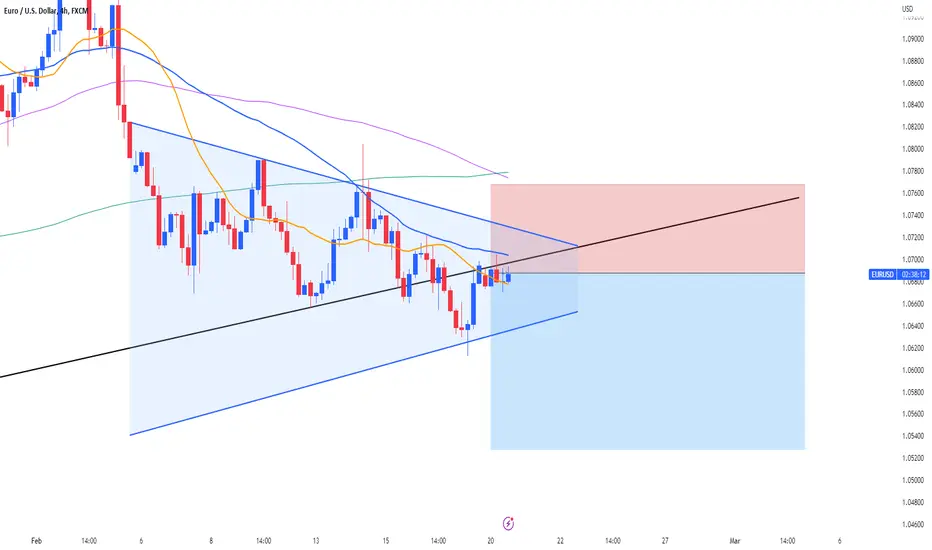
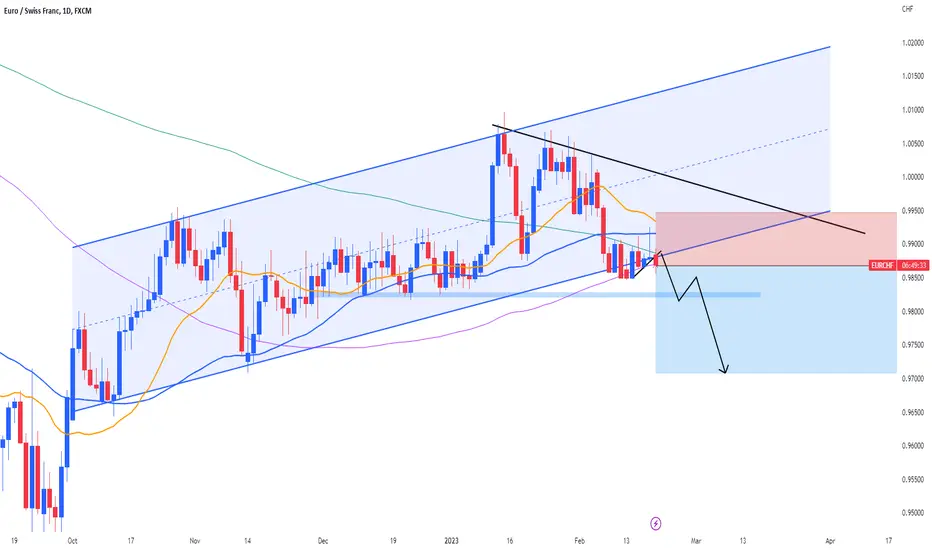
Swiss Franc Strength Sparks EUR/CHF Selling OpportunitiesHey Traders!
A nice push towards the downside broke past the moving averages and came back in, but typically this only means a push exhaustion scenario and a continuation push towards the downside, we already had a break off 200 ma on the 12hourly so likely the daily will follow, I believe this trade currently has around 30 pips profit gain, but once broken the major support level this trade can go much lower.
Presidential Day for US & CAD - for fundamentals.
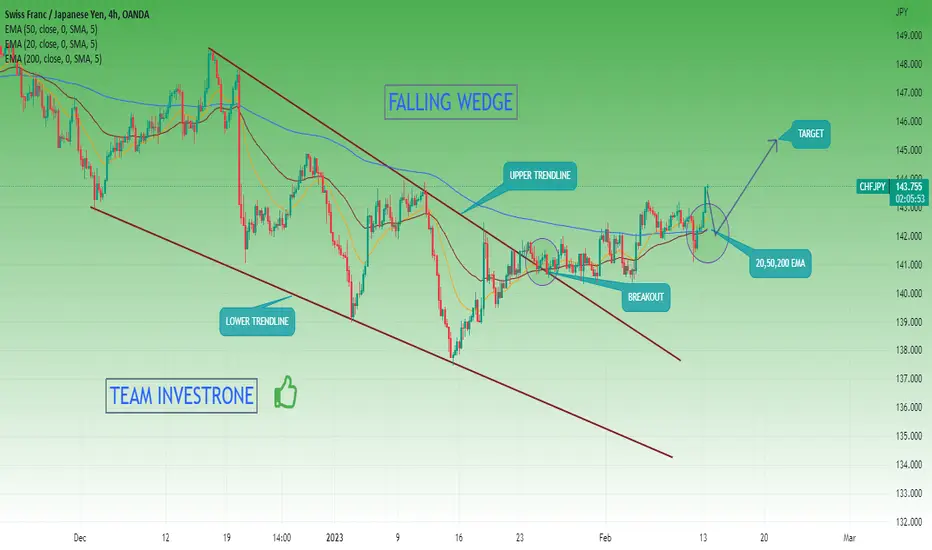
CHF/JPY PERFECT BUY SETUPOANDA:CHFJPY
HI,TRADER'S , AS you can see , market breakout from FALLING WEDGE
Now Market is in UPTREND 20,50,200 EMA at 142.10-142.55 supporting Market to go up
Market Can retest latest support at 142.20 And Go further UP for 145.50 Target
take your buy Entries after Retesting OF support LEVEL
❤️ Please, support my work with follow ,share and like, thank you! ❤️
GBP/JPY Short Opportunity: Capitalizing on Channel Structure andI have created this GBP/JPY short market idea due to the favorable technical setup observed in the chart. The currency pair has been trading within a downward channel and the previous high presents an ideal point of entry for a short position. The liquidity at the previous high, indicated by the volume profile, adds to the confluence of factors supporting this trade idea. The downward channel structure combined with the high liquidity at the previous high provides a strong basis for my decision to initiate a short position in the GBP/JPY market.
Please note that this is not investment advice and past performance is not a guarantee of future results. Trading always carries risk and it's important to conduct thorough research and analysis before making any trading decisions. Thank you for your attention.

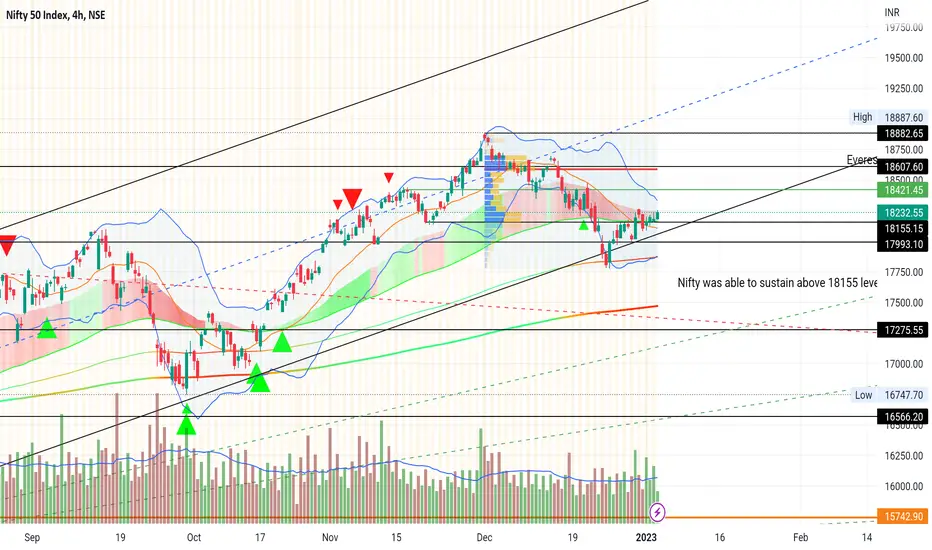
Nifty trade ideasNifty was able to sustain above 18155 level heading towards 18350-18400 level tomorrow if it stays above 18250. Am a bit concerned about intraday move because of price nearing top band of Bollinger but still there is room for movement. Will be looking for long/call opportunities and targets18300-350-400. Hence my overall view for tomorrow is bullish.
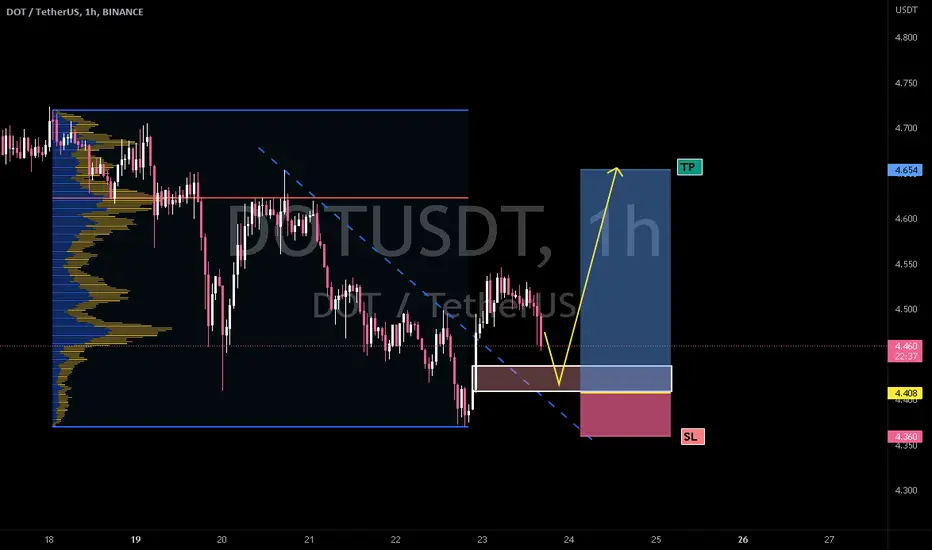
CRYPTO | DOTUSDT -DECRYPTERSHi people Welcome to Team Decrypters
It's a Risky Trade plz follow the money management
--Entry should be in Box or nearby
--STOPLOSS AND TP IS GIVE IN CHART
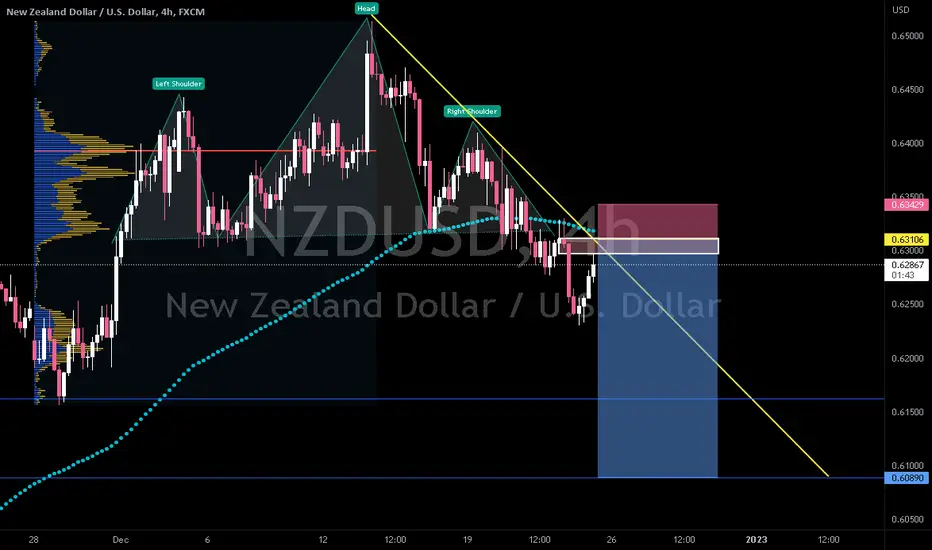
NZDUSD| Detail Analysis | DECRYPTERSHi people welcome ,Greeting to Team decrypters
Several Reasons for Short
1-Butterfly pattern on Daily.
2-BOS followed by down ward trendline .
3-Rejjection of 100 EMA .
4-Volume profile Rejection ( moving from VAH to VAL.
5-Rejection from 0.618 Fib level .
6-H&S break down retest and continuation.
7-Resistance broke + Retest.
8-Weekly resistance .
9-weekly Divergence.
10-weekly overbought.
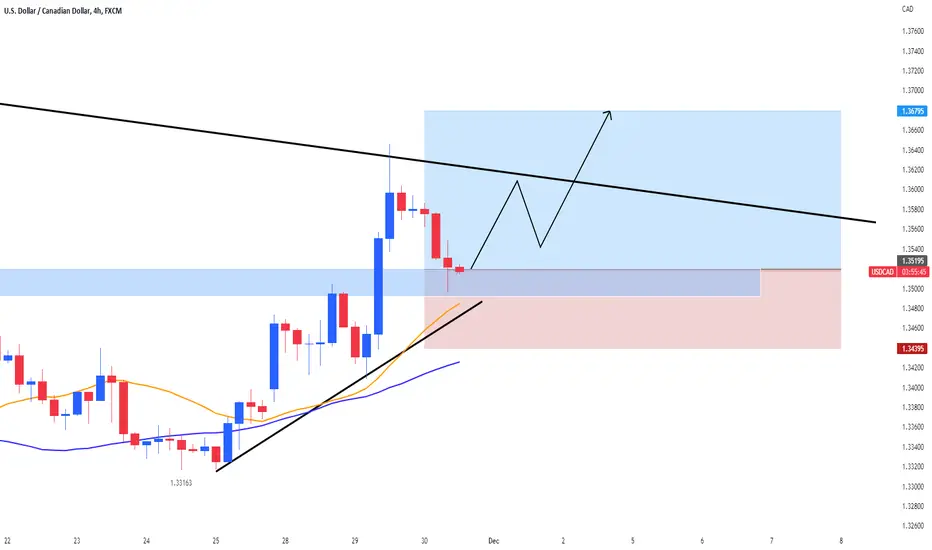
USDCAD | Looks like a pretty good BUYHello Traders,
USDCAD looks like a decent buy, a nice little rejection to the moving averages on the 4h timeframe with a 1h bullish engulfing candlestick closure.
All timeframes are trending toward the upside as well which shows bullish pressure.
High impact speech coming up later on today, make sure to manage your risk, peace! :)
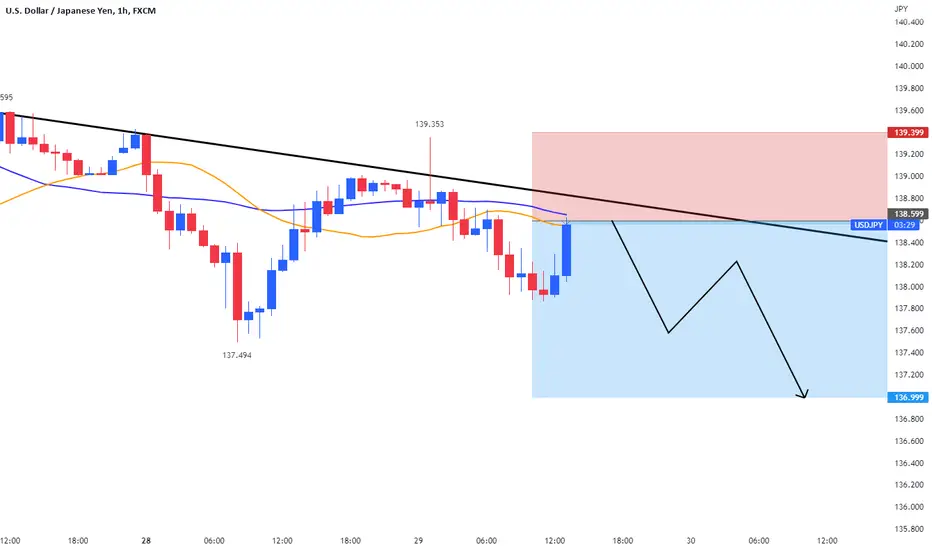
USDJPY | THIS COULD BE A GOOD IF WE GETHello Traders,
This trade has potential if we get a solid rejection so waiting for a bearish engulfing candlestick or a shooting star would be best.
This would confirm bearish momentum is here to stay and we could ride the wave further down.