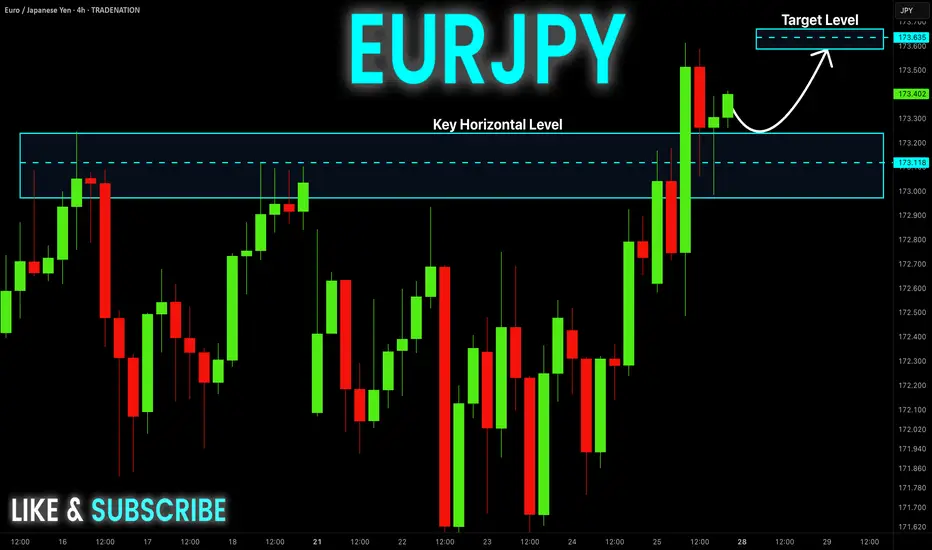
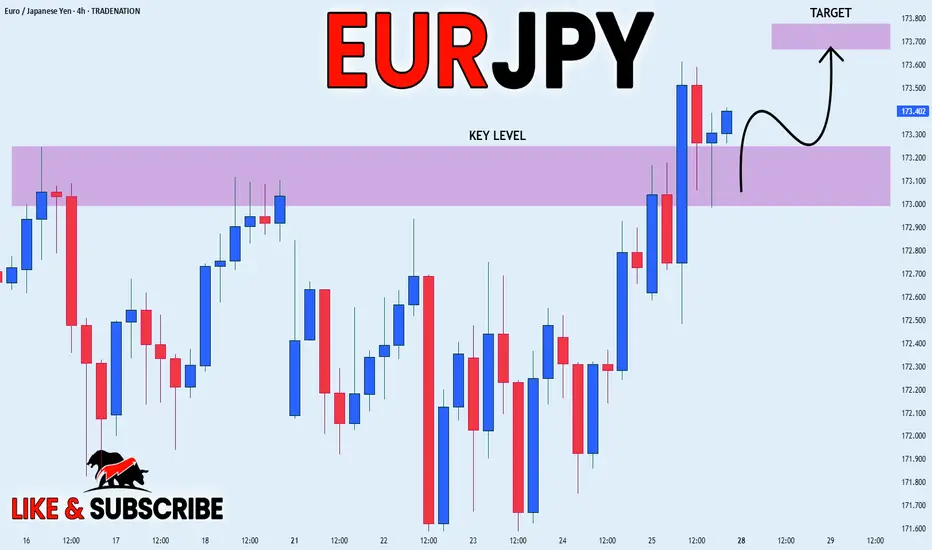
EUR-JPY Local Long! Buy!
Hello,Traders!
EUR-JPY is trading in an
Uptrend and the pair made
A breakout, a retest and
A bullish rebound from the
Horizontal support of 173.200
So we are bullish biased and
We will be expecting a
Further bullish move up
On Monday!
Buy!
Comment and subscribe to help us grow!
Check out other forecasts below too!
Disclosure: I am part of Trade Nation's Influencer program and receive a monthly fee for using their TradingView charts in my analysis.
Trading
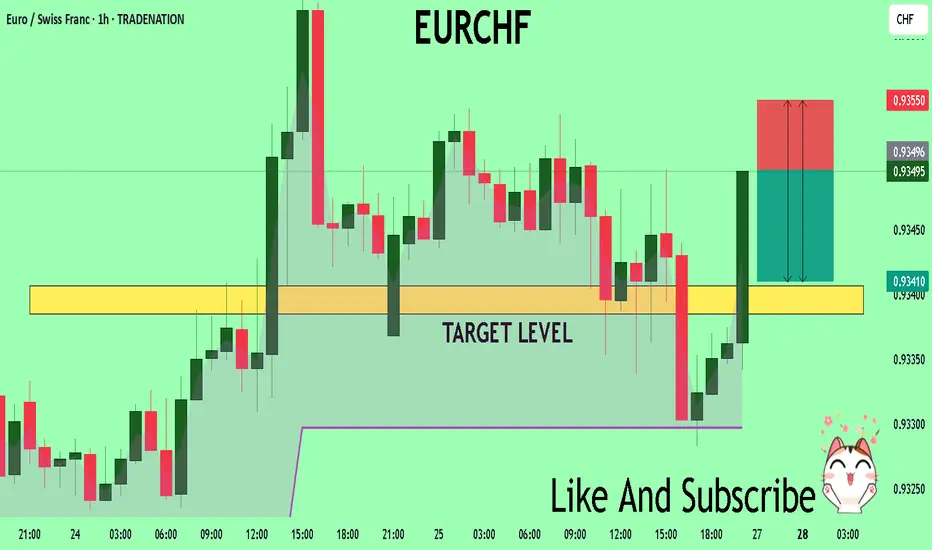
EURCHF Set To Fall! SELL!
My dear friends,
My technical analysis for EURCHF is below:
The market is trading on 0.9349 pivot level.
Bias - Bearish
Technical Indicators: Both Super Trend & Pivot HL indicate a highly probable Bearish continuation.
Target - 0.9340
Recommended Stop Loss - 0.9355
About Used Indicators:
A pivot point is a technical analysis indicator, or calculations, used to determine the overall trend of the market over different time frames.
Disclosure: I am part of Trade Nation's Influencer program and receive a monthly fee for using their TradingView charts in my analysis.
———————————
WISH YOU ALL LUCK
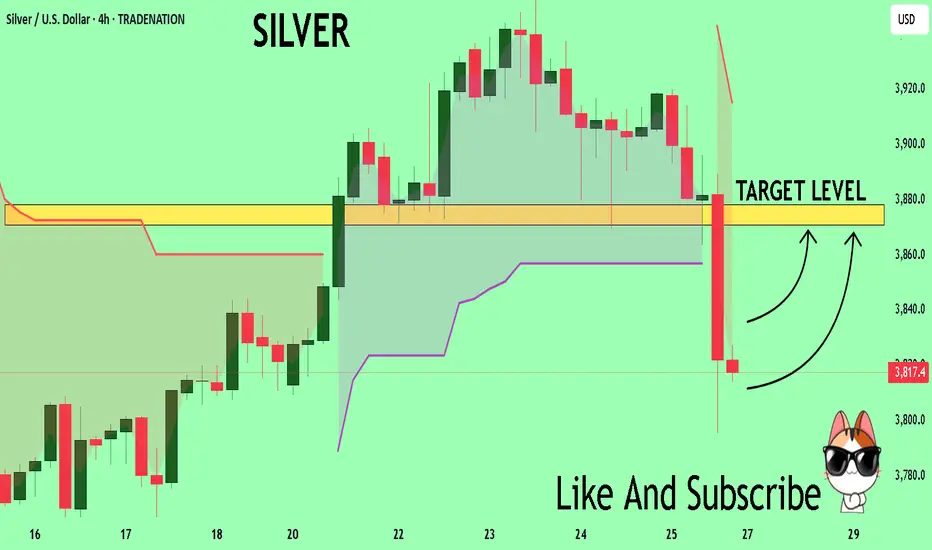
SILVER Trading Opportunity! BUY!
My dear friends,
Please, find my technical outlook for SILVER below:
The price is coiling around a solid key level - 38.174
Bias - Bearish
Technical Indicators: Pivot Points High anticipates a potential price reversal.
Super trend shows a clear sell, giving a perfect indicators' convergence.
Goal - 38.708
About Used Indicators:
The pivot point itself is simply the average of the high, low and closing prices from the previous trading day.
Disclosure: I am part of Trade Nation's Influencer program and receive a monthly fee for using their TradingView charts in my analysis.
———————————
WISH YOU ALL LUCK
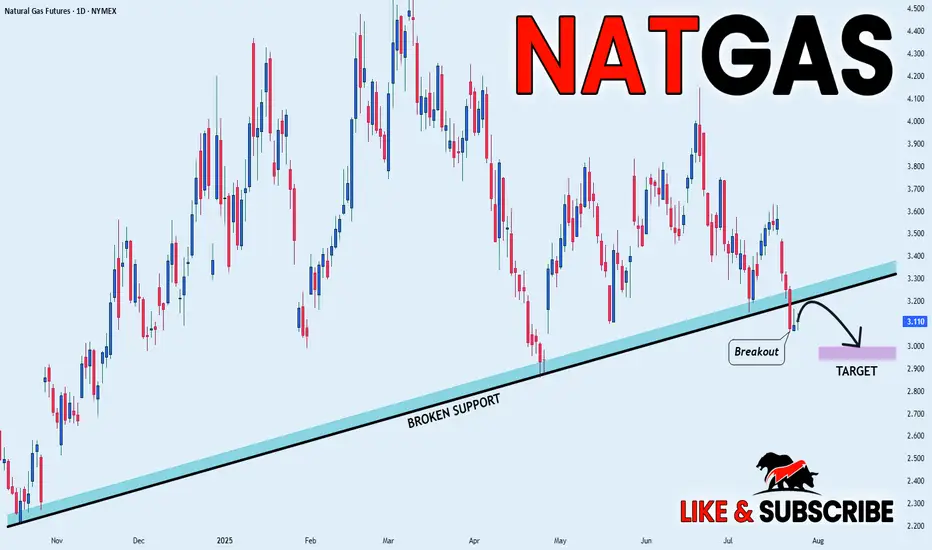
NATGAS BEARISH BREAKOUT|SHORT|
✅NATGAS broke the rising support
While trading in an local downtrend
Which makes me bearish
And I think that after the retest of the broken line is complete
A rebound and bearish continuation will follow
SHORT🔥
✅Like and subscribe to never miss a new idea!✅
Disclosure: I am part of Trade Nation's Influencer program and receive a monthly fee for using their TradingView charts in my analysis.
EURCAD The Target Is DOWN! SELL!
My dear subscribers,
EURCAD looks like it will make a good move, and here are the details:
The market is trading on 1.6089 pivot level.
Bias - Bearish
My Stop Loss - 1.6104
Technical Indicators: Both Super Trend & Pivot HL indicate a highly probable Bearish continuation.
Target - 1.6061
About Used Indicators:
The average true range (ATR) plays an important role in 'Supertrend' as the indicator uses ATR to calculate its value. The ATR indicator signals the degree of price volatility.
Disclosure: I am part of Trade Nation's Influencer program and receive a monthly fee for using their TradingView charts in my analysis.
———————————
WISH YOU ALL LUCK

CMPR is ready for $53It will soon go to $53 I assume. Only question is quarterly releasing on 29th of July so in case things go wrong below $44 is not wanted.

USDCAD Analysis week 31🌐Fundamental Analysis
The Canadian dollar continued to decline against the US dollar on Friday. Trump returned to threatening tariffs on Canada as trade deals remain limited. The August 1 deadline for tariffs is approaching and Canada has not made much of a move so far.
🕯Technical Analysis
USDCAD continues to rally towards the 1.4000 resistance zone. A recovery of the pair to 1.365 is a good momentum for USDCAD to break the trendline and break 1.37700. The trading strategy for next week is mainly to look for BUY points when there is a recovery of the wave structure. If the important support of the week 1.357 is broken, the uptrend will reverse.
📈📉Trading Signals
BUY USDCAD 1.365-1.363 Stoploss 1.360
BUY Break out 1.37700

USDJPY Will Fall! Short!
Take a look at our analysis for USDJPY.
Time Frame: 1D
Current Trend: Bearish
Sentiment: Overbought (based on 7-period RSI)
Forecast: Bearish
The price is testing a key resistance 147.661.
Taking into consideration the current market trend & overbought RSI, chances will be high to see a bearish movement to the downside at least to 145.139 level.
P.S
The term oversold refers to a condition where an asset has traded lower in price and has the potential for a price bounce.
Overbought refers to market scenarios where the instrument is traded considerably higher than its fair value. Overvaluation is caused by market sentiments when there is positive news.
Disclosure: I am part of Trade Nation's Influencer program and receive a monthly fee for using their TradingView charts in my analysis.
Like and subscribe and comment my ideas if you enjoy them!

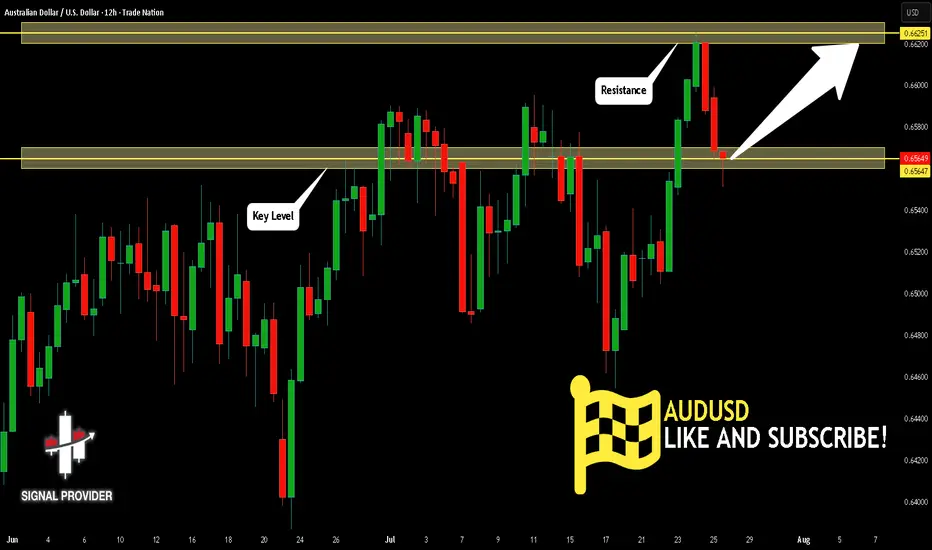
AUDUSD Will Go Higher From Support! Buy!
Please, check our technical outlook for AUDUSD.
Time Frame: 12h
Current Trend: Bullish
Sentiment: Oversold (based on 7-period RSI)
Forecast: Bullish
The market is trading around a solid horizontal structure 0.656.
The above observations make me that the market will inevitably achieve 0.662 level.
P.S
We determine oversold/overbought condition with RSI indicator.
When it drops below 30 - the market is considered to be oversold.
When it bounces above 70 - the market is considered to be overbought.
Disclosure: I am part of Trade Nation's Influencer program and receive a monthly fee for using their TradingView charts in my analysis.
Like and subscribe and comment my ideas if you enjoy them!
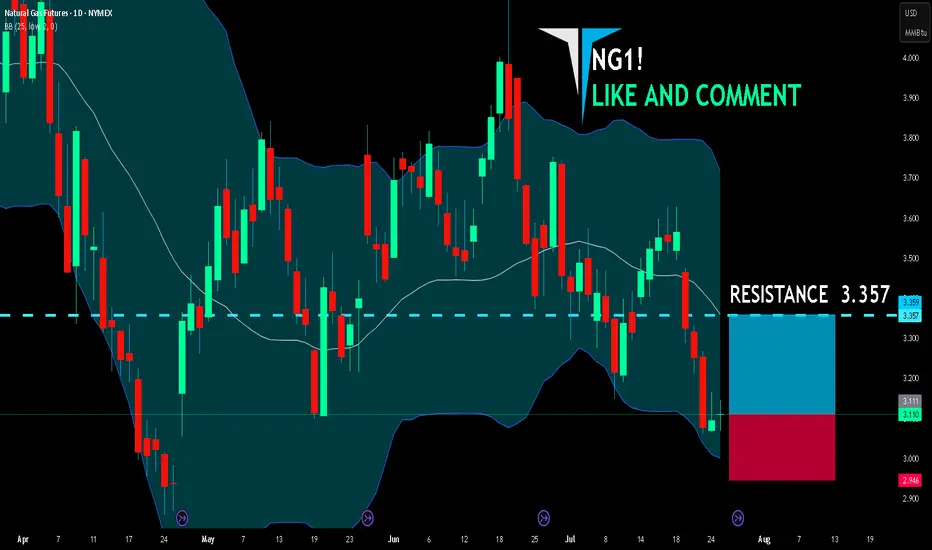
NG1! BEST PLACE TO BUY FROM|LONG
NG1! SIGNAL
Trade Direction: long
Entry Level: 3.111
Target Level: 3.357
Stop Loss: 2.946
RISK PROFILE
Risk level: medium
Suggested risk: 1%
Timeframe: 1D
Disclosure: I am part of Trade Nation's Influencer program and receive a monthly fee for using their TradingView charts in my analysis.
✅LIKE AND COMMENT MY IDEAS✅
NZD/JPY BEARS ARE STRONG HERE|SHORT
Hello, Friends!
Previous week’s green candle means that for us the NZD/JPY pair is in the uptrend. And the current movement leg was also up but the resistance line will be hit soon and upper BB band proximity will signal an overbought condition so we will go for a counter-trend short trade with the target being at 88.302.
Disclosure: I am part of Trade Nation's Influencer program and receive a monthly fee for using their TradingView charts in my analysis.
✅LIKE AND COMMENT MY IDEAS✅

EURUSD: Detailed Support Resistance Analysis For Next Week
Here is my latest support & resistance analysis for EURUSD
for next week.
Consider these structures for pullback/breakout trading.
❤️Please, support my work with like, thank you!❤️
I am part of Trade Nation's Influencer program and receive a monthly fee for using their TradingView charts in my analysis.

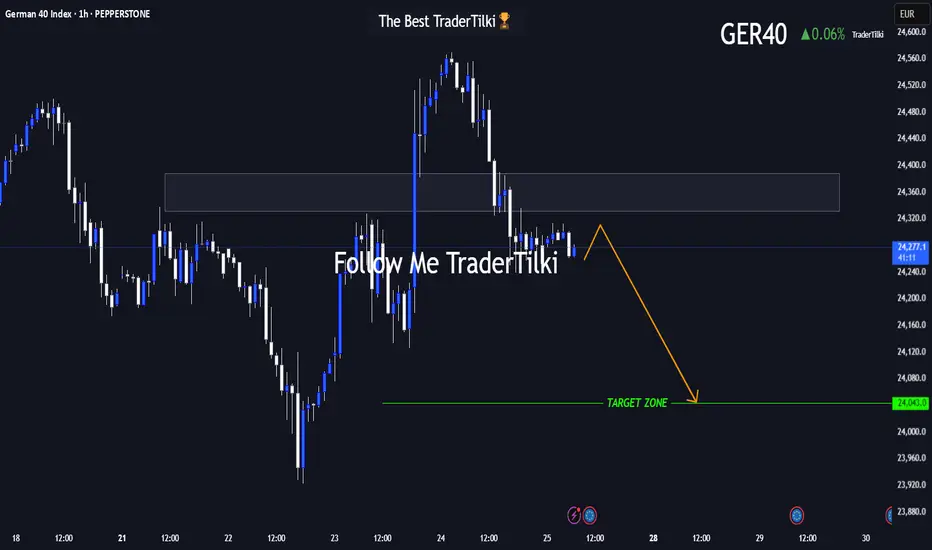
GER40 in Motion: This Setup Speaks Volumes 🌅 Good morning, my friends,
I’ve put together a fresh GER40 analysis just for you. Even if the 1-hour timeframe shows some upward momentum, I fully expect the price to reach my target level of **24,050**.
I'm holding firm until that level is hit.
Every single like from you is a massive source of motivation for me to keep sharing analysis. Huge thanks to everyone supporting with a tap!
CHF_JPY RISKY SHORT|
✅CHF_JPY is going up now
But a strong resistance level is ahead at 186.036
Thus I am expecting a pullback
And a move down towards the target of 185.329
SHORT🔥
✅Like and subscribe to never miss a new idea!✅
Disclosure: I am part of Trade Nation's Influencer program and receive a monthly fee for using their TradingView charts in my analysis.

CAD-CHF Local Rebound Ahead! Buy!
Hello,Traders!
CAD-CHF made a retest
Of the horizontal support
At 0.5797 from where we
Are already seeing a bullish
Reaction so we will be
Expecting a further local
Bullish move up
Buy!
Comment and subscribe to help us grow!
Check out other forecasts below too!
Disclosure: I am part of Trade Nation's Influencer program and receive a monthly fee for using their TradingView charts in my analysis.

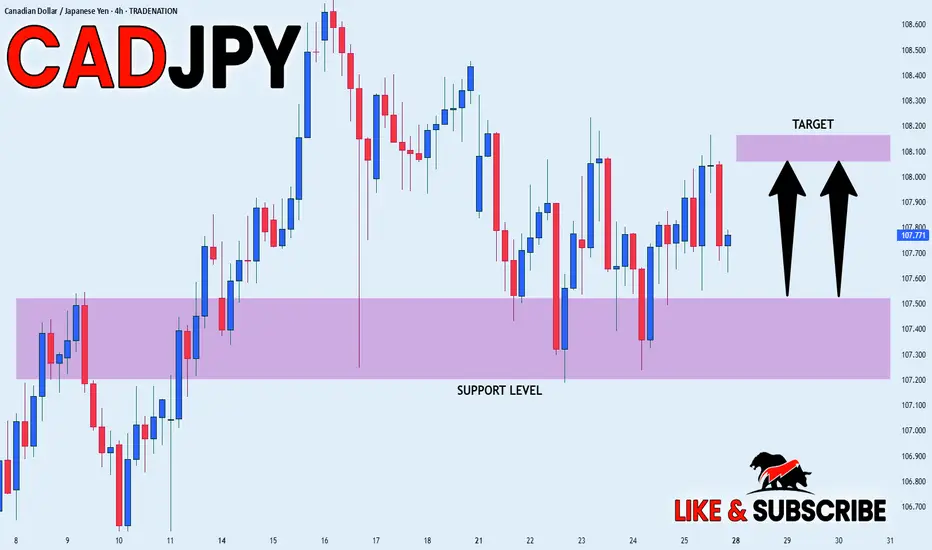
CAD_JPY WILL GO UP|LONG|
✅CAD_JPY will soon retest a key support level of 107.500
So I think that the pair will make a rebound
And go up to retest the supply level above at 108.100
LONG🚀
✅Like and subscribe to never miss a new idea!✅
Disclosure: I am part of Trade Nation's Influencer program and receive a monthly fee for using their TradingView charts in my analysis.
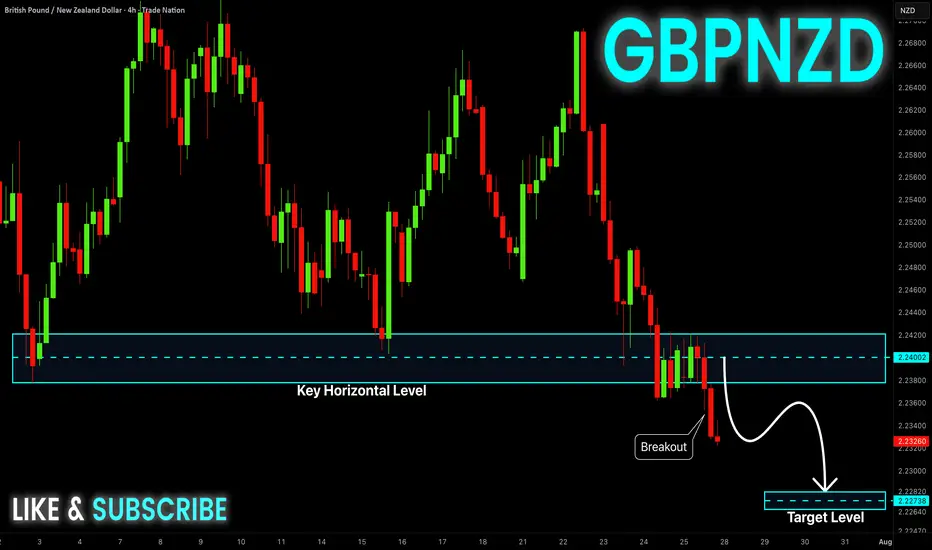
GBP-NZD Will Keep Falling! Sell!
Hello,Traders!
GBP-NZD keeps falling down
And the pair made a strong
Bearish breakout of the key
Horizontal key level of 2.2400
And the breakout is confirmed
So we are bearish biased and
We will be expecting a further
Bearish move down on Monday
Sell!
Comment and subscribe to help us grow!
Check out other forecasts below too!
Disclosure: I am part of Trade Nation's Influencer program and receive a monthly fee for using their TradingView charts in my analysis.
EUR_JPY WILL GROW|LONG|
✅EUR_JPY will keep growing
Because the pair is in the uptrend
And recently broke the key level of 173.200
So we will be expecting
Bullish continuation
LONG🚀
✅Like and subscribe to never miss a new idea!✅
Disclosure: I am part of Trade Nation's Influencer program and receive a monthly fee for using their TradingView charts in my analysis.
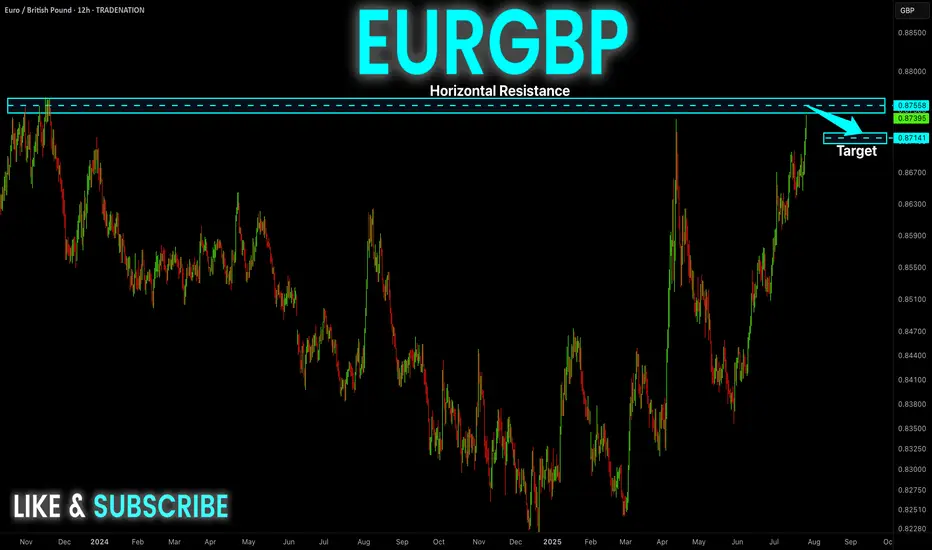
EUR-GBP Swing Short! Sell!
Hello,Traders!
EUR-GBP keeps growing in
A strong uptrend but the pair
Is locally overbought so after
The price hits a horizontal
Resistance level of 0.8764
We will be expecting a
Local bearish correction
Sell!
Comment and subscribe to help us grow!
Check out other forecasts below too!
Disclosure: I am part of Trade Nation's Influencer program and receive a monthly fee for using their TradingView charts in my analysis.
USOIL: Next Move Is Up! Long!
My dear friends,
Today we will analyse USOIL together☺️
The market is at an inflection zone and price has now reached an area around 65.029 where previous reversals or breakouts have occurred.And a price reaction that we are seeing on multiple timeframes here could signal the next move up so we can enter on confirmation, and target the next key level of 65.579.Stop-loss is recommended beyond the inflection zone.
❤️Sending you lots of Love and Hugs❤️

NG1!: Target Is Up! Long!
My dear friends,
Today we will analyse NG1! together☺️
The price is near a wide key level
and the pair is approaching a significant decision level of 3.087 Therefore, a strong bullish reaction here could determine the next move up.We will watch for a confirmation candle, and then target the next key level of 3.107.Recommend Stop-loss is beyond the current level.
❤️Sending you lots of Love and Hugs❤️

NI225: Move Down Expected! Short!
My dear friends,
Today we will analyse NI225 together☺️
The recent price action suggests a shift in mid-term momentum. A break below the current local range around 41,456.23 will confirm the new direction downwards with the target being the next key level of 40,954.70 and a reconvened placement of a stop-loss beyond the range.
❤️Sending you lots of Love and Hugs❤️

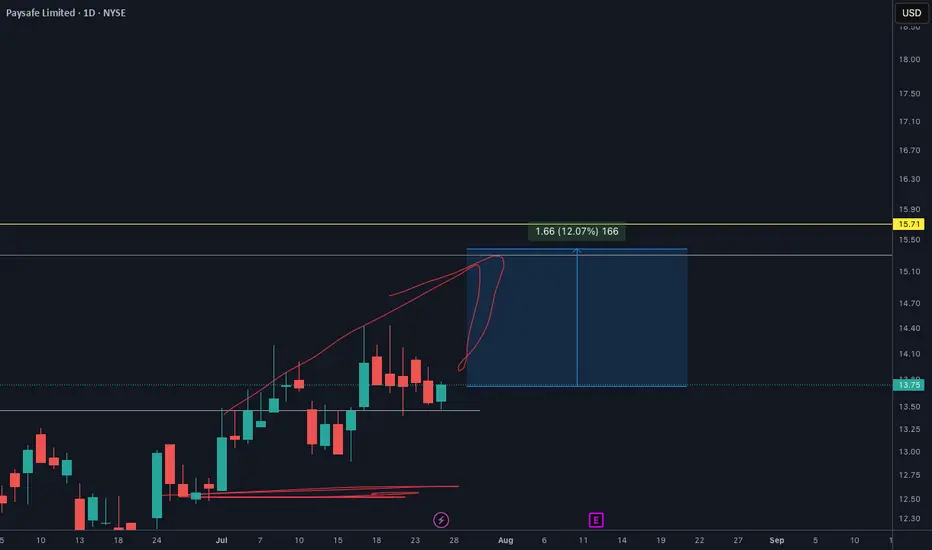
PSFE will EXPLODE soon. Make sure you check out my analysisPSFE price target is definetly $15.30. And It will happen so soon I see.
I shared this one on my youtube channel and X as well. You make sure go to my profile and follow for more.