QQQ Massive Short! SELL!
My dear followers,
This is my opinion on the QQQ next move:
The asset is approaching an important pivot point 566.35
Bias - Bearish
Safe Stop Loss - 567.41
Technical Indicators: Supper Trend generates a clear short signal while Pivot Point HL is currently determining the overall Bearish trend of the market.
Goal - 564.18
About Used Indicators:
For more efficient signals, super-trend is used in combination with other indicators like Pivot Points.
Disclosure: I am part of Trade Nation's Influencer program and receive a monthly fee for using their TradingView charts in my analysis.
———————————
WISH YOU ALL LUCK
Trading

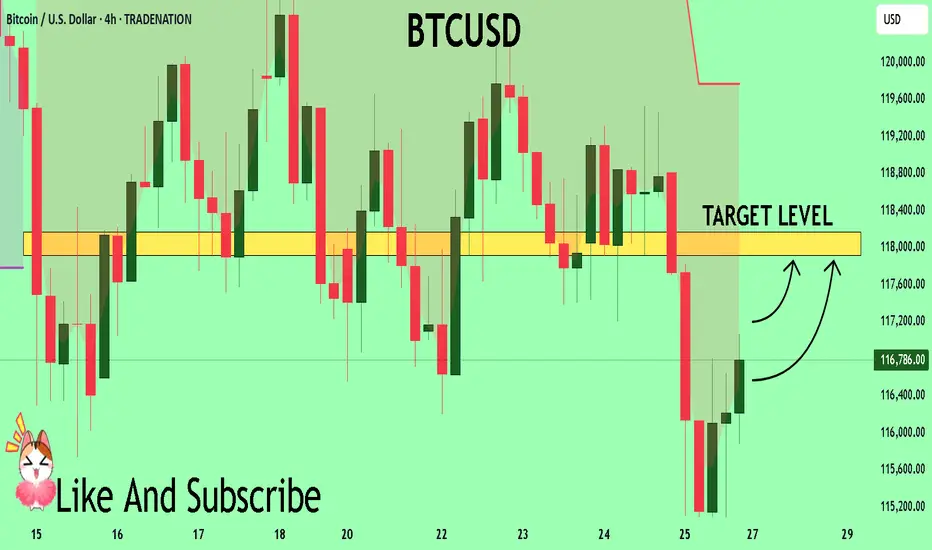
BTCUSD What Next? BUY!
My dear friends,
Please, find my technical outlook for BTCUSD below:
The price is coiling around a solid key level - 11678
Bias - Bullish
Technical Indicators: Pivot Points High anticipates a potential price reversal.
Super trend shows a clear buy, giving a perfect indicators' convergence.
Goal - 11791
About Used Indicators:
The pivot point itself is simply the average of the high, low and closing prices from the previous trading day.
Disclosure: I am part of Trade Nation's Influencer program and receive a monthly fee for using their TradingView charts in my analysis.
———————————
WISH YOU ALL LUCK
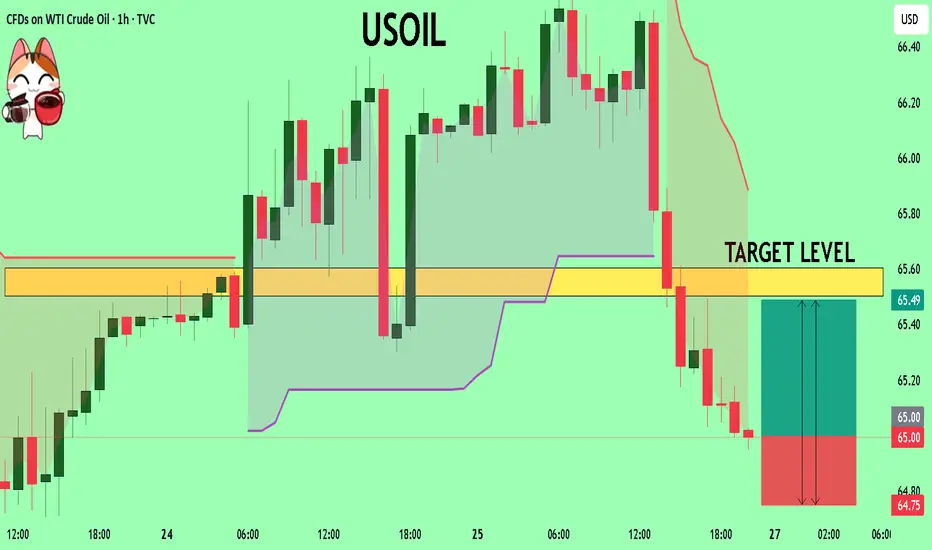
USOIL My Opinion! BUY!
My dear friends,
Please, find my technical outlook for USOIL below:
The instrument tests an important psychological level 65.00
Bias - Bullish
Technical Indicators: Supper Trend gives a precise Bullish signal, while Pivot Point HL predicts price changes and potential reversals in the market.
Target - 65.50
Recommended Stop Loss - 64.75
About Used Indicators:
Super-trend indicator is more useful in trending markets where there are clear uptrends and downtrends in price.
Disclosure: I am part of Trade Nation's Influencer program and receive a monthly fee for using their TradingView charts in my analysis.
———————————
WISH YOU ALL LUCK
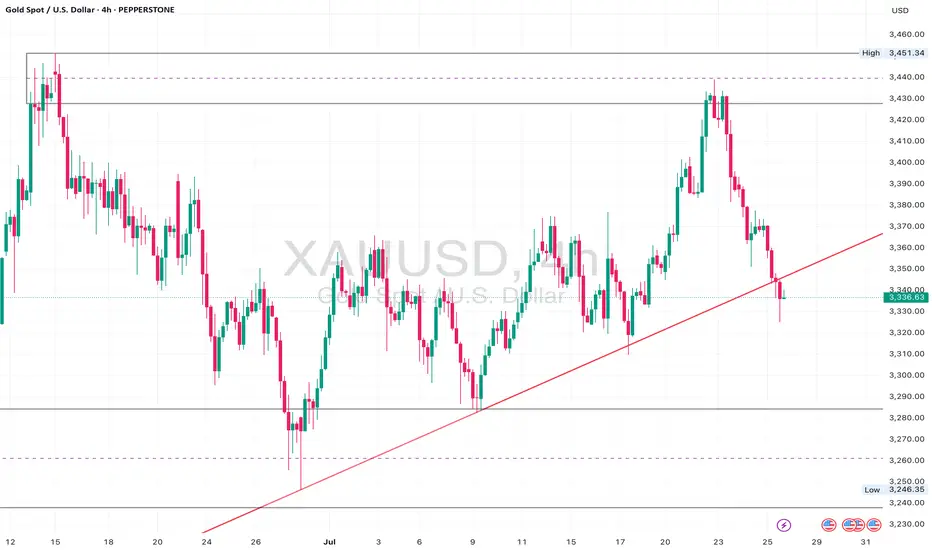
Gold Approaching 3365 Breakout: Bullish Continuation Above TrendDaily Analysis:
Price is respecting the long-term trendline support and still holding firmly above the 3300 region. Bulls are defending structure with a clean series of higher lows. No major change in trend as long as price remains above 3246.
4H Analysis:
Price is consolidating above the trendline and building structure around 3350. A clean break and close above 3365 could ignite a push toward the 3450 supply zone.
1H Analysis:
Descending trendline break confirmed with bullish closure. Retest holding well above 3350. If structure remains intact, next short-term target is 3375–3390.
Confirmation & Entry:
Break and close above 3365 with strong bullish candle = confirmation. Optional entry on 3350–3355 retest. Targets: 3390, 3450.
S&P 500 Daily Chart Analysis For Week of July 25, 2025Technical Analysis and Outlook:
In the trading activity observed last week, the S&P 500 Index exhibited a predominantly upward trajectory. It traded around the Key Resistance level of 6314. It successfully broke through this level, with the primary objective being to complete the Outer Index Rally at 6420, as outlined in the previous week's Daily Chart Analysis.
It is crucial to acknowledge that the current price movement may prompt a substantial pullback following the completion of the Outer Index Rally, with the main target identified as the Mean Support level of 6309. Following this potential downward adjustment, it is anticipated that the index will resume its upward trend, targeting a retest of the forthcoming completion of the Outer Index Rally at 6420.

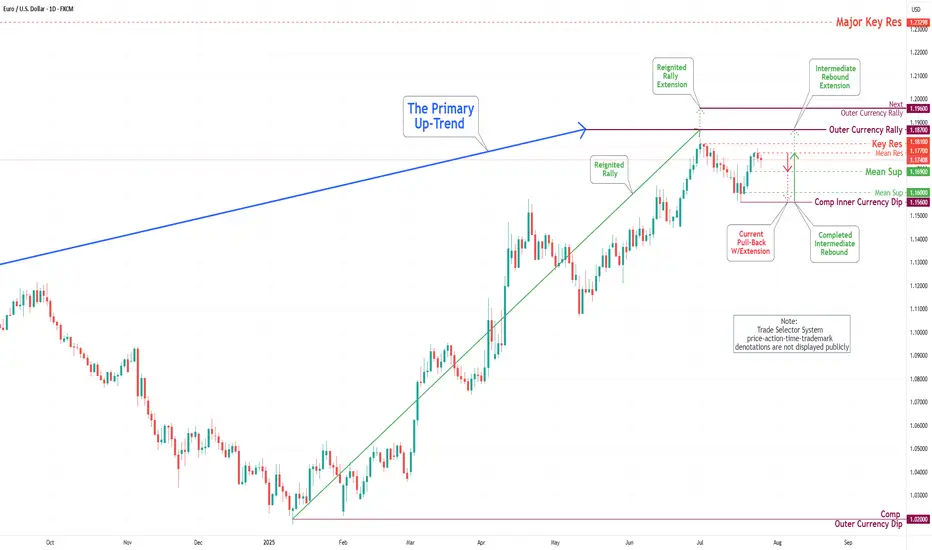
EUR/USD Daily Chart Analysis For Week of July 25, 2025Technical Analysis and Outlook:
During the previous week's trading session, the Euro experienced an increase following the completion of the Inner Currency Dip at the 1.156 level. It subsequently surpassed two significant Mean Resistance levels, namely 1.167 and 1.172; however, it reversed direction by the conclusion of the trading week. Recent analyses indicate that the Euro is likely to undergo a sustained downward trend, with a projected target set at the Mean Support level of 1.169 and a potential further decline to retest the previously completed Currency Dip at 1.156. Nonetheless, it remains essential to consider the possibility of renewed upward momentum towards the Mean Resistance level of 1.177, which could initiate a preeminent rebound and facilitate the completion of the critical Outer Currency Rally at 1.187.
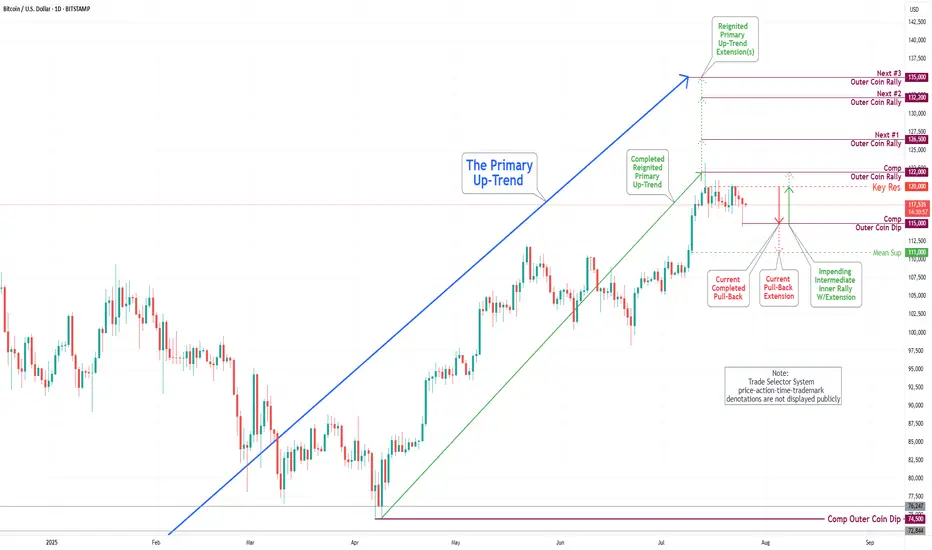
Bitcoin(BTC/USD) Daily Chart Analysis For Week of July 25, 2025Technical Analysis and Outlook:
In the trading session of the previous week, the Bitcoin market exhibited considerable volatility as it retested the Key Resistance level at 120000. On the lower end of the spectrum, the market engaged with the Mean Support levels at 117500 and 115900, culminating in the completion of the Outer Coin Dip at 115000. Currently, the coin is poised to retest the Key Resistance at 120000 once again. This anticipated rebound will necessitate a retest of the completed Outer Coin Rally at 122000. The additional target levels for the renewed Primary Up-Trend are 126500, 132200, and 135000.
ETHUSD Will Go Down From Resistance! Sell!
Here is our detailed technical review for ETHUSD.
Time Frame: 1D
Current Trend: Bearish
Sentiment: Overbought (based on 7-period RSI)
Forecast: Bearish
The market is testing a major horizontal structure 3,641.87.
Taking into consideration the structure & trend analysis, I believe that the market will reach 2,871.15 level soon.
P.S
Overbought describes a period of time where there has been a significant and consistent upward move in price over a period of time without much pullback.
Disclosure: I am part of Trade Nation's Influencer program and receive a monthly fee for using their TradingView charts in my analysis.
Like and subscribe and comment my ideas if you enjoy them!

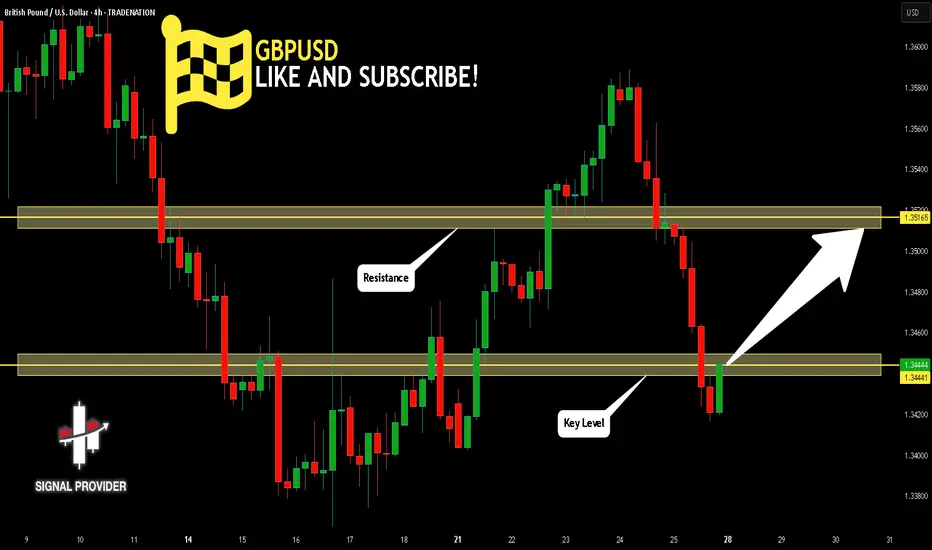
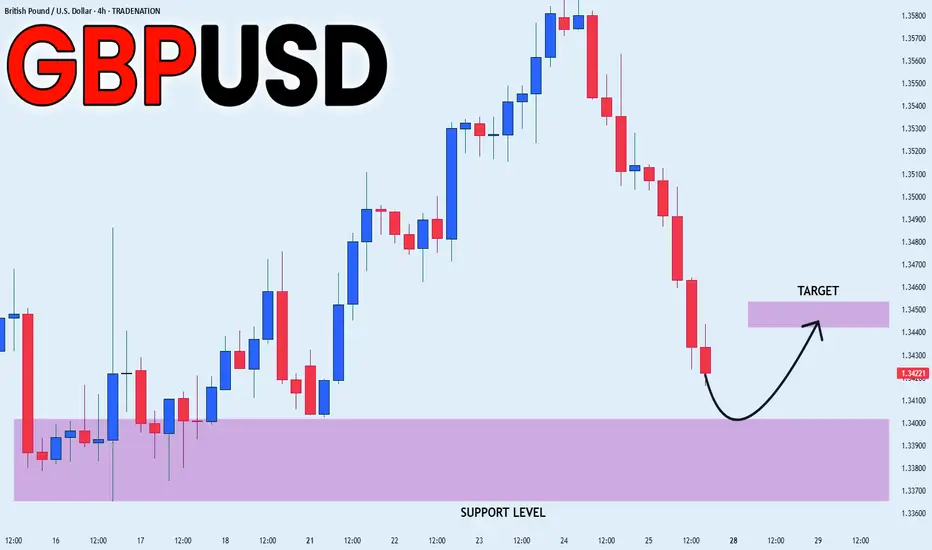
GBPUSD Will Go Higher! Long!
Take a look at our analysis for GBPUSD.
Time Frame: 4h
Current Trend: Bullish
Sentiment: Oversold (based on 7-period RSI)
Forecast: Bullish
The market is approaching a key horizontal level 1.344.
Considering the today's price action, probabilities will be high to see a movement to 1.351.
P.S
Please, note that an oversold/overbought condition can last for a long time, and therefore being oversold/overbought doesn't mean a price rally will come soon, or at all.
Disclosure: I am part of Trade Nation's Influencer program and receive a monthly fee for using their TradingView charts in my analysis.
Like and subscribe and comment my ideas if you enjoy them!
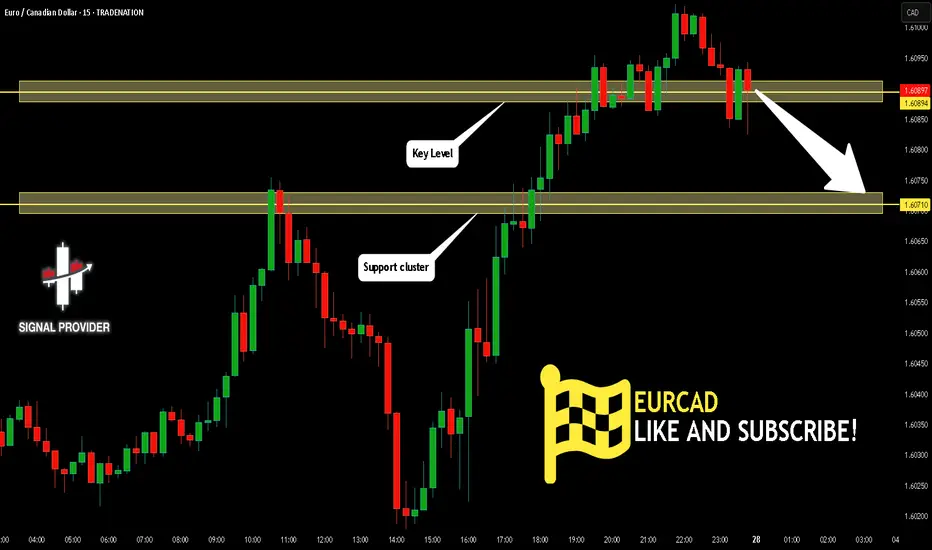
EURCAD Will Go Down! Short!
Please, check our technical outlook for EURCAD.
Time Frame: 15m
Current Trend: Bearish
Sentiment: Overbought (based on 7-period RSI)
Forecast: Bearish
The market is approaching a significant resistance area 1.608.
Due to the fact that we see a positive bearish reaction from the underlined area, I strongly believe that sellers will manage to push the price all the way down to 1.607 level.
P.S
The term oversold refers to a condition where an asset has traded lower in price and has the potential for a price bounce.
Overbought refers to market scenarios where the instrument is traded considerably higher than its fair value. Overvaluation is caused by market sentiments when there is positive news.
Disclosure: I am part of Trade Nation's Influencer program and receive a monthly fee for using their TradingView charts in my analysis.
Like and subscribe and comment my ideas if you enjoy them!
CAD/JPY BEARS WILL DOMINATE THE MARKET|SHORT
Hello, Friends!
CAD-JPY uptrend evident from the last 1W green candle makes short trades more risky, but the current set-up targeting 106.478 area still presents a good opportunity for us to sell the pair because the resistance line is nearby and the BB upper band is close which indicates the overbought state of the CAD/JPY pair.
Disclosure: I am part of Trade Nation's Influencer program and receive a monthly fee for using their TradingView charts in my analysis.
✅LIKE AND COMMENT MY IDEAS✅

AUD/JPY SENDS CLEAR BEARISH SIGNALS|SHORT
Hello, Friends!
AUD/JPY pair is in the uptrend because previous week’s candle is green, while the price is clearly rising on the 4H timeframe. And after the retest of the resistance line above I believe we will see a move down towards the target below at 96.380 because the pair overbought due to its proximity to the upper BB band and a bearish correction is likely.
Disclosure: I am part of Trade Nation's Influencer program and receive a monthly fee for using their TradingView charts in my analysis.
✅LIKE AND COMMENT MY IDEAS✅

GOLD BEARS ARE STRONG HERE|SHORT
GOLD SIGNAL
Trade Direction: short
Entry Level: 3,383.09
Target Level: 3,336.50
Stop Loss: 3,413.51
RISK PROFILE
Risk level: medium
Suggested risk: 1%
Timeframe: 12h
Disclosure: I am part of Trade Nation's Influencer program and receive a monthly fee for using their TradingView charts in my analysis.
✅LIKE AND COMMENT MY IDEAS✅

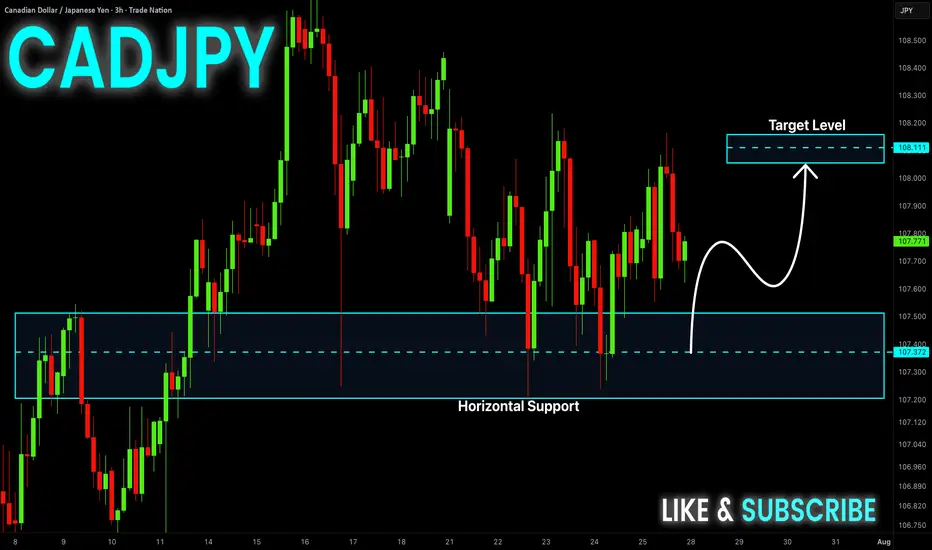
CAD-JPY Rebound Ahead! Buy!
Hello,Traders!
CAD-JPY made a retest
Of the horizontal support
Of 107.400 from where we
Are already seeing a bullish
Rebound and we will be
Expecting a further bullish
Move up
Buy!
Comment and subscribe to help us grow!
Check out other forecasts below too!
Disclosure: I am part of Trade Nation's Influencer program and receive a monthly fee for using their TradingView charts in my analysis.
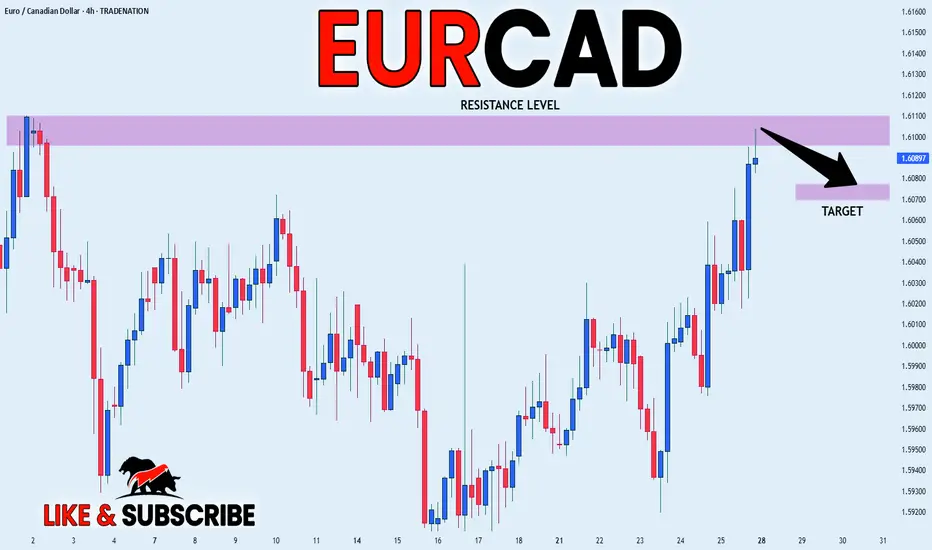
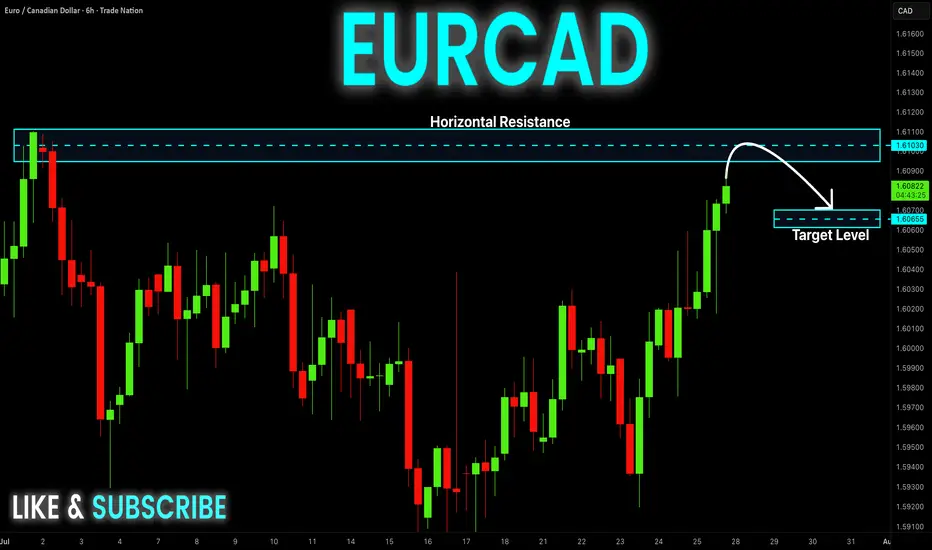
EUR_CAD LOCAL SHORT|
✅EUR_CAD is going up to retest
A horizontal resistance of 1.6110
Which makes me locally bearish biased
And I think that we will see a pullback
And a move down from the level
Towards the target below at 1.6077
SHORT🔥
✅Like and subscribe to never miss a new idea!✅
Disclosure: I am part of Trade Nation's Influencer program and receive a monthly fee for using their TradingView charts in my analysis.
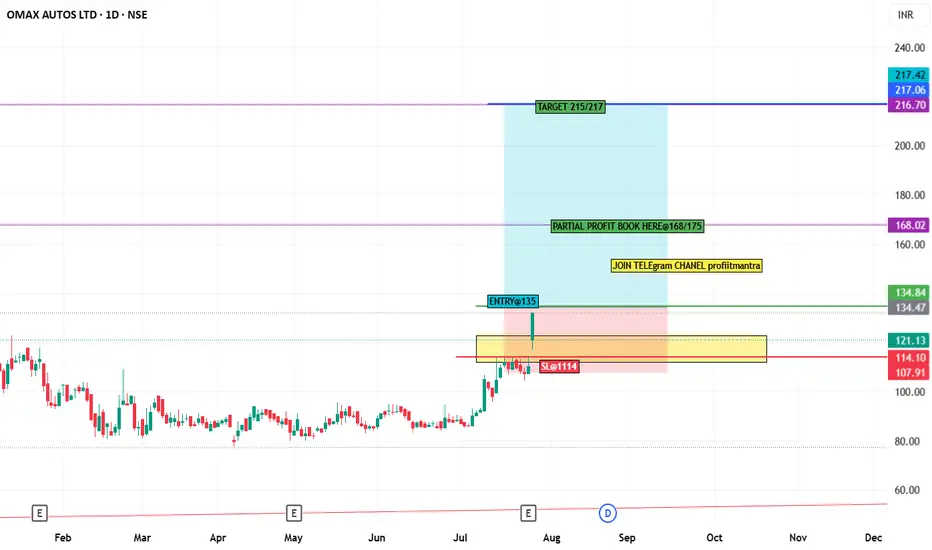
stock analysis OMAXAUTO stock chart analysis
in chart gave levels and when sl trigger then please don't hold and exit.
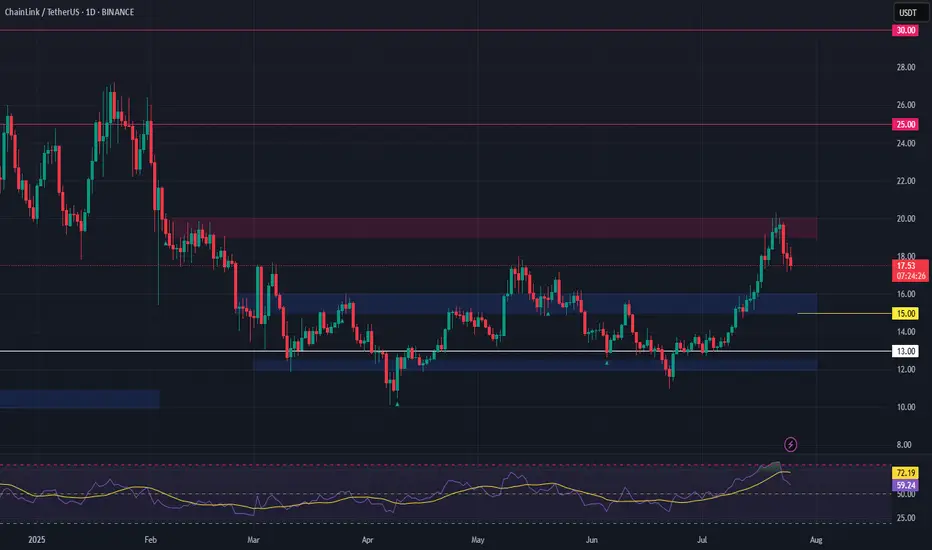
LINK Swing Trade – Watching for a PullbackLINK has rallied 58% since June 24th and is now consolidating after making a higher high. Price action is facing resistance and looks overheated, so a pullback toward support could offer a fresh long entry.
📌 Trade Plan:
• Entry Zone: $15.00 – $16.00 (on pullback)
• Take Profit Levels:
o 🥇 $20
o 🥈 $25
o 🥉 $30
• Stop Loss: Close below $13
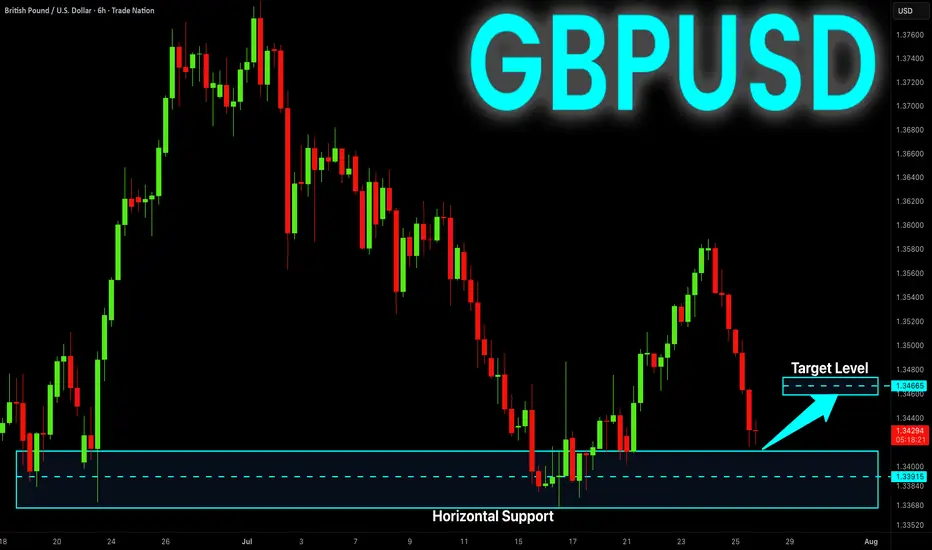
GBP_USD LONG FROM SUPPORT|
✅GBP_USD has been falling recently
And the pair seems locally oversold
So as the pair is approaching
A horizontal support of 1.3399
Price growth is to be expected
LONG🚀
✅Like and subscribe to never miss a new idea!✅
Disclosure: I am part of Trade Nation's Influencer program and receive a monthly fee for using their TradingView charts in my analysis.
EUR-CAD Risky Short! Sell!
Hello,Traders!
EUR-CAD is trading in a
Strong uptrend so we are
Bullish biased long-term
However a strong horizontal
Resistance is ahead at 1.6110
And the pair is overbought
So after the retest of the
Resistance we will be
Expecting a bearish correction
Sell!
Comment and subscribe to help us grow!
Check out other forecasts below too!
Disclosure: I am part of Trade Nation's Influencer program and receive a monthly fee for using their TradingView charts in my analysis.
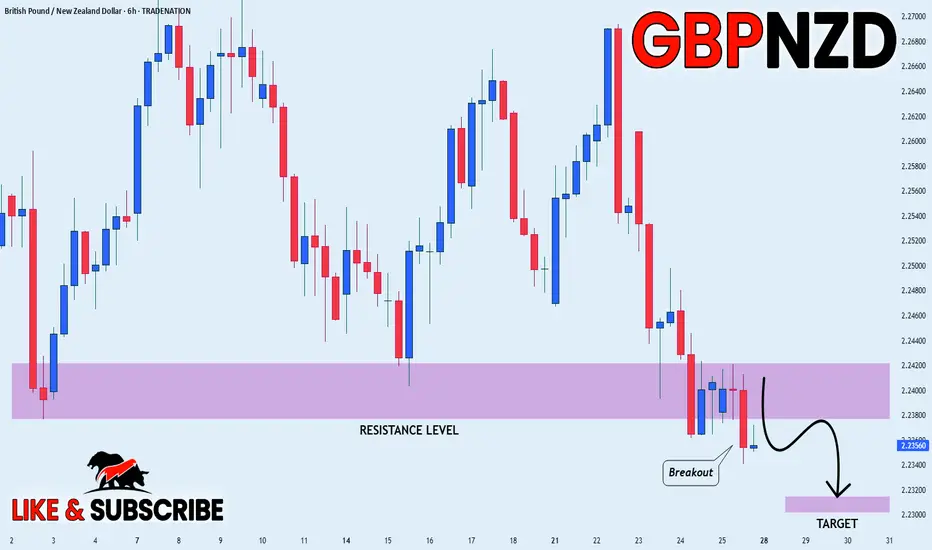
GBP_NZD BEARISH BREAKOUT|SHORT|
✅GBP_NZD is going down currently
As the pair broke the key structure level of 2.2400
Which is now a resistance, and after the pullback
And retest, I think the price will go further down
SHORT🔥
✅Like and subscribe to never miss a new idea!✅
Disclosure: I am part of Trade Nation's Influencer program and receive a monthly fee for using their TradingView charts in my analysis.
GBP-USD Support Ahead! Buy!
Hello,Traders!
GBP-USD went down but
The pair will soon hit a
Horizontal support level
Of 1.3400 from where we
Will be expecting a local
Rebound and a move up
Buy!
Comment and subscribe to help us grow!
Check out other forecasts below too!
Disclosure: I am part of Trade Nation's Influencer program and receive a monthly fee for using their TradingView charts in my analysis.
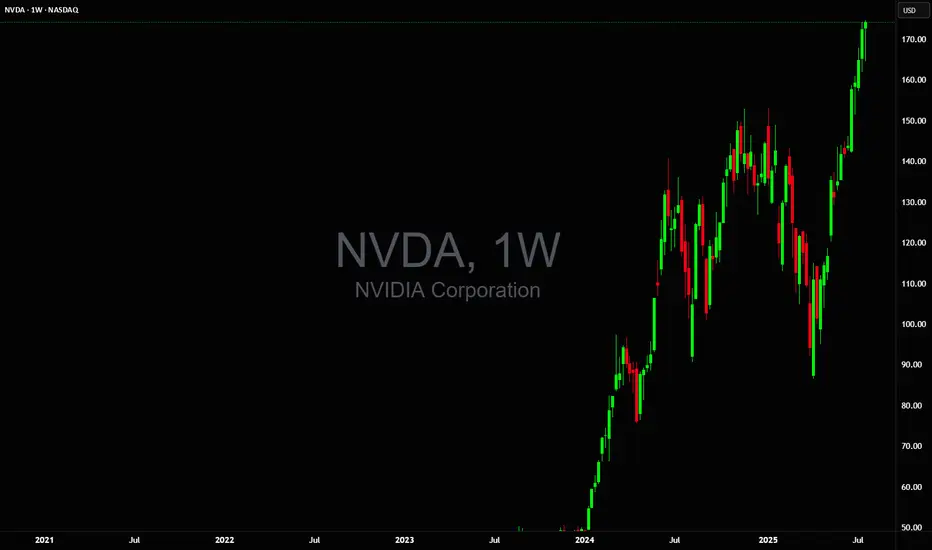
99% of people buying $NVDA don't understand this:🚨99% of people buying NASDAQ:NVDA don't understand this:
NASDAQ:GOOGL : “We’re boosting AI capex by $10B.”
Wall Street: “Cool, that’s like $1B or 0.06 per share for $NVDA.”
So from $170.50 at the time of news to $170.56 right?
No.
NASDAQ:NVDA trades at 98× earnings. So that $0.06? Turns into $6.00
Why?
Because people are expecting that to be happening every single year for 98 years and they're paying All of it Today in Full amount.
So NASDAQ:NVDA will get $1B more per year. But NASDAQ:NVDA price per share already increased by $100B in past 2 days 😂
Then it crashes 40% and everyone is wondering why.
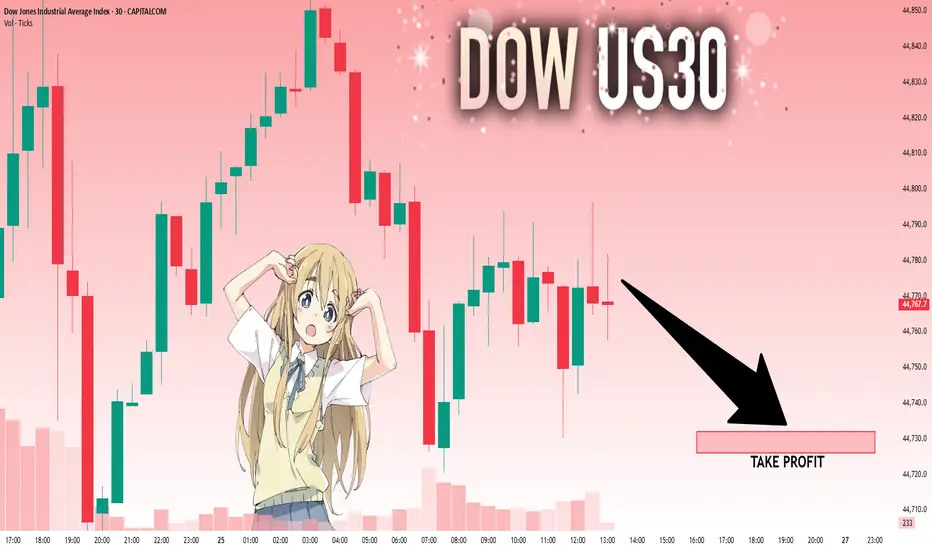
US30: Local Bearish Bias! Short!
My dear friends,
Today we will analyse US30 together☺️
The in-trend continuation seems likely as the current long-term trend appears to be strong, and price is holding below a key level of 44,774.9 So a bearish continuation seems plausible, targeting the next low. We should enter on confirmation, and place a stop-loss beyond the recent swing level.
❤️Sending you lots of Love and Hugs❤️