USDNOK short potential setupUSDNOK recently broke down below the monthly 50ema (overlayed on this 4h chart) and has rejected off the daily 20ema (overlayed) twice this week. RSI is showing bearish momentum after a brief overbought period while the PA has remained in a strong downtrend. Short setup potential is evident but not certain.
I'm a cat not a financial advisor.
Trading

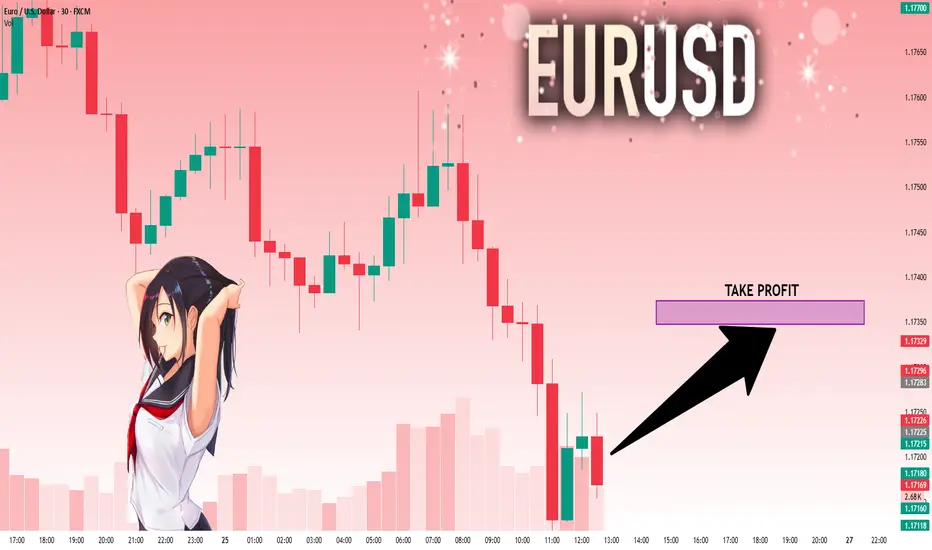
EURUSD: Will Go Up! Long!
My dear friends,
Today we will analyse EURUSD together☺️
The price is near a wide key level
and the pair is approaching a significant decision level of 1.17201 Therefore, a strong bullish reaction here could determine the next move up.We will watch for a confirmation candle, and then target the next key level of 1.17348.Recommend Stop-loss is beyond the current level.
❤️Sending you lots of Love and Hugs❤️
SILVER: The Market Is Looking Down! Short!
My dear friends,
Today we will analyse SILVER together☺️
The recent price action suggests a shift in mid-term momentum. A break below the current local range around 38.780 will confirm the new direction downwards with the target being the next key level of 38.635.and a reconvened placement of a stop-loss beyond the range.
❤️Sending you lots of Love and Hugs❤️

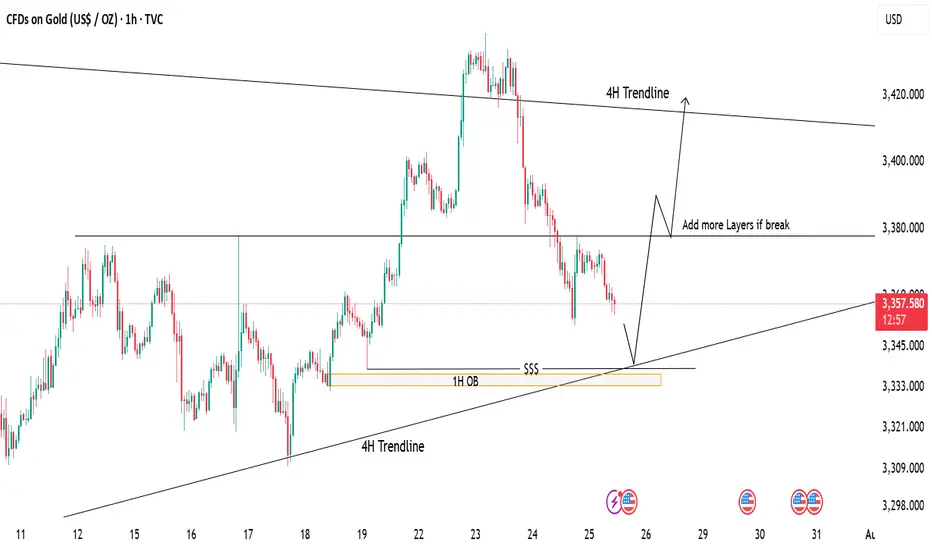
Gold Tapping Into Major Support – Eyes on Bullish ReversalPrice is currently retracing after a strong drop from recent highs. We're now approaching a key demand zone, aligning with:
📍 1H Order Block (OB)
📍 4H Trendline Support
📍 Liquidity Zone ($$$)
📉 If price taps into this area, it may offer a high-probability long setup.
📈 First target: 3380 (mid-range resistance)
🧱 If this breaks, we can look to scale in/add more positions, targeting the 4H trendline zone near 3420.
⚠️ Waiting for price reaction at support – patience is key!
GBPNZD Will Explode! BUY!
My dear friends,
My technical analysis for GBPNZD is below:
The market is trading on 2.2361 pivot level.
Bias - Bullish
Technical Indicators: Both Super Trend & Pivot HL indicate a highly probable Bullish continuation.
Target - 2.2454
About Used Indicators:
A pivot point is a technical analysis indicator, or calculations, used to determine the overall trend of the market over different time frames.
Disclosure: I am part of Trade Nation's Influencer program and receive a monthly fee for using their TradingView charts in my analysis.
———————————
WISH YOU ALL LUCK

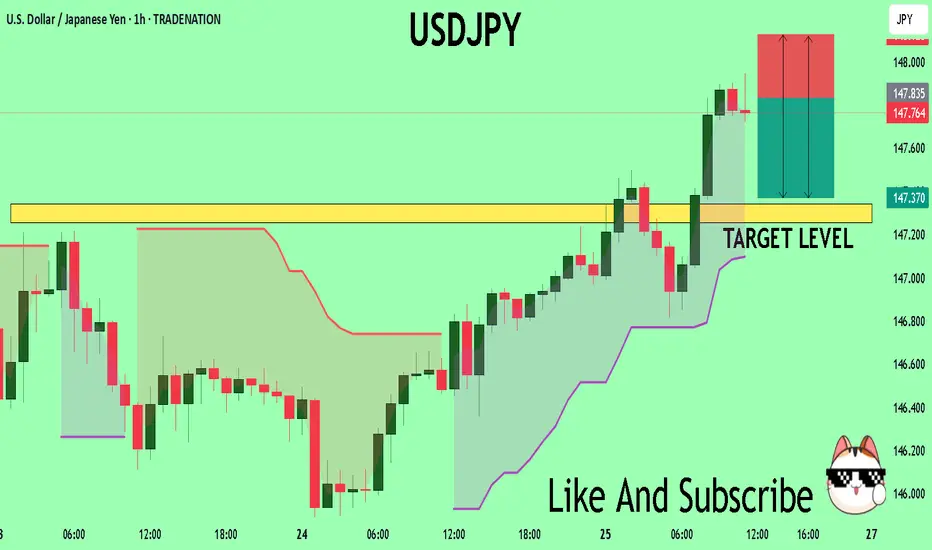
USDJPY Under Pressure! SELL!
My dear subscribers,
My technical analysis for USDJPY is below:
The price is coiling around a solid key level - 147.83
Bias - Bearish
Technical Indicators: Pivot Points High anticipates a potential price reversal.
Super trend shows a clear sell, giving a perfect indicators' convergence.
Goal - 147.34
My Stop Loss - 148.12
About Used Indicators:
By the very nature of the supertrend indicator, it offers firm support and resistance levels for traders to enter and exit trades. Additionally, it also provides signals for setting stop losses
Disclosure: I am part of Trade Nation's Influencer program and receive a monthly fee for using their TradingView charts in my analysis.
———————————
WISH YOU ALL LUCK
EURUSD | Time For A Pullback?The week kicked off with strong impulsive moves to the upside, leaving no room for deeper correction. Then slowly from Wednesday, we started to see a decline in strength in the bullish run.
Now, with price edging toward the next swing low for a possible bearish change of character, is this a good way to ride the stream to the downside?
Keep your A-game on as we watch price unfold, and trade reactively to price movement.
Do not forget to guard your capitals with risk management.
Good luck traders. 👍
Follow me for more and more of these analyses.
See you on the next one. 🫡
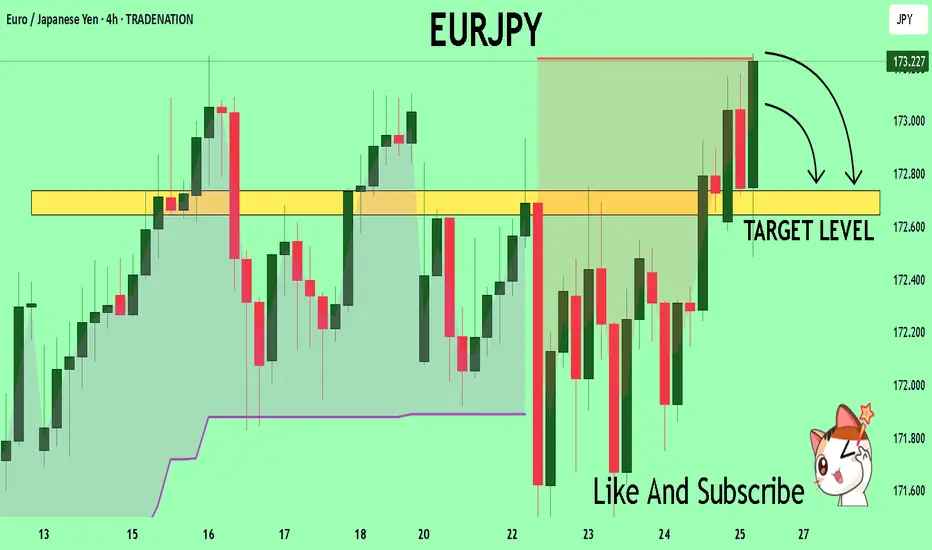
EURJPY; Heikin Ashi with FXAN algo indicator exampleHere you will see my approach with Heikin Ashi chart in combination of algo indicator from FXAN.

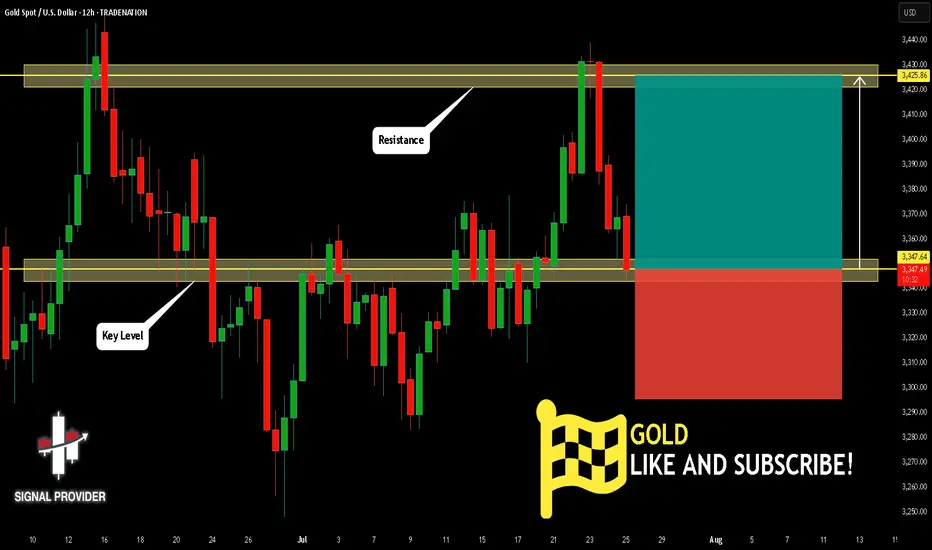
GOLD Will Move Higher! Buy!
Here is our detailed technical review for GOLD.
Time Frame: 12h
Current Trend: Bullish
Sentiment: Oversold (based on 7-period RSI)
Forecast: Bullish
The market is on a crucial zone of demand 3,347.64.
The oversold market condition in a combination with key structure gives us a relatively strong bullish signal with goal 3,425.86 level.
P.S
We determine oversold/overbought condition with RSI indicator.
When it drops below 30 - the market is considered to be oversold.
When it bounces above 70 - the market is considered to be overbought.
Disclosure: I am part of Trade Nation's Influencer program and receive a monthly fee for using their TradingView charts in my analysis.
Like and subscribe and comment my ideas if you enjoy them!
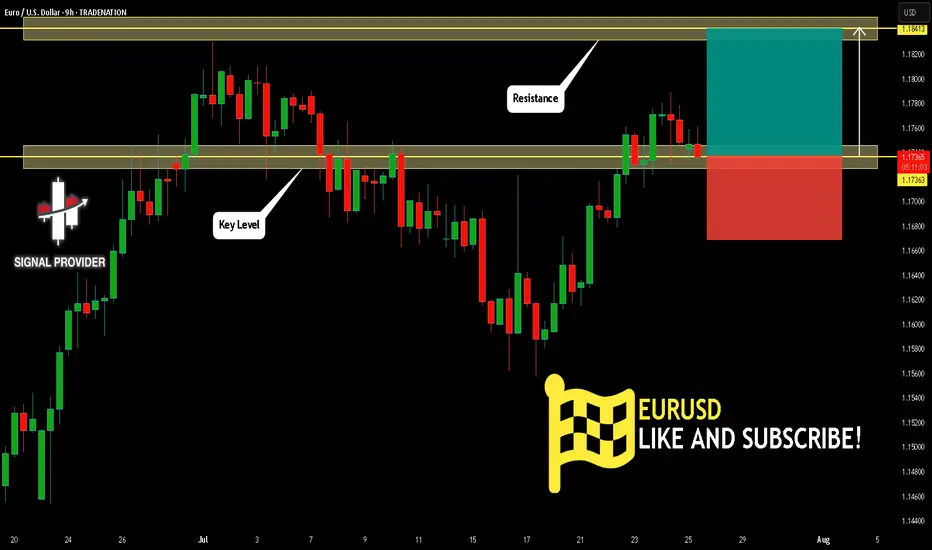
EURUSD Is Bullish! Long!
Take a look at our analysis for EURUSD.
Time Frame: 9h
Current Trend: Bullish
Sentiment: Oversold (based on 7-period RSI)
Forecast: Bullish
The price is testing a key support 1.173.
Current market trend & oversold RSI makes me think that buyers will push the price. I will anticipate a bullish movement at least to 1.184 level.
P.S
Overbought describes a period of time where there has been a significant and consistent upward move in price over a period of time without much pullback.
Disclosure: I am part of Trade Nation's Influencer program and receive a monthly fee for using their TradingView charts in my analysis.
Like and subscribe and comment my ideas if you enjoy them!
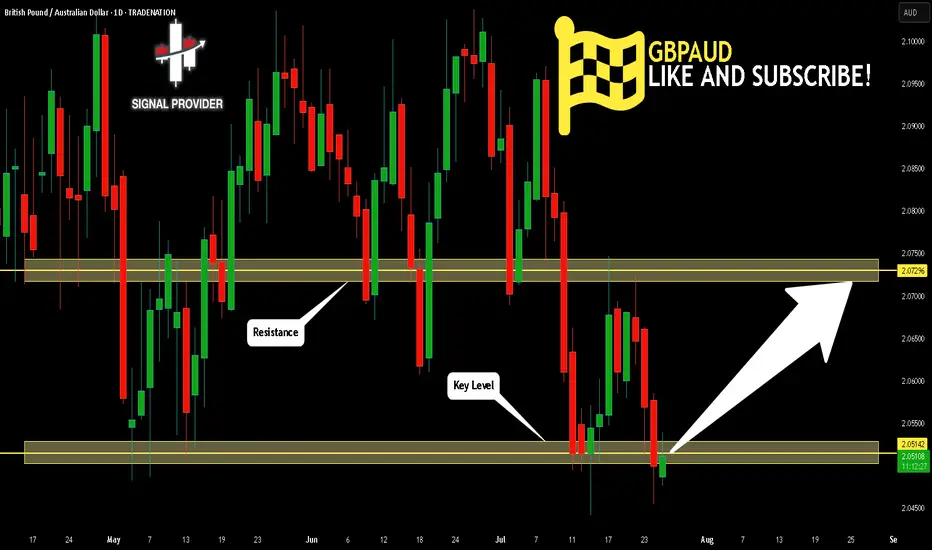
GBPAUD Is Going Up! Buy!
Here is our detailed technical review for GBPAUD.
Time Frame: 1D
Current Trend: Bullish
Sentiment: Oversold (based on 7-period RSI)
Forecast: Bullish
The market is testing a major horizontal structure 2.051.
Taking into consideration the structure & trend analysis, I believe that the market will reach 2.072 level soon.
P.S
The term oversold refers to a condition where an asset has traded lower in price and has the potential for a price bounce.
Overbought refers to market scenarios where the instrument is traded considerably higher than its fair value. Overvaluation is caused by market sentiments when there is positive news.
Disclosure: I am part of Trade Nation's Influencer program and receive a monthly fee for using their TradingView charts in my analysis.
Like and subscribe and comment my ideas if you enjoy them!
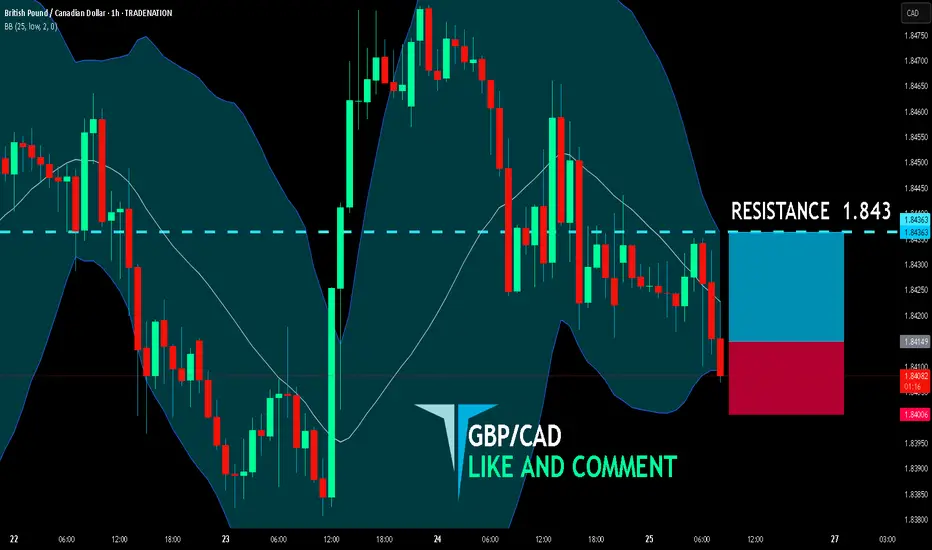
GBP/CAD BUYERS WILL DOMINATE THE MARKET|LONG
GBP/CAD SIGNAL
Trade Direction: long
Entry Level: 1.841
Target Level: 1.843
Stop Loss: 1.840
RISK PROFILE
Risk level: medium
Suggested risk: 1%
Timeframe: 1h
Disclosure: I am part of Trade Nation's Influencer program and receive a monthly fee for using their TradingView charts in my analysis.
✅LIKE AND COMMENT MY IDEAS✅
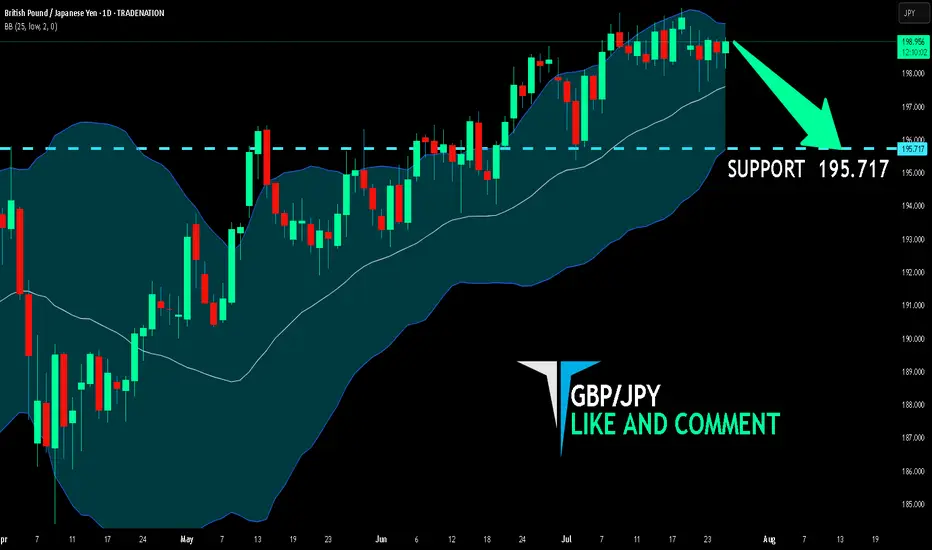
GBP/JPY BEARISH BIAS RIGHT NOW| SHORT
Hello, Friends!
GBP/JPY pair is trading in a local uptrend which we know by looking at the previous 1W candle which is green. On the 1D timeframe the pair is going up too. The pair is overbought because the price is close to the upper band of the BB indicator. So we are looking to sell the pair with the upper BB line acting as resistance. The next target is 195.717 area.
Disclosure: I am part of Trade Nation's Influencer program and receive a monthly fee for using their TradingView charts in my analysis.
✅LIKE AND COMMENT MY IDEAS✅
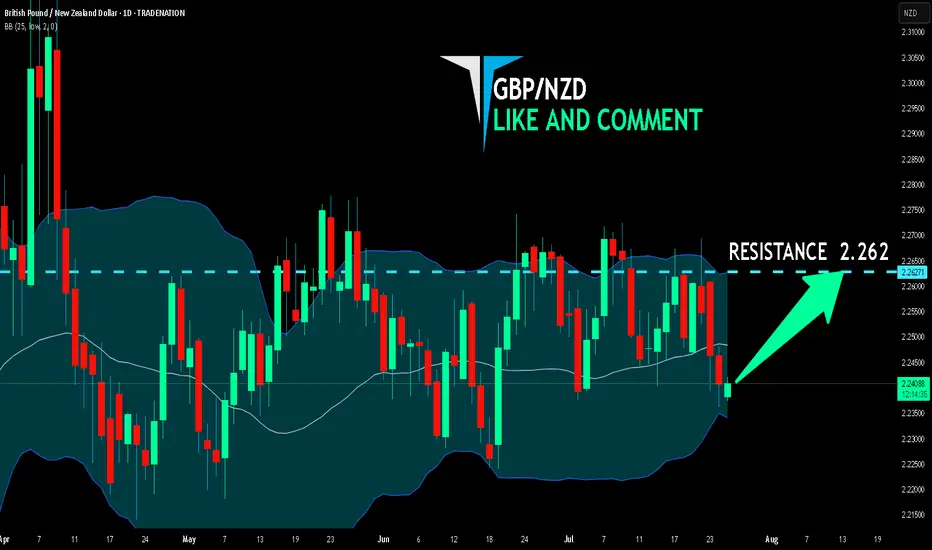
GBP/NZD BEST PLACE TO BUY FROM|LONG
Hello, Friends!
We are going long on the GBP/NZD with the target of 2.262 level, because the pair is oversold and will soon hit the support line below. We deduced the oversold condition from the price being near to the lower BB band. However, we should use low risk here because the 1W TF is red and gives us a counter-signal.
Disclosure: I am part of Trade Nation's Influencer program and receive a monthly fee for using their TradingView charts in my analysis.
✅LIKE AND COMMENT MY IDEAS✅
EURJPY Technical Analysis! SELL!
My dear subscribers,
EURJPY looks like it will make a good move, and here are the details:
The market is trading on 173.19 pivot level.
Bias - Bearish
Technical Indicators: Both Super Trend & Pivot HL indicate a highly probable Bearish continuation.
Target - 172.73
About Used Indicators:
The average true range (ATR) plays an important role in 'Supertrend' as the indicator uses ATR to calculate its value. The ATR indicator signals the degree of price volatility.
Disclosure: I am part of Trade Nation's Influencer program and receive a monthly fee for using their TradingView charts in my analysis.
———————————
WISH YOU ALL LUCK
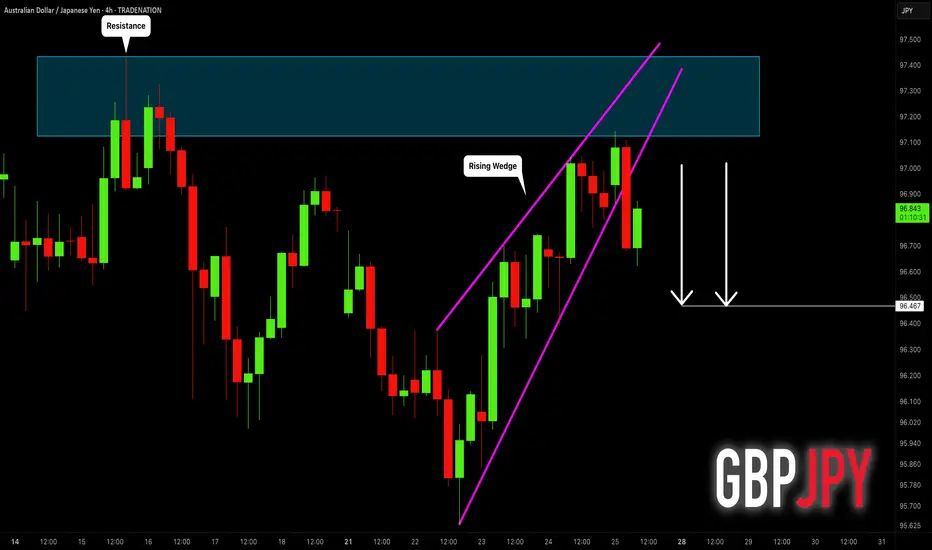
AUDJPY: Strong Bearish Signal?! 🇦🇺🇯🇵
AUDJPY may retrace from a key daily resistance.
As a confirmation, I see a bearish breakout of a support line of a rising
wedge pattern with a high momentum bearish candle.
Goal - 96.47
❤️Please, support my work with like, thank you!❤️
I am part of Trade Nation's Influencer program and receive a monthly fee for using their TradingView charts in my analysis.
GOLD The Target Is UP! BUY!
My dear followers,
I analysed this chart on GOLD and concluded the following:
The market is trading on 3354.1 pivot level.
Bias - Bullish
Technical Indicators: Both Super Trend & Pivot HL indicate a highly probable Bullish continuation.
Target - 3361.01
Safe Stop Loss - 3350.5
About Used Indicators:
A super-trend indicator is plotted on either above or below the closing price to signal a buy or sell. The indicator changes color, based on whether or not you should be buying. If the super-trend indicator moves below the closing price, the indicator turns green, and it signals an entry point or points to buy.
Disclosure: I am part of Trade Nation's Influencer program and receive a monthly fee for using their TradingView charts in my analysis.
———————————
WISH YOU ALL LUCK
SPK Market Update – Key Levels Ahead 🚨 SPK Market Update – Key Levels Ahead 🔄📉📈
SPK previously formed a bearish Head and Shoulders pattern, which was confirmed by a breakdown. So, what’s next?
🔹 Option 1:
Price could move down to the two blue support levels — these zones may offer potential long entries, as buyers were active here before. Watch for confirmation! 👀
🔺 Option 2:
We also have a red resistance zone, located around the right shoulder of the H&S.
If INDEX:SPK breaks above this zone, it may signal the return of buyers and a potential bullish reversal.

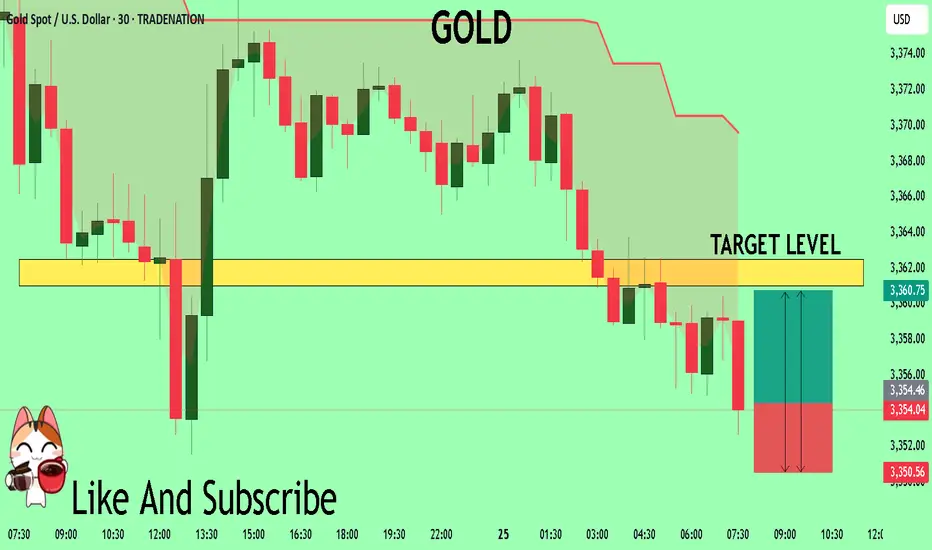
Gold price analysis July 25Gold Analysis – D1 Uptrend Still Maintains, But Needs New Momentum
Yesterday’s trading session recorded a D1 candle closing above the Breakout 3363 zone, indicating that buying power in the US session is still dominant. This implies that the uptrend is still being maintained, although the market may need a short-term technical correction.
In today’s Tokyo and London sessions, there is a possibility of liquidity sweeps to the support zone below before Gold recovers and increases again in the New York session.
Important to note:
The uptrend will only be broken if Gold closes below the 3345 zone on the D1 chart.
In this case, the 3320 level will be the next support zone to observe the price reaction and consider buying points.
For the bullish wave to continue expanding towards the historical peak (ATH) at 3500, the market needs stronger supporting factors, which can come from economic data or geopolitical developments.
📌 Support zone: 3345 – 3320
📌 Resistance zone: 3373 – 3418
🎯 Potential buy zone:
3345 (prioritize price reaction in this zone)
3320 (in case of breaking through 3345)
🎯 Target: 3417

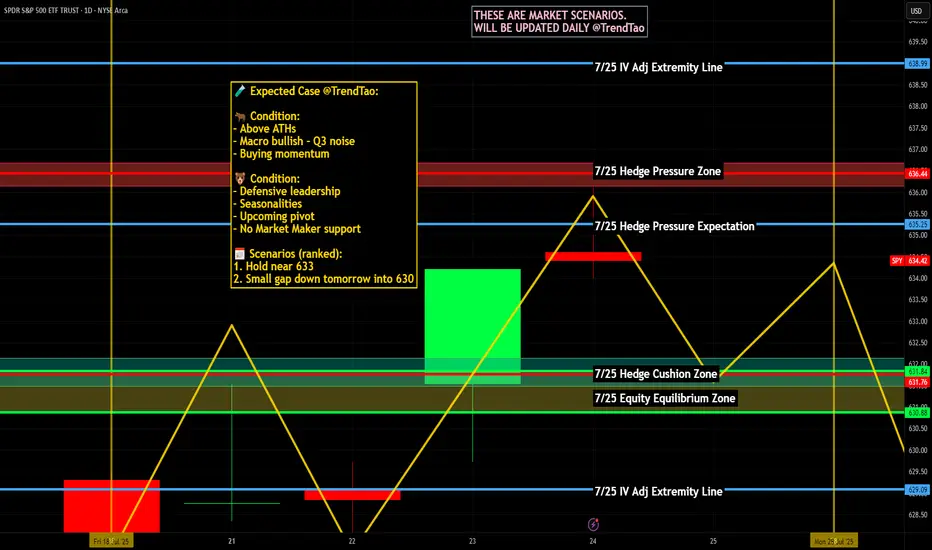
Nightly $SPY / $SPX Scenarios for July 25, 2025🔮 Nightly AMEX:SPY / CBOE:SPX Scenarios for July 25, 2025 🔮
🌍 Market‑Moving News 🌍
🏔️ Copper Market Flashpoint
Following President Trump’s announcement of steep copper tariffs (15–50% range), U.S. copper futures surged, then sharply reversed. Inventory arbitrage between CME and LME markets surged, distorting pricing dynamics and triggering concern over metal market stability.
🇪🇺 EU–China Summit Signals Trade Reset
EU leaders concluded their 25th summit with China, fostering deeper economic and strategic ties. Observers expect follow-up on mutual trade agreements, particularly regarding tech and sustainability sectors.
🌍 EM Equity Rally Consolidates Gains
Emerging markets continue to outperform global equities in 2025—with MSCI EM up ~18% vs. S&P 500. Analysts highlight strong opportunities in AI/fintech stocks in China and Latin America, suggesting further rotations out of U.S. markets.
📊 Key Data Releases & Events 📊
📅 Friday, July 25:
8:30 AM ET – Durable Goods Orders (June):
Forecast shows a sharp drop (~–10%), following a ~16% gain in May—signaling possible cooling in business-related equipment purchases.
10:00 AM ET – U.S. Imports of Steel Products (June):
Trade-data release monitoring steel flows amid evolving tariff frameworks.
All Day – Corporate Earnings Reports:
Companies such as First Financial Bancorp (FFBC), HCA, AON, Charter, and others report earnings. Outlooks may influence small- to mid-cap sentiment.
⚠️ Disclaimer:
This report is for educational and informational purposes only—not financial advice. Always consult a licensed financial advisor before making investment decisions.
📌 #trading #stockmarket #economy #data #earnings #commodities #EM #technicalanalysis
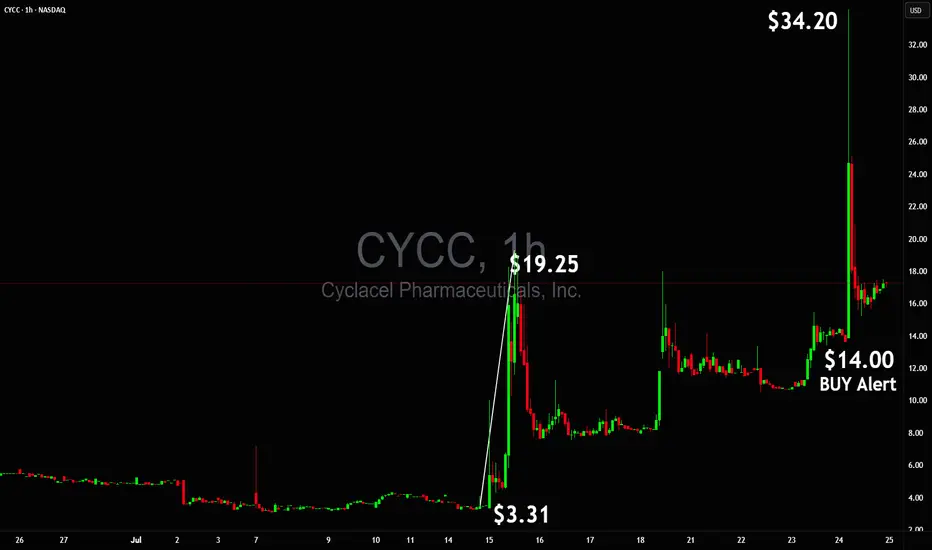
Buy Alert at $14, woke up to $34 $CYCC After missing the previous run because of no safe setup I made sure think time everyone who followed gets paid 🚀 Buy Alert $14, woke up to $34 NASDAQ:CYCC best stock of the day, got paid in a BIG WAY 🙌🏻
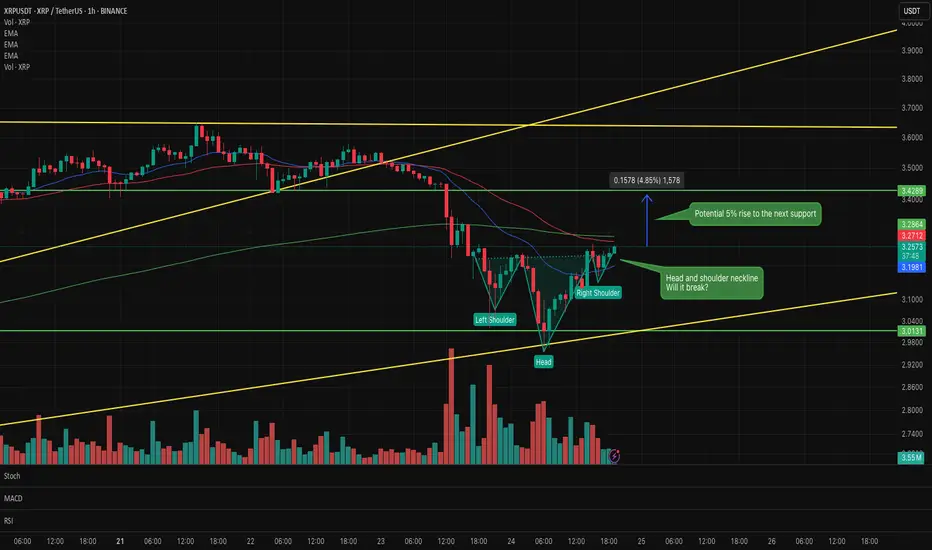
XRP 1hr Inverse head & shoulder formingXRP 1 hr chart inverse head and shoulders forming.
If it breaks the neckline it could break out for a 5% rise to the next resistance.
Watching this closely over the next few hours for confirmation.
NZDUSD is forming an upward cycle trendKiwi dollar is strong at the moment.
It is in an upward trend. If the trend completes 2 cycles and maintains the upward trajectory, I will get in the trade as a Long/Buy.
Patiently watching if the trend continues or breaks down.
