HOOK Testing Red Resistance & Forming Double Bottom🚨 HOOK Testing Red Resistance & Forming Double Bottom 🔴📈
HOOK is currently testing the red resistance trendline and has formed a bullish double bottom pattern, which could indicate a potential reversal.
🎯 If breakout is confirmed:
✅ First Target – Green line level
📊 A confirmed breakout of both the resistance trendline and the double bottom structure could signal strong bullish momentum.
Watch for confirmation before entering! 💼💸
Trading

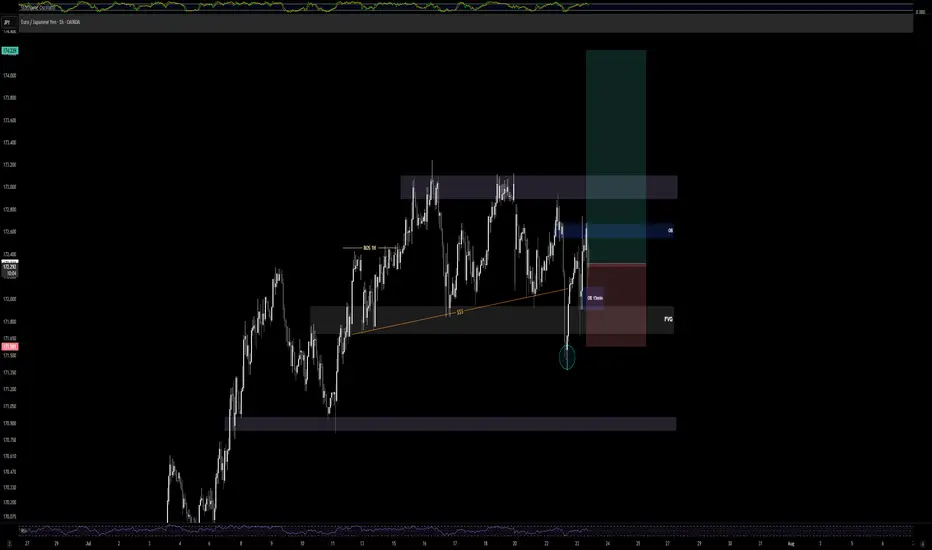
EUR/JPY - Good OpportunityPrice tapped into 1H demand zone and the 15min OB inside the FVG before showing a strong rejection. Bullish structure still intact with a clean 2:1 RR targeting previous supply zone. Patience paid off on this textbook entry.
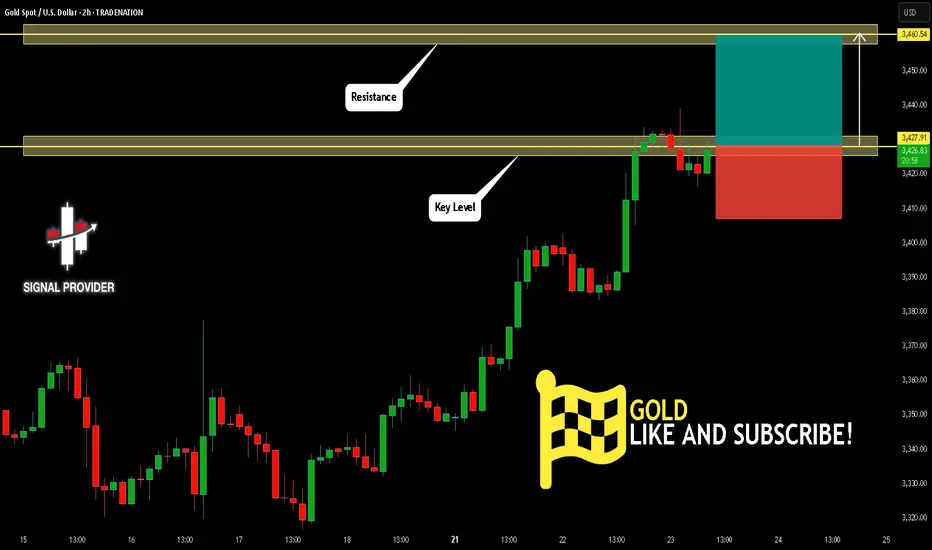
GOLD Will Go Up! Buy!
Please, check our technical outlook for GOLD.
Time Frame: 2h
Current Trend: Bullish
Sentiment: Oversold (based on 7-period RSI)
Forecast: Bullish
The market is trading around a solid horizontal structure 3,427.91.
The above observations make me that the market will inevitably achieve 3,460.54 level.
P.S
We determine oversold/overbought condition with RSI indicator.
When it drops below 30 - the market is considered to be oversold.
When it bounces above 70 - the market is considered to be overbought.
Disclosure: I am part of Trade Nation's Influencer program and receive a monthly fee for using their TradingView charts in my analysis.
Like and subscribe and comment my ideas if you enjoy them!
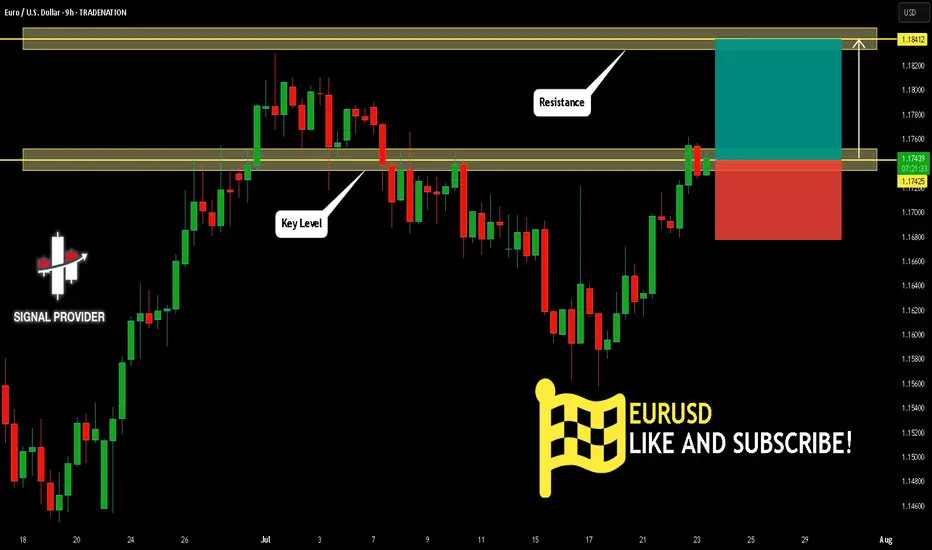
EURUSD Will Move Higher! Long!
Here is our detailed technical review for EURUSD.
Time Frame: 9h
Current Trend: Bullish
Sentiment: Oversold (based on 7-period RSI)
Forecast: Bullish
The market is testing a major horizontal structure 1.174.
Taking into consideration the structure & trend analysis, I believe that the market will reach 1.184 level soon.
P.S
Overbought describes a period of time where there has been a significant and consistent upward move in price over a period of time without much pullback.
Disclosure: I am part of Trade Nation's Influencer program and receive a monthly fee for using their TradingView charts in my analysis.
Like and subscribe and comment my ideas if you enjoy them!
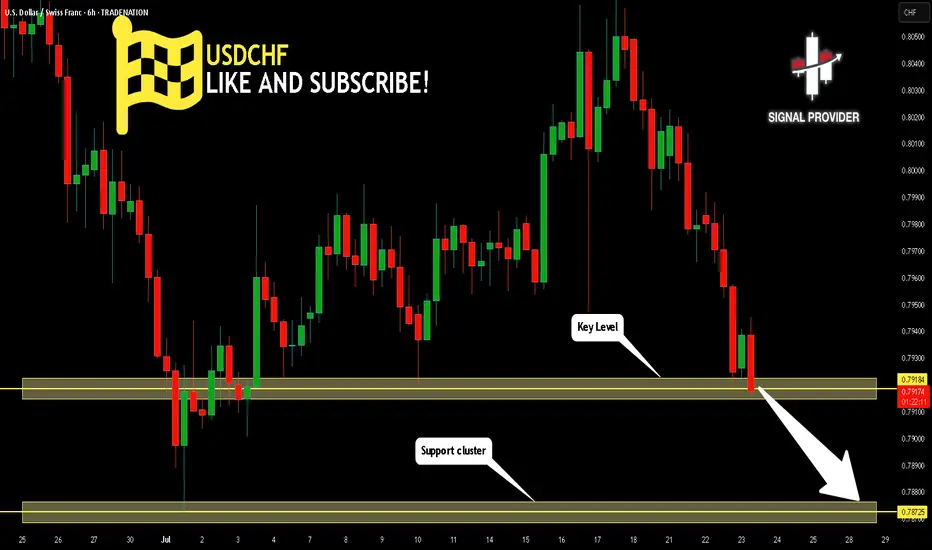
USDCHF Is Bearish! Sell!
Take a look at our analysis for USDCHF.
Time Frame: 6h
Current Trend: Bearish
Sentiment: Overbought (based on 7-period RSI)
Forecast: Bearish
The market is approaching a key horizontal level 0.791.
Considering the today's price action, probabilities will be high to see a movement to 0.787.
P.S
Please, note that an oversold/overbought condition can last for a long time, and therefore being oversold/overbought doesn't mean a price rally will come soon, or at all.
Disclosure: I am part of Trade Nation's Influencer program and receive a monthly fee for using their TradingView charts in my analysis.
Like and subscribe and comment my ideas if you enjoy them!
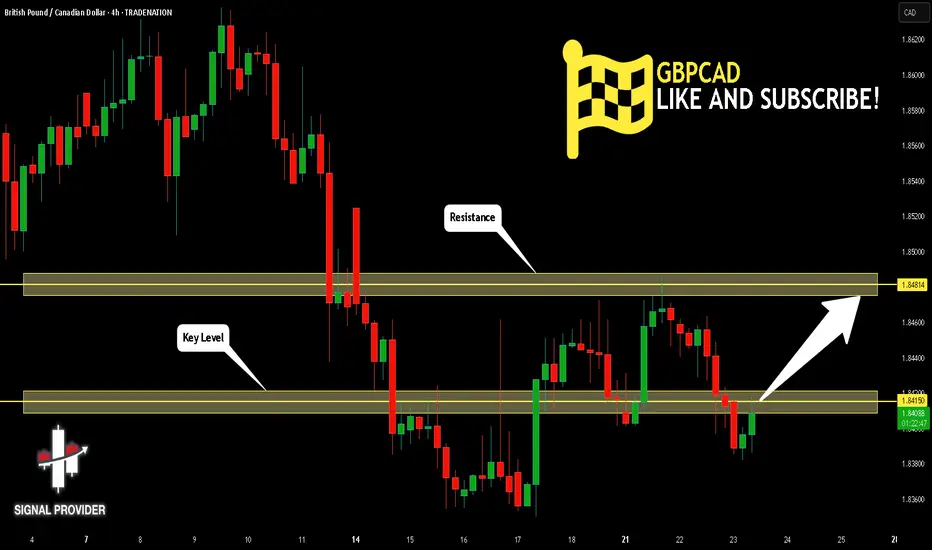
GBPCAD Is Very Bullish! Buy!
Please, check our technical outlook for GBPCAD.
Time Frame: 4h
Current Trend: Bullish
Sentiment: Oversold (based on 7-period RSI)
Forecast: Bullish
The market is approaching a significant support area 1.841.
The underlined horizontal cluster clearly indicates a highly probable bullish movement with target 1.848 level.
P.S
The term oversold refers to a condition where an asset has traded lower in price and has the potential for a price bounce.
Overbought refers to market scenarios where the instrument is traded considerably higher than its fair value. Overvaluation is caused by market sentiments when there is positive news.
Disclosure: I am part of Trade Nation's Influencer program and receive a monthly fee for using their TradingView charts in my analysis.
Like and subscribe and comment my ideas if you enjoy them!
Cup & Handle Formation 🚨 XETR:HOT Testing Red Resistance – Cup & Handle Formation 📈
XETR:HOT is currently testing the red resistance zone and has formed a bullish Cup & Handle pattern on the chart — a classic continuation setup.
If breakout is confirmed, potential upside:
✅ First Target: Green line level
✅ Second Target: Green line level
🕵️♂️ Wait for clear breakout confirmation before entering long.
This pattern often signals strong momentum if buyers step in.
Trade smart. Let’s monitor for the perfect entry! 💹💼

Bullish Cup & Handle Pattern Formed 🚨 SEED_WANDERIN_JIMZIP900:WIF Testing Red Resistance – Bullish Cup & Handle Pattern Formed 📈
SEED_WANDERIN_JIMZIP900:WIF is currently testing the red resistance zone and has formed a bullish cup and handle pattern on the chart.
If a breakout occurs, potential upside toward:
✅ First Target: Green line level
✅ Second Target: Green line level
Wait for breakout confirmation before entering long. 📊
Patience is key—watch this closely! 💼💸

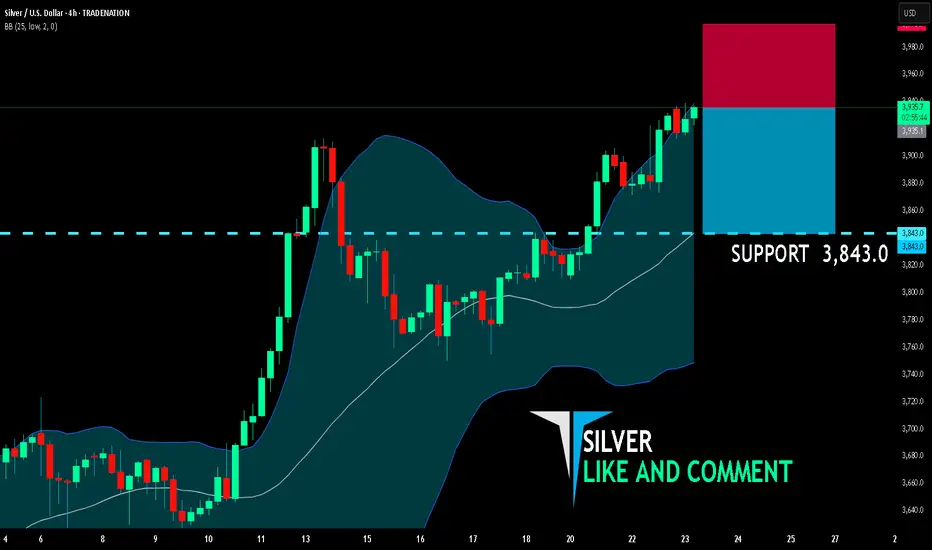
SILVER BEARS ARE GAINING STRENGTH|SHORT
SILVER SIGNAL
Trade Direction: short
Entry Level: 3,935.1
Target Level: 3,843.0
Stop Loss: 3,996.7
RISK PROFILE
Risk level: medium
Suggested risk: 1%
Timeframe: 4h
Disclosure: I am part of Trade Nation's Influencer program and receive a monthly fee for using their TradingView charts in my analysis.
✅LIKE AND COMMENT MY IDEAS✅
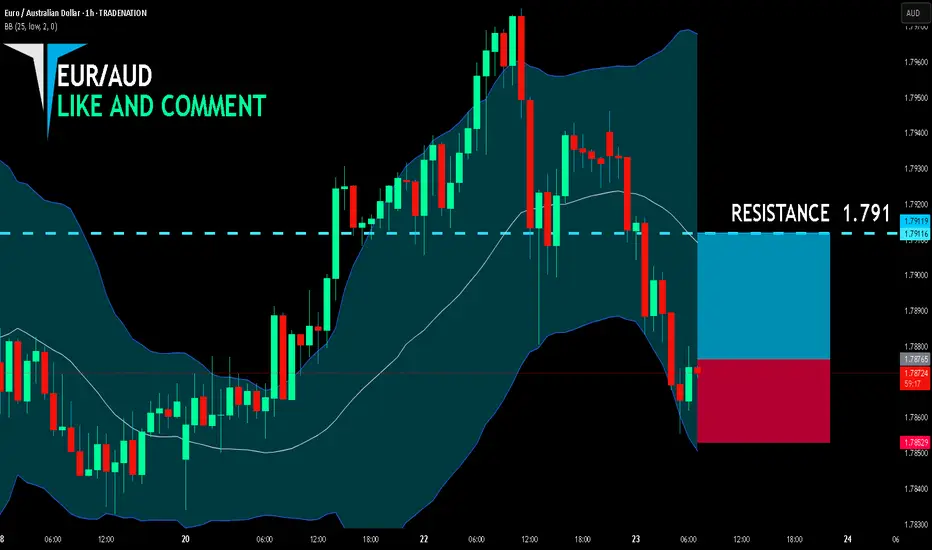
EUR/AUD BUYERS WILL DOMINATE THE MARKET|LONG
EUR/AUD SIGNAL
Trade Direction: long
Entry Level: 1.787
Target Level: 1.791
Stop Loss: 1.785
RISK PROFILE
Risk level: medium
Suggested risk: 1%
Timeframe: 1h
Disclosure: I am part of Trade Nation's Influencer program and receive a monthly fee for using their TradingView charts in my analysis.
✅LIKE AND COMMENT MY IDEAS✅
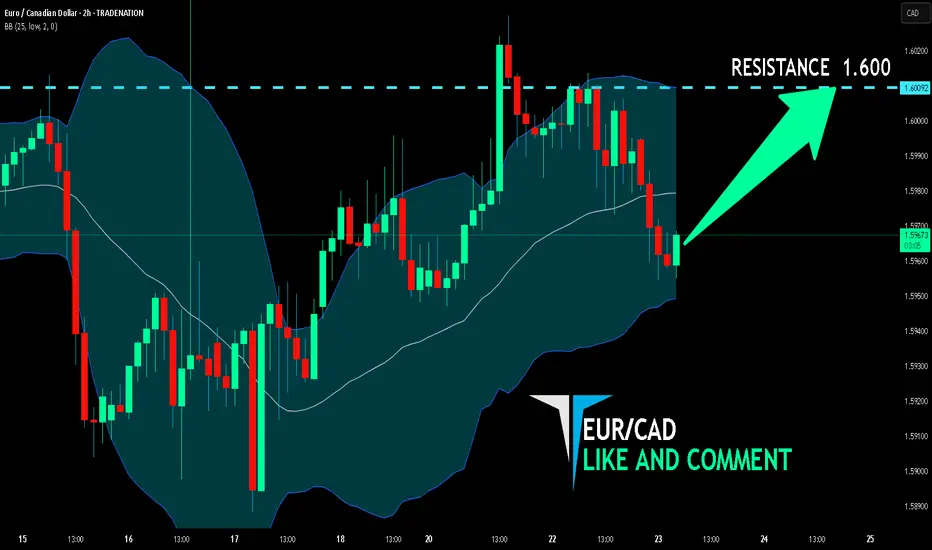
EUR/CAD BULLISH BIAS RIGHT NOW| LONG
Hello, Friends!
Previous week’s red candle means that for us the EUR/CAD pair is in the downtrend. And the current movement leg was also down but the support line will be hit soon and lower BB band proximity will signal an oversold condition so we will go for a counter-trend long trade with the target being at 1.600.
Disclosure: I am part of Trade Nation's Influencer program and receive a monthly fee for using their TradingView charts in my analysis.
✅LIKE AND COMMENT MY IDEAS✅
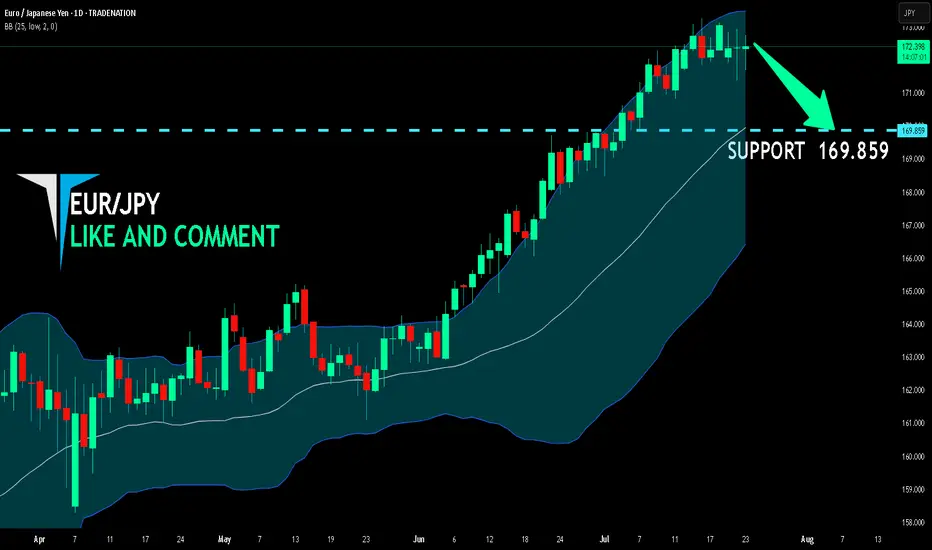
EUR/JPY BEST PLACE TO SELL FROM|SHORT
Hello, Friends!
EUR-JPY uptrend evident from the last 1W green candle makes short trades more risky, but the current set-up targeting 169.859 area still presents a good opportunity for us to sell the pair because the resistance line is nearby and the BB upper band is close which indicates the overbought state of the EUR/JPY pair.
Disclosure: I am part of Trade Nation's Influencer program and receive a monthly fee for using their TradingView charts in my analysis.
✅LIKE AND COMMENT MY IDEAS✅
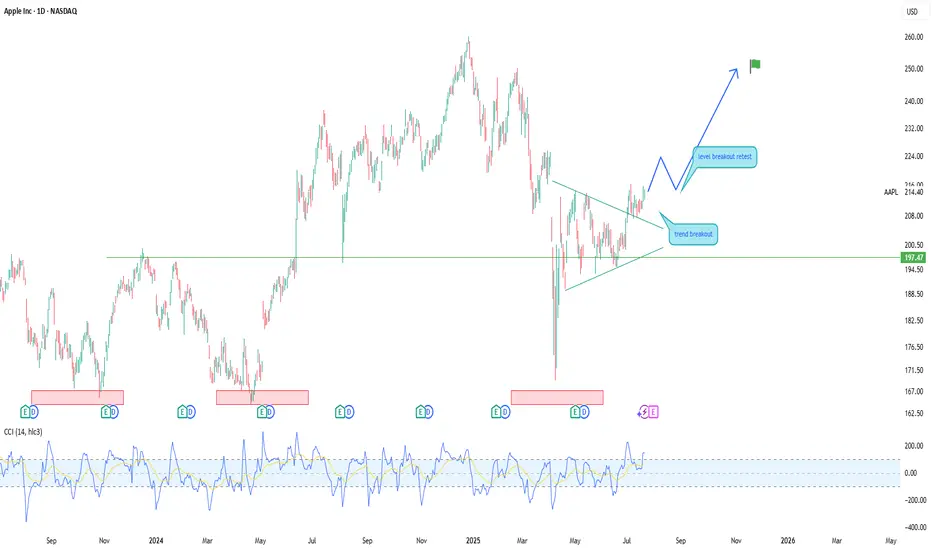
Apple (AAPL) — Expected 20% GrowthThe fundamental outlook for Apple stock remains positive: the upcoming fall presentation and anticipated AI-related announcements are driving bullish sentiment.
Technical picture:
The price has broken through a key trendline, signaling a shift in momentum toward growth.
Near-term target: a move toward the 225.0 level.
Next step: a possible pullback to 214.0 for a retest of the support level.
Long-term scenario: after the correction, I expect a rise toward 250.0, which could bring approximately 20% growth within 1–2 months.
This growth potential may coincide with Apple’s upcoming earnings report and further AI news.
TESLA PRICE ACTION 22 JULY 2025This is the price action for Tesla. i have discussed indicators as well. Do not blindly trade without understanding the logics. I am long here with stocks & calls.
NOTE: DO NOT BLINDLY BUY

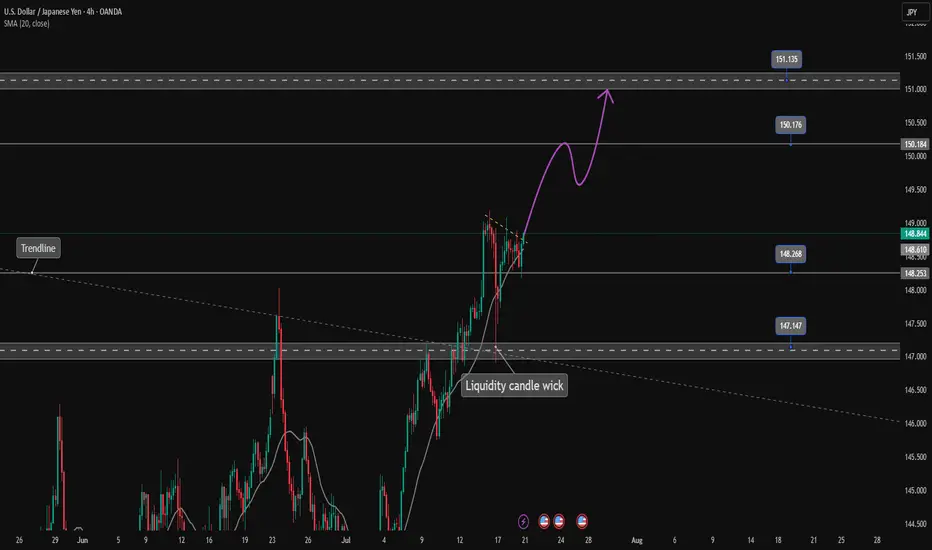
USDJPY is continuing its uptrend, let's BUY✏️ OANDA:USDJPY broke the price channel and continued its uptrend at 151,000. The previous h4 candle wick had a liquidity sweep to 147,000, showing that the buyers are dominating the market. The USDJPY trading strategy will mainly BUY to the old peak around 151,000. When the price breaks 147,000, a corrective downtrend will begin to form.
📉 Key Levels
Support: 148.200 - 147.200
Resistance: 150.100 - 151.100
Buy trigger: Breakout above 148,800
BUY 147,200 (buyer liquidity zone)
Target: 145,000
Leave your comments on the idea. I am happy to read your views.
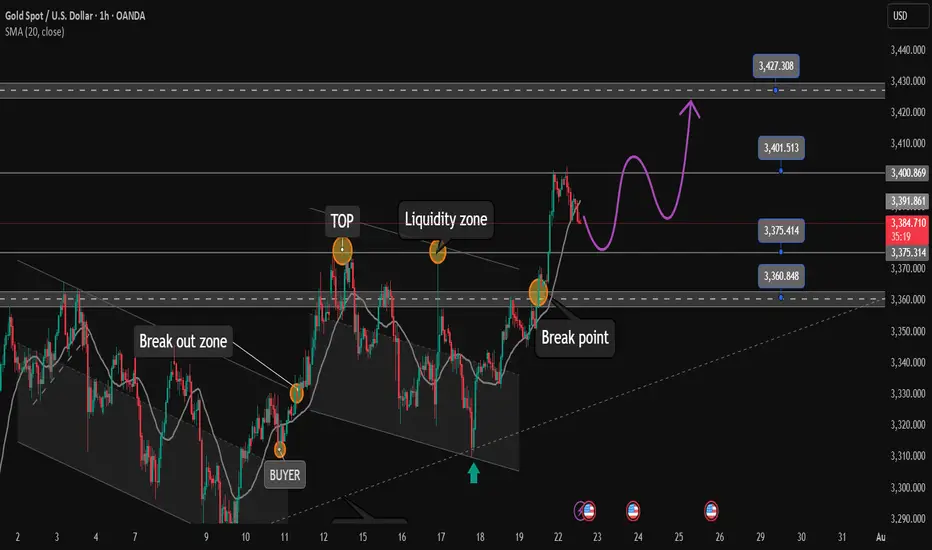
After reaching FULL TP. Relax and wait for strong support zone✏️Continuing yesterday's bullish wave structure, Gold has reached the Target level of 3400. In the European session, there is a possibility of a correction to some important support zones. And the US session will continue to aim for a level higher than 3400. Today's strategy is still quite similar to yesterday's strategy when waiting for the areas where buyers confirm to enter the market to FOMO according to the main trend.
📉 Key Levels
Support: 3375 - 3363
Resistance: 3400-3427
Buy Trigger: Rejects the support zone 3375 and reacts to the upside
Buy Trigger: Rebound from 3363
BUY DCA: Break and trading above 3400
Target 3427
Leave your comments on the idea. I am happy to read your views.
Price channel break. Will the downtrend take place?✏️USDCAD broke the price channel and started forming a bearish wave. The resistance zone of 1.370 played an important role in starting the bearish wave. 1.365 is the immediate support zone that the pair faces. If it wants to extend the decline, it needs to close the h1 candle below this price zone. The convergence between the trendline and the resistance of the Asian session will be a reliable support point for a downtrend to take place.
📉 Key Levels
Support: 1.365-1.356
Resistance: 1.370
SELL Trigger: Rejects bellow 1.370
SELL DCA Trigger: Break support 1.365
Target 1.356
BUY Trigger: Break and trading above resistance 1.370
Leave your comments on the idea. I am happy to read your views.

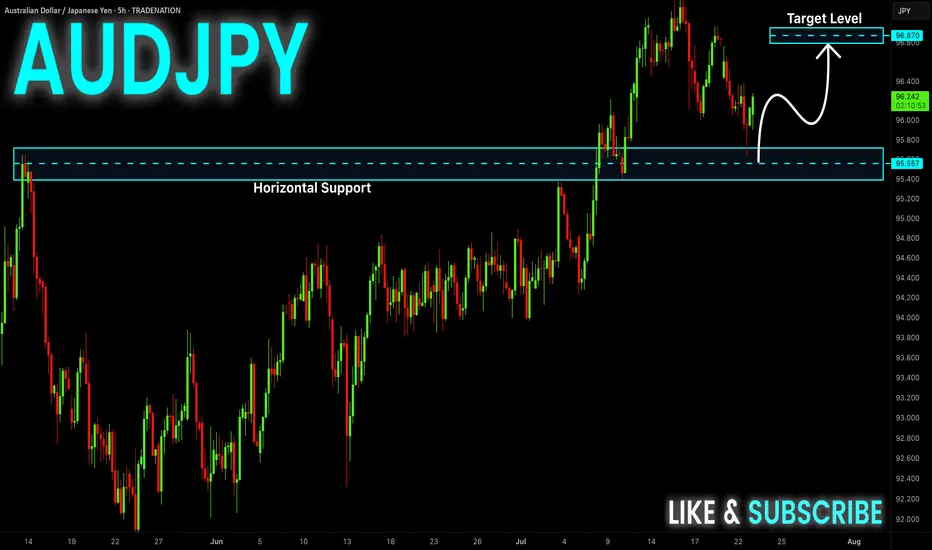
AUD-JPY Will Grow! Buy!
Hello,Traders!
AUD-JPY already made a
Bullish rebound from the
Strong horizontal support
Of 95.610 and as we are
Bullish biased we will be
Expecting a further bullish
Move up
Buy!
Comment and subscribe to help us grow!
Check out other forecasts below too!
Disclosure: I am part of Trade Nation's Influencer program and receive a monthly fee for using their TradingView charts in my analysis.
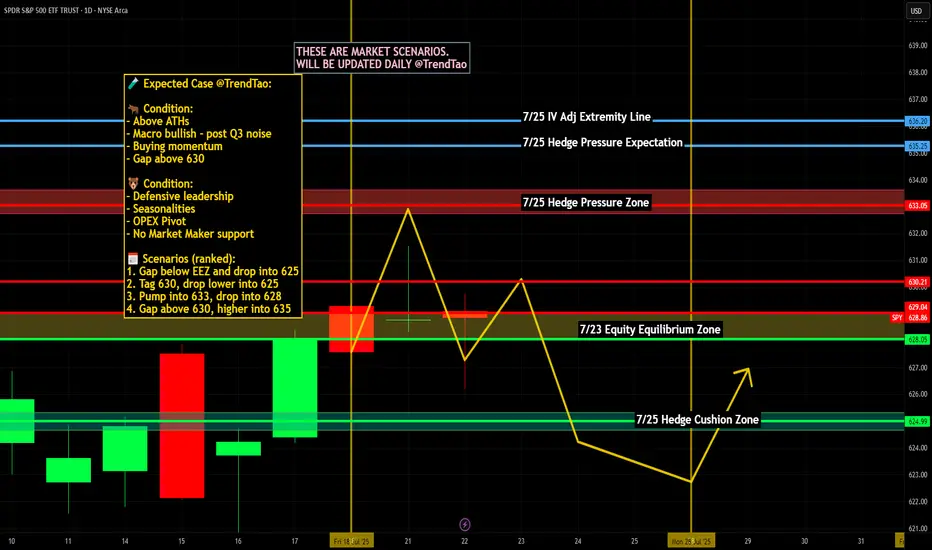
Nightly $SPY / $SPX Scenarios for July 23, 2025🔮 Nightly AMEX:SPY / SP:SPX Scenarios for July 23, 2025 🔮
🌍 Market-Moving News 🌍
📈 Morgan Stanley Stays Bullish
Morgan Stanley reaffirmed its optimistic view, forecasting the S&P 500 will reach 7,200 by mid‑2026. They cited strong earnings and anticipated rate cuts as key drivers, though warned of risks from rising Treasury yields and tariff-related cost pressure
📉 Inflation Debate Reignites
A renewed debate is underway regarding whether tariffs are "transitory" or persistent inflation drivers. Treasury counselor Joseph Lavorgna argued tariff impacts will be one-off, while others caution long-term price pressures may persist, complicating Fed policy directions
🏛️ Calls for Fed Reform Intensify
Treasury Secretary Scott Bessent suggested structural reforms to the Federal Reserve could have greater long-term impact than removing Chair Powell, highlighting ongoing concerns over central-bank governance amid political criticism
💳 Investors Shift to Corporate Bonds
As equity valuations have surged, investors are reallocating toward investment-grade corporate bonds, reducing credit spreads to the tightest levels since 1998—a sign of elevated risk appetite balanced with caution
📊 Key Data Releases & Events 📊
📅 Wednesday, July 23:
(No major U.S. economic releases)
Market focus remains on tech earnings (Tesla, Alphabet) and Fed signals following Tuesday’s Powell address.
⚠️ Disclaimer:
This information is for educational/informational purposes only and does not constitute financial advice. Please consult a licensed financial advisor before making investing decisions.
📌 #trading #stockmarket #economy #tariffs #Fed #earnings #corporatebonds
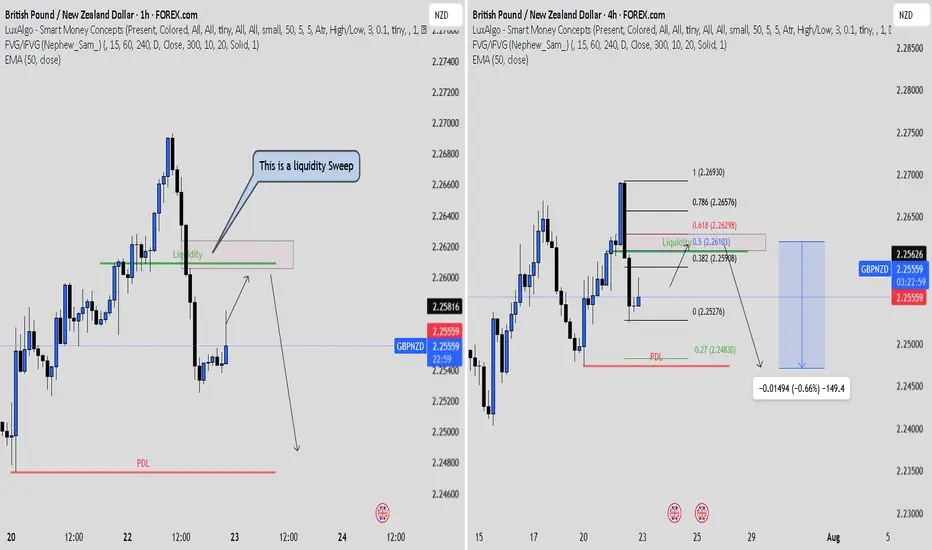
The Layout tool that Changed the Game for MeTradingView’s layout tool has really helped me stay focused. Using the 1-hour on the left and the 4-hour on the right gave me clarity. The 1H showed many Fair Value Gaps, but it was hard to know which one to trust.
The 4H chart made it easier. It showed one clean FVG lining up with the 50 to 61.8 Fib zone. That is the area I will wait for.
If price returns to that zone and I see a clear bearish confirmation candle, I will take the trade with confidence.
This layout tool has improved my analysis. I will make a short video soon to show how I use it. Big thanks to TradingView for building tools that make trading simpler and smarter.
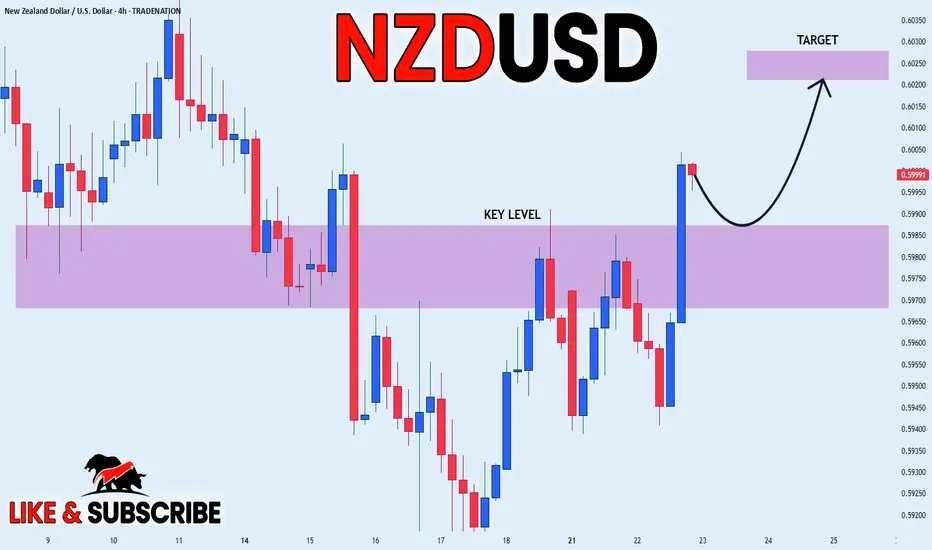
NZD_USD BULLISH BREAKOUT|LONG|
✅NZD_USD is going up
Now and the pair made a bullish
Breakout of the key horizontal
Level of 0.5980 and the breakout
Is confirmed so we are bullish
Biased and we will be expecting
A further bullish move up
LONG🚀
✅Like and subscribe to never miss a new idea!✅
Disclosure: I am part of Trade Nation's Influencer program and receive a monthly fee for using their TradingView charts in my analysis.
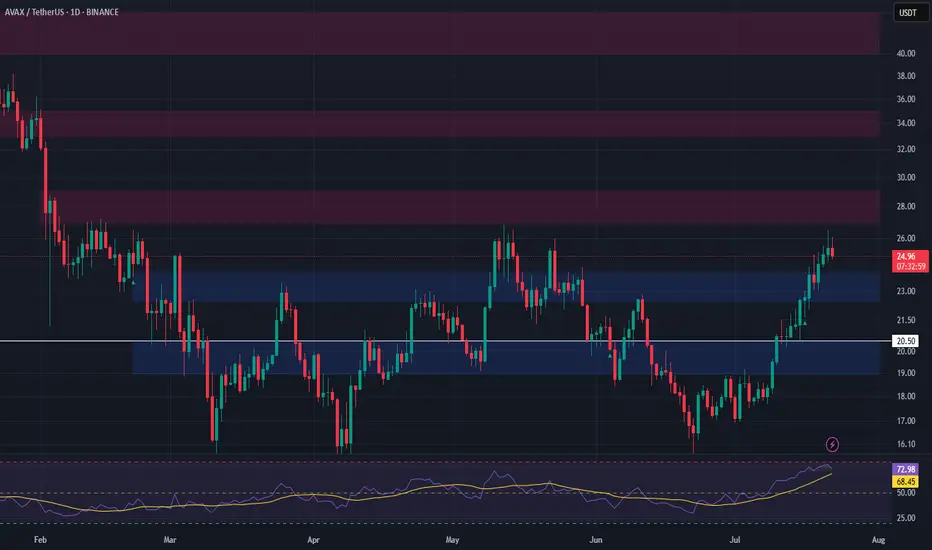
AVAX Long Swing Setup – Waiting for Support RetestAVAX has been rallying for two straight weeks, showing strong momentum. We’re watching for a healthy pullback into the $22.50–$24.00 support zone to position for continuation. If this zone holds, the risk/reward setup favors bulls with clear upside targets.
📌 Trade Setup:
• Entry Zone: $22.50 – $24.00
• Take Profit Targets:
o 🥇 $27 – $29
o 🥈 $33 – $35
o 🥉 $40 – $44
• Stop Loss: Daily close below $20.50
THETA Long Swing Setup – Accumulation Phase Near BreakoutTHETA is still consolidating in a range, but momentum is quietly building. A break above $1.07 followed by a higher low would confirm structural reversal. We’re eyeing the $0.95–$1.00 zone for a clean entry on retest, offering solid risk-reward if support holds.
📌 Trade Setup:
• Entry Zone: $0.95 – $1.00
• Take Profit Targets:
o 🥇 $1.60 – $1.70
o 🥈 $2.10 – $2.20
• Stop Loss: Daily close below $0.90
