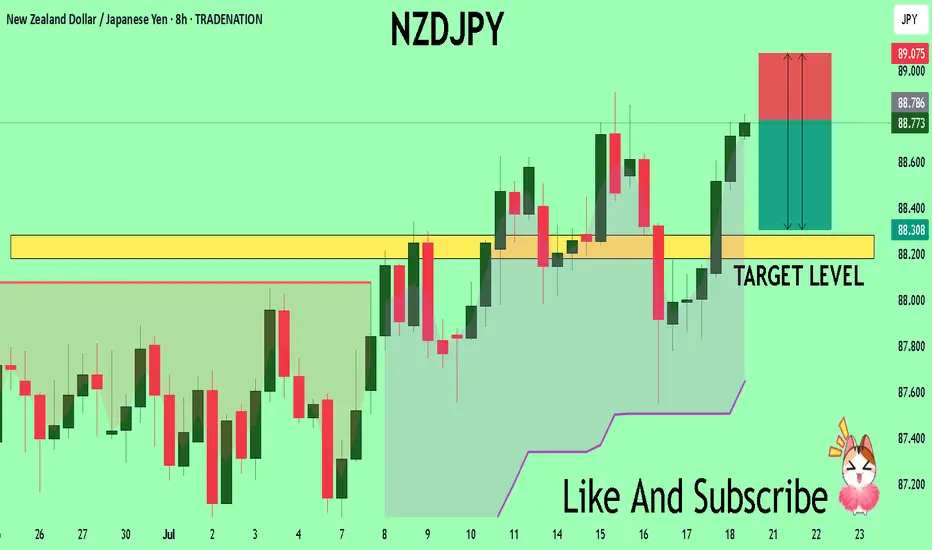
NZDJPY Set To Fall! SELL!
My dear subscribers,
My technical analysis for NZDJPY is below:
The price is coiling around a solid key level - 88.786
Bias - Bearish
Technical Indicators: Pivot Points Low anticipates a potential price reversal.
Super trend shows a clear sell, giving a perfect indicators' convergence.
Goal - 88.284
My Stop Loss - 89.075
About Used Indicators:
By the very nature of the supertrend indicator, it offers firm support and resistance levels for traders to enter and exit trades. Additionally, it also provides signals for setting stop losses
Disclosure: I am part of Trade Nation's Influencer program and receive a monthly fee for using their TradingView charts in my analysis.
———————————
WISH YOU ALL LUCK
Trading
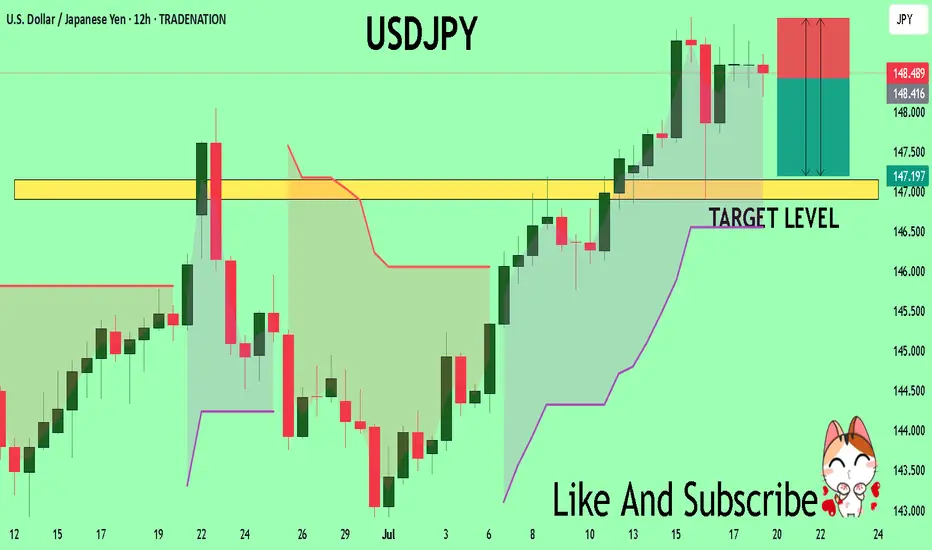
USDJPY Under Pressure! SELL!
My dear friends,
Please, find my technical outlook for USDJPY below:
The instrument tests an important psychological level 148.46
Bias - Bearish
Technical Indicators: Supper Trend gives a precise Bearish signal, while Pivot Point HL predicts price changes and potential reversals in the market.
Target - 147.15
Recommended Stop Loss - 149.17
About Used Indicators:
Super-trend indicator is more useful in trending markets where there are clear uptrends and downtrends in price.
Disclosure: I am part of Trade Nation's Influencer program and receive a monthly fee for using their TradingView charts in my analysis.
———————————
WISH YOU ALL LUCK
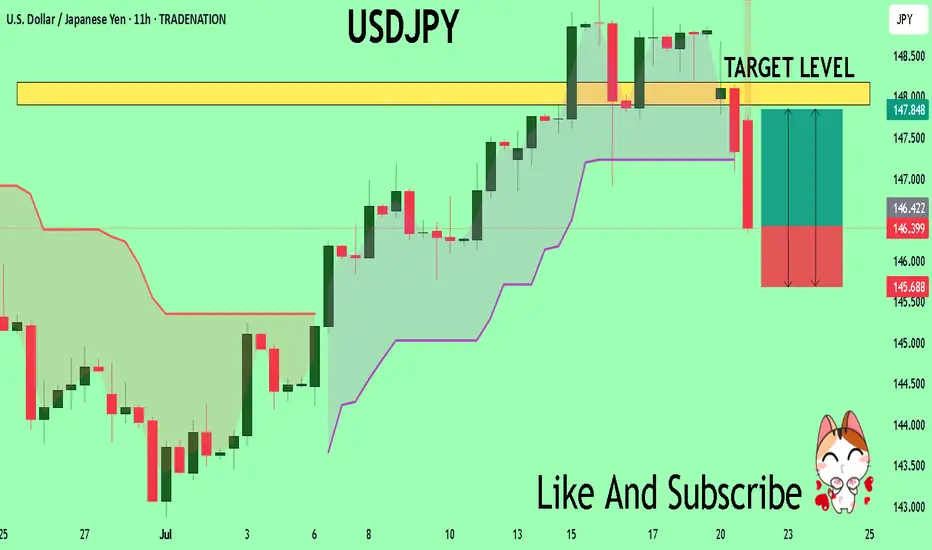
USDJPY Sellers In Panic! BUY!
My dear subscribers,
My technical analysis for USDJPY is below:
The price is coiling around a solid key level - 146.36
Bias - Bullish
Technical Indicators: Pivot Points Low anticipates a potential price reversal.
Super trend shows a clear buy, giving a perfect indicators' convergence.
Goal - 147.90
My Stop Loss - 145.68
About Used Indicators:
By the very nature of the supertrend indicator, it offers firm support and resistance levels for traders to enter and exit trades. Additionally, it also provides signals for setting stop losses
Disclosure: I am part of Trade Nation's Influencer program and receive a monthly fee for using their TradingView charts in my analysis.
———————————
WISH YOU ALL LUCK
Gold 22/07 – Reversal in Sight After $3400? Watch These Key Zone XAUUSD – Intraday Market Outlook (22/07)
Gold posted a strong rally in the previous session, completing its short-term impulsive wave structure. However, as price approached the psychological resistance at $3400, it began to lose momentum, and a clear reversal candle appeared — a signal that today’s session may favour a pullback or correction.
🔍 Technical Overview
After printing a short-term top, gold is now retracing and has reached a critical support area: the FVG High Zone on the H1 chart. If bearish pressure continues and this level fails to hold, price is likely to drop further in search of deeper liquidity zones.
🔽 Key BUY Zones to Monitor Today
✅ Zone 1 – EL (End Liquidity within FVG): 3367 – 3350
→ A zone with strong potential for short-term rebounds due to previous liquidity sweeps.
✅ Zone 2 – Confluence of FIBO 0.5–0.618 + VPOC (3350 – 3335)
→ A technically significant area where multiple factors align — ideal for medium-to-long term entries.
📌 Trade Setup Ideas
🔸 BUY ZONE: 3351 – 3349
Stop Loss: 3344
Take Profit Targets:
3355 – 3360 – 3365 – 3370 – 3375 – 3380 – 3390 – 3400 – ???
🔸 BUY SCALP ZONE: 3366 – 3364
Stop Loss: 3360
Targets: 3370 – 3375 – 3380 – 3385 – 3390
🔻 SELL ZONE: 3420 – 3422
Stop Loss: 3427
Targets: 3415 – 3410 – 3405 – 3400 – 3390 – 3385
⚠️ Market Risk Reminder
While no major economic data is expected today, that doesn’t mean the market will stay calm. Unexpected volatility can still arise from geopolitical tensions or unscheduled central bank comments. Gold tends to compress and break out aggressively in low-news environments.
📌 Protect your capital with disciplined Stop Loss and Take Profit levels — no forecast is ever 100% certain.
📈 Strategic Outlook
Short-term bias: Market is likely to continue correcting
Medium to long-term plan: A deeper pullback could offer an excellent opportunity to build long positions from key demand zones, especially as markets begin to price in potential Fed rate cuts and gold continues its long-term bullish trend.
💬 Be patient, wait for confirmations, and trade with a clear plan — that’s what separates consistency from chaos.

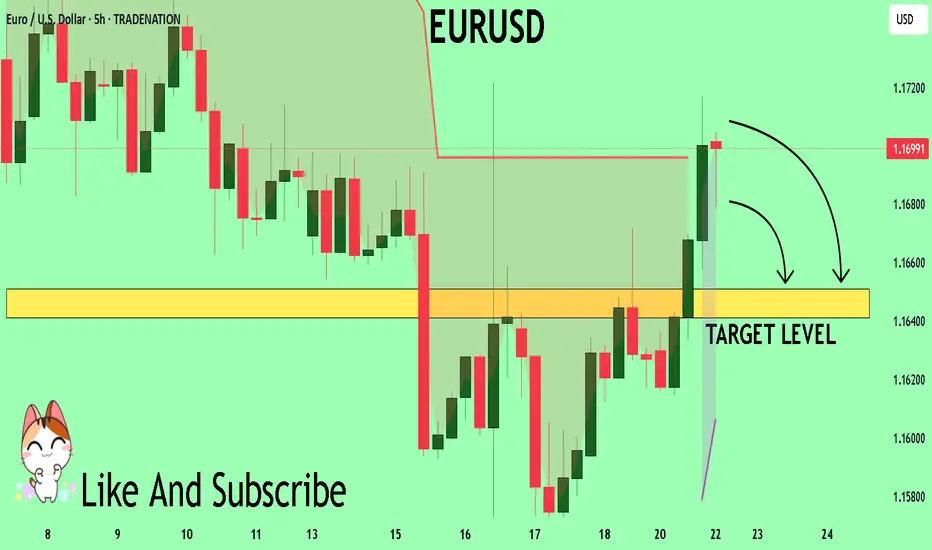
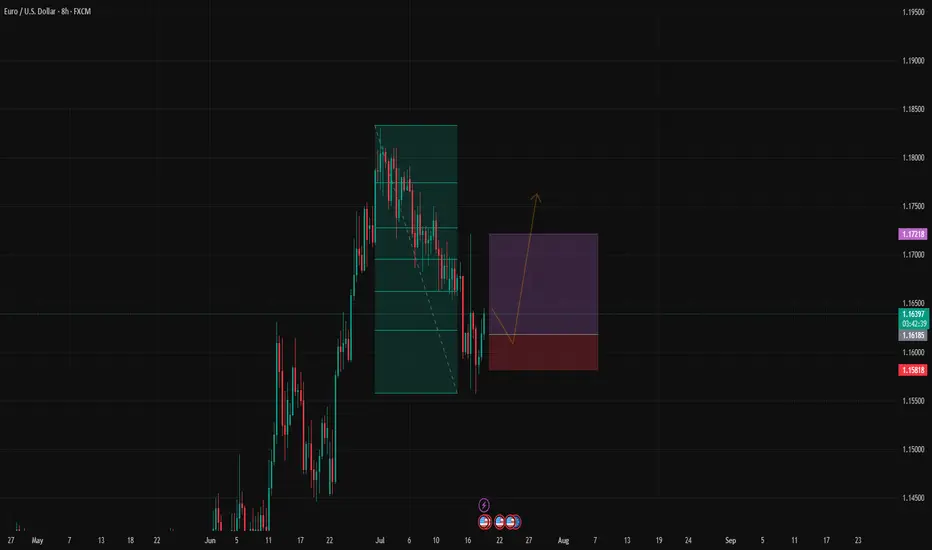
EURUSD Will Collapse! SELL!
My dear subscribers,
This is my opinion on the EURUSD next move:
The instrument tests an important psychological level 1.1696
Bias - Bearish
Technical Indicators: Supper Trend gives a precise Bearish signal, while Pivot Point HL predicts price changes and potential reversals in the market.
Target - 1.1651
About Used Indicators:
On the subsequent day, trading above the pivot point is thought to indicate ongoing bullish sentiment, while trading below the pivot point indicates bearish sentiment.
Disclosure: I am part of Trade Nation's Influencer program and receive a monthly fee for using their TradingView charts in my analysis.
———————————
WISH YOU ALL LUCK
EURGBP The Target Is DOWN! SELL!
My dear friends,
Please, find my technical outlook for EURGBP below:
The price is coiling around a solid key level - 0.8676
Bias - Bearish
Technical Indicators: Pivot Points High anticipates a potential price reversal.
Super trend shows a clear sell, giving a perfect indicators' convergence.
Goal - 0.8670
About Used Indicators:
The pivot point itself is simply the average of the high, low and closing prices from the previous trading day.
Disclosure: I am part of Trade Nation's Influencer program and receive a monthly fee for using their TradingView charts in my analysis.
———————————
WISH YOU ALL LUCK

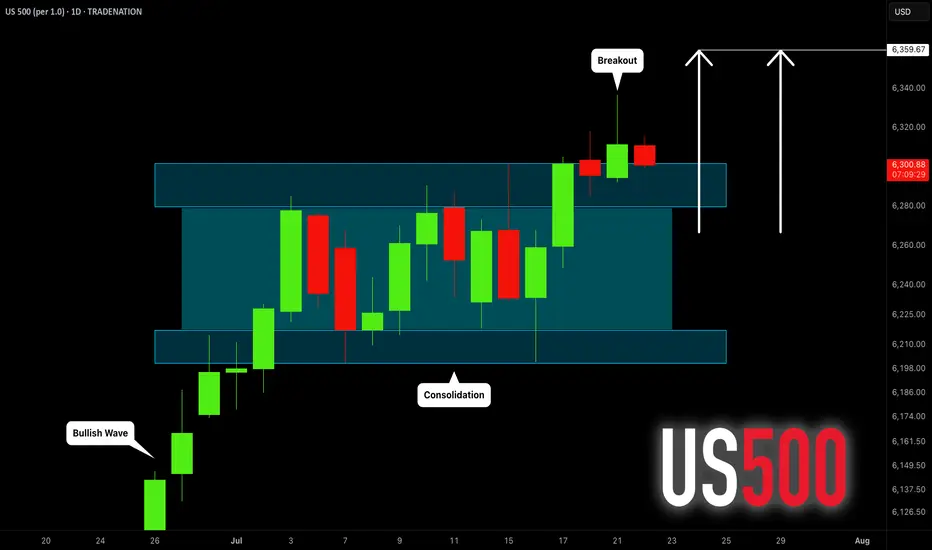
S&P500 INDEX (US500): Bullish Trend Continues
US500 updated a higher high this week, breaking a resistance
of a bullish flag pattern on a daily time frame.
I think that the market will rise even more.
Next goal for the bulls - 6359
❤️Please, support my work with like, thank you!❤️
I am part of Trade Nation's Influencer program and receive a monthly fee for using their TradingView charts in my analysis.
Before GER40 Roars, It WhispersHey guys👋
Here’s the latest GER40 analysis I’ve prepared for you:
🔻 If the **24,179** support level breaks, the next target is **23,972**.
🔺 If the **24,373** resistance level breaks, the next target is **24,511**.
🎯 I’ve shared two key levels with you — please monitor them carefully.
Every like from you gives me a big boost of motivation 🙏
Thanks to everyone who supports my work — truly appreciate it 💙

USDJPY Correction Complete, Is the Bullish Trend Back in play?After pulling back from the recent high near 149.17, USDJPY has shown signs of strength again, rebounding off the confluence support at the ascending trendline. The bullish narrative is supported by a hawkish FOMC tone and news that a U.S. federal court temporarily blocked Trump-era tariffs. The pair now awaits upcoming U.S. economic data for further directional clarity.
🔍 Technical Outlook – Structure & Momentum
✅ Primary trend: Bullish
✅ Correction phase: Completed near CP zone and trendline
✅ Key structural areas: FVG Zone, CP Zone, and trendline remain intact
Price has responded positively from the CP Zone + OBS Buy Zone around 147.438, aligning with the uptrend line. As long as this structure holds, buyers may push the market toward the next resistance zones.
🧭 Trade Scenarios
🔸 Bullish Bias (preferred scenario):
As long as price holds above 147.438, we expect continuation toward the FVG zone, with immediate targets at the GAP + OBS Sell Zone (148.703) and extended potential to the Buy-side Liquidity zone at 149.122.
A clean breakout above 149.122 opens the door to Fibonacci extensions: 149.72 and 150.05.
🔹 Bearish Scenario (if invalidated):
If price breaks below 147.438 and loses the trendline, we may see a deeper drop toward the Liquidity Buy Zone at 146.825, where strong buying interest is expected to re-enter the market.
⚠️ Macro Risk Drivers
Hawkish FOMC minutes continue to support USD strength
Paused trade tariffs reduce political headwinds, improving risk sentiment
Upcoming U.S. economic data could trigger sharp intraday moves → watch closely
📌 Key Price Zones
Liquidity Buy Zone 146.825 Major long re-entry zone
CP + OBS Buy Zone 147.438 Current active support
FVG Zone 148.20 – 148.68 Intraday bullish target
GAP + OBS Sell Zone 148.703 Short-term resistance
Buy-side Liquidity Zone 149.122 Final bullish objective
💬 Structure remains bullish unless the trendline breaks. Stay patient, wait for confirmations at key zones, and follow your plan with disciplined risk management.

GOLD: Strong Bullish Sentiment! Long!
My dear friends,
Today we will analyse GOLD together☺️
The in-trend continuation seems likely as the current long-term trend appears to be strong, and price is holding above a key level of 3,392.264 So a bullish continuation seems plausible, targeting the next high. We should enter on confirmation, and place a stop-loss beyond the recent swing level.
❤️Sending you lots of Love and Hugs❤️

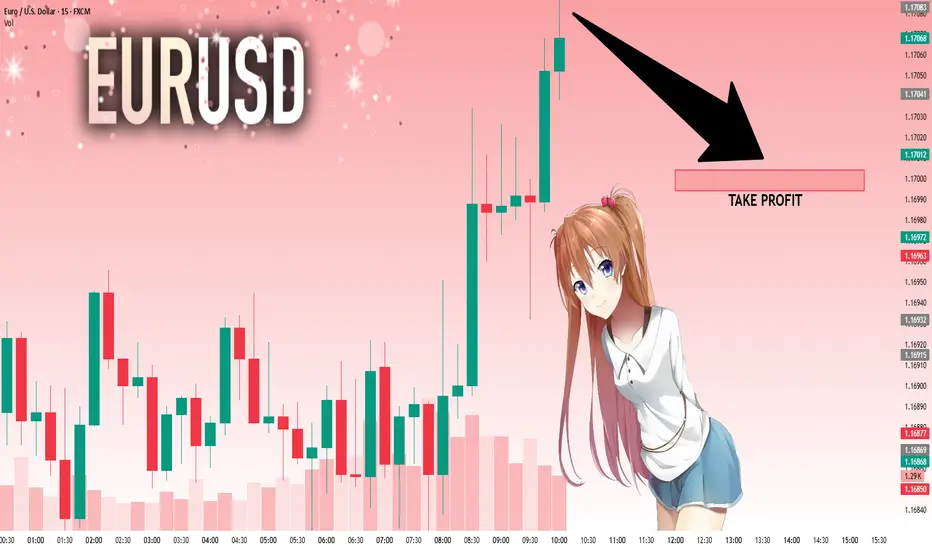
EURUSD: Bears Are Winning! Short!
My dear friends,
Today we will analyse EURUSD together☺️
The market is at an inflection zone and price has now reached an area around 1.17083 where previous reversals or breakouts have occurred.And a price reaction that we are seeing on multiple timeframes here could signal the next move down so we can enter on confirmation, and target the next key level of 1.17004..Stop-loss is recommended beyond the inflection zone.
❤️Sending you lots of Love and Hugs❤️
NYKAA<>BreakoutA breakout is occurring with increasing volume. A high-volume close above the 221-222 level would confirm the breakout, potentially from a Cup & Handle pattern.
Keeping on radar.

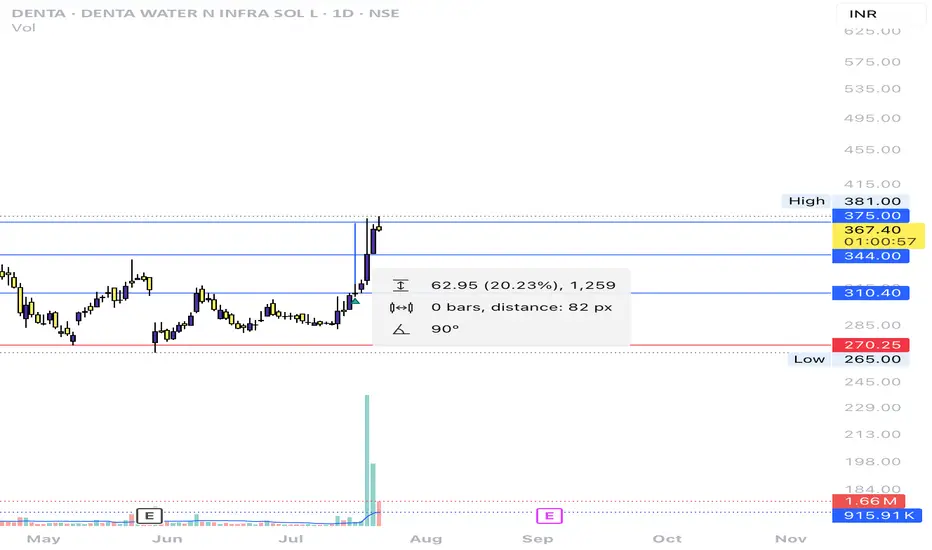
Denta Water & Infra Solutions Ltd <>Returns Chart shared on July 16th has already yielded a 20%+ return. Analysis suggests the stock should consolidate at its current high level after the recent steep rise, followed by a potential breakout.
#012: LONG Investment Opportunity on EUR/USD
In this scenario, I placed a passive long order on EUR/USD at a key zone that has shown signs of accumulation and institutional defense in recent days.
The price showed bearish manipulation followed by a sharp rebound with a V-shaped pattern, often indicative of stop-loss hunting. In these phases, a direct entry is less effective than a passive strategy aimed at intercepting a possible technical pullback in the zone where abnormal volumes and algorithmic defenses have manifested.
The order was designed to be activated only if the market were to temporarily return to the previously absorbed zone, thus avoiding chasing the price after a directional candlestick.
The stop-loss placement was carefully chosen to avoid both typical retail hunting zones and areas visible to algorithms. It is positioned to ensure operational invisibility, but also consistency with the logic of institutional defense: if reached, the trade will be automatically invalidated.
The target is aligned with the superior technical structure and the normal range of movement that develops when this dynamic is respected.
This operation is designed to be left to operate completely autonomously, without the need for adjustments or active management. Either in or out. The sole objective is to align with institutional flows, with controlled risk and a favorable management structure.
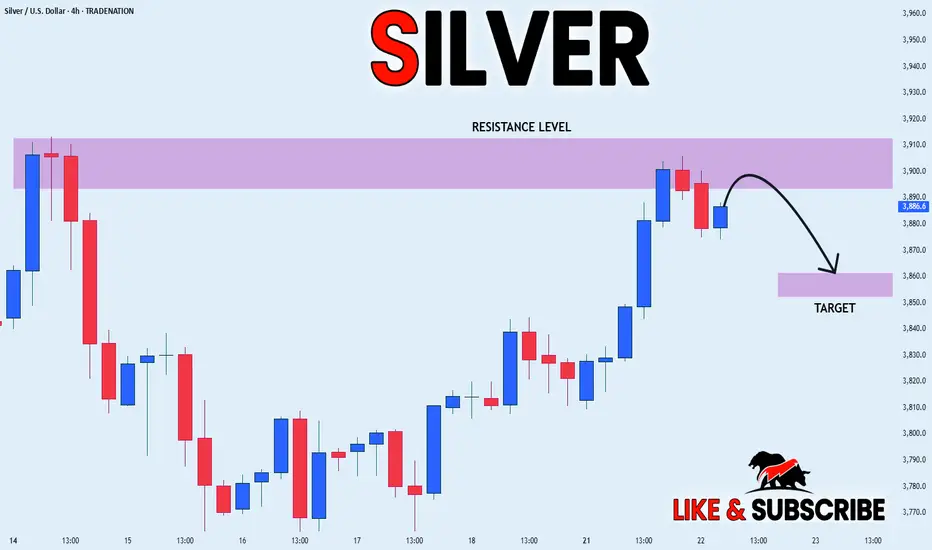
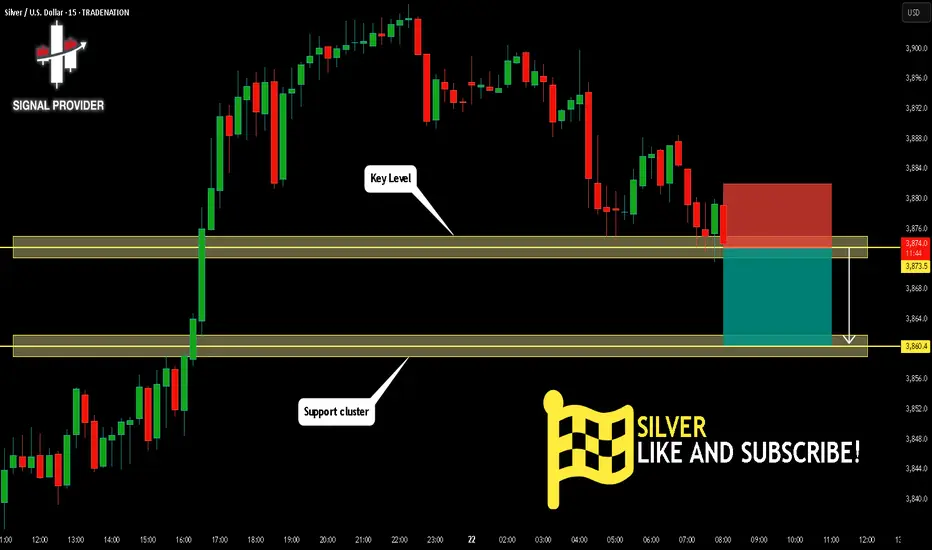
SILVER Is Going Down! Short!
Here is our detailed technical review for SILVER.
Time Frame: 15m
Current Trend: Bearish
Sentiment: Overbought (based on 7-period RSI)
Forecast: Bearish
The market is on a crucial zone of supply 3,873.5.
The above-mentioned technicals clearly indicate the dominance of sellers on the market. I recommend shorting the instrument, aiming at 3,860.4 level.
P.S
We determine oversold/overbought condition with RSI indicator.
When it drops below 30 - the market is considered to be oversold.
When it bounces above 70 - the market is considered to be overbought.
Disclosure: I am part of Trade Nation's Influencer program and receive a monthly fee for using their TradingView charts in my analysis.
Like and subscribe and comment my ideas if you enjoy them!
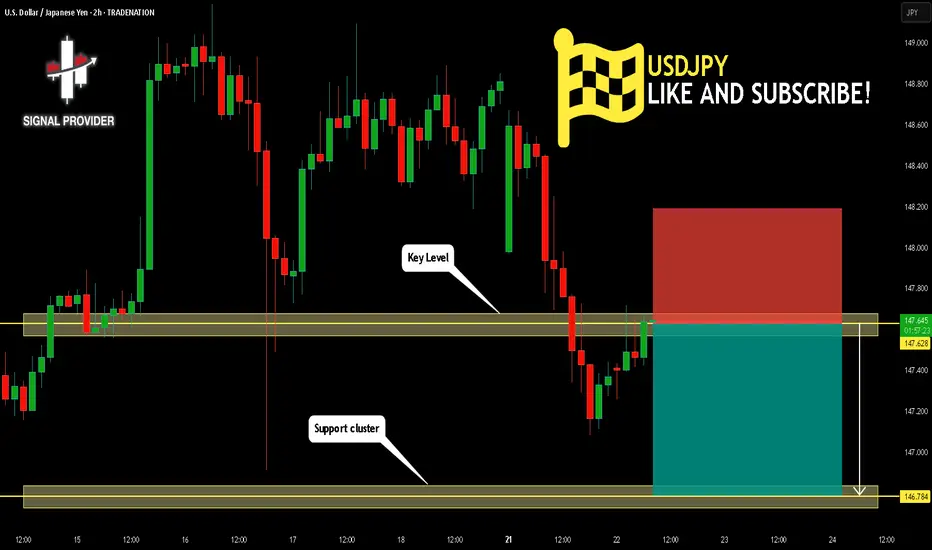
USDJPY Will Fall! Sell!
Take a look at our analysis for USDJPY.
Time Frame: 2h
Current Trend: Bearish
Sentiment: Overbought (based on 7-period RSI)
Forecast: Bearish
The price is testing a key resistance 147.628.
Taking into consideration the current market trend & overbought RSI, chances will be high to see a bearish movement to the downside at least to 146.784 level.
P.S
Overbought describes a period of time where there has been a significant and consistent upward move in price over a period of time without much pullback.
Disclosure: I am part of Trade Nation's Influencer program and receive a monthly fee for using their TradingView charts in my analysis.
Like and subscribe and comment my ideas if you enjoy them!
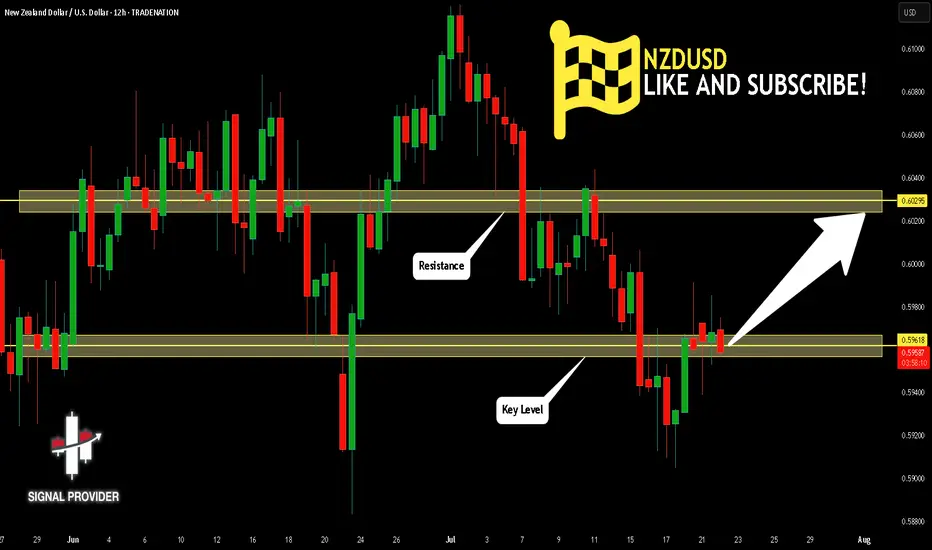
NZDUSD Will Go Higher From Support! Long!
Please, check our technical outlook for NZDUSD.
Time Frame: 12h
Current Trend: Bullish
Sentiment: Oversold (based on 7-period RSI)
Forecast: Bullish
The market is trading around a solid horizontal structure 0.596.
The above observations make me that the market will inevitably achieve 0.602 level.
P.S
Please, note that an oversold/overbought condition can last for a long time, and therefore being oversold/overbought doesn't mean a price rally will come soon, or at all.
Disclosure: I am part of Trade Nation's Influencer program and receive a monthly fee for using their TradingView charts in my analysis.
Like and subscribe and comment my ideas if you enjoy them!
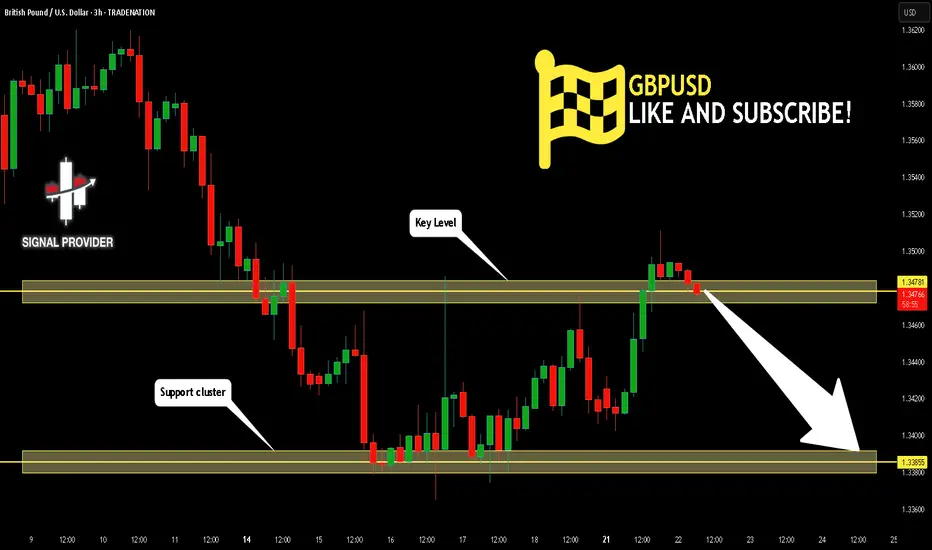
GBPUSD Will Go Down From Resistance! Short!
Here is our detailed technical review for GBPUSD.
Time Frame: 3h
Current Trend: Bearish
Sentiment: Overbought (based on 7-period RSI)
Forecast: Bearish
The market is testing a major horizontal structure 1.347.
Taking into consideration the structure & trend analysis, I believe that the market will reach 1.338 level soon.
P.S
The term oversold refers to a condition where an asset has traded lower in price and has the potential for a price bounce.
Overbought refers to market scenarios where the instrument is traded considerably higher than its fair value. Overvaluation is caused by market sentiments when there is positive news.
Disclosure: I am part of Trade Nation's Influencer program and receive a monthly fee for using their TradingView charts in my analysis.
Like and subscribe and comment my ideas if you enjoy them!
USOIL BULLS ARE STRONG HERE|LONG
USOIL SIGNAL
Trade Direction: long
Entry Level: 65.32
Target Level: 68.59
Stop Loss: 63.13
RISK PROFILE
Risk level: medium
Suggested risk: 1%
Timeframe: 8h
Disclosure: I am part of Trade Nation's Influencer program and receive a monthly fee for using their TradingView charts in my analysis.
✅LIKE AND COMMENT MY IDEAS✅
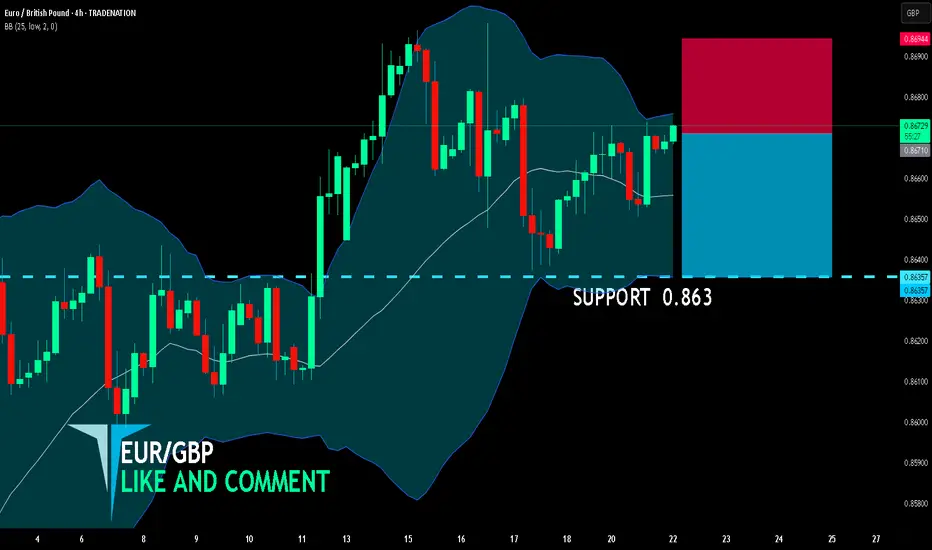
EUR/GBP SHORT FROM RESISTANCE
EUR/GBP SIGNAL
Trade Direction: short
Entry Level: 0.867
Target Level: 0.863
Stop Loss: 0.869
RISK PROFILE
Risk level: medium
Suggested risk: 1%
Timeframe: 4h
Disclosure: I am part of Trade Nation's Influencer program and receive a monthly fee for using their TradingView charts in my analysis.
✅LIKE AND COMMENT MY IDEAS✅
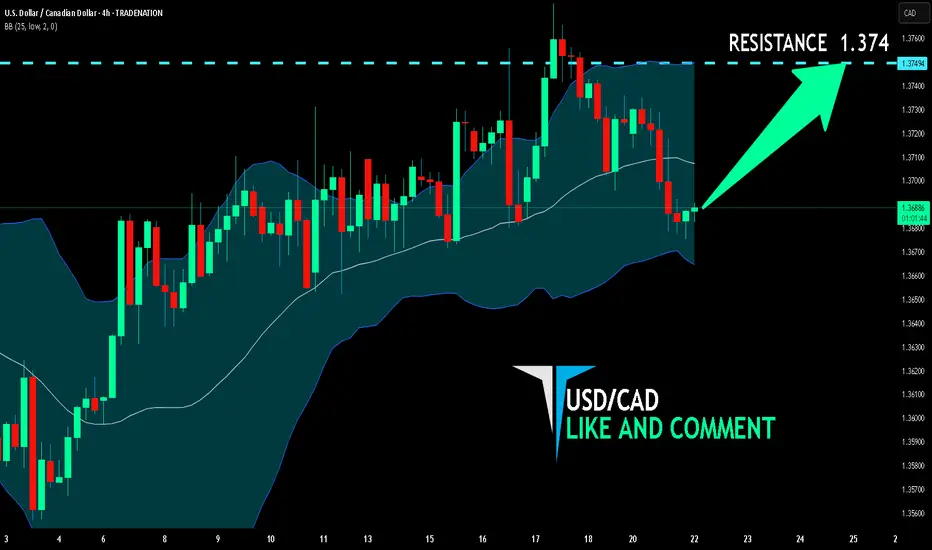
USD/CAD BULLS WILL DOMINATE THE MARKET|LONG
Hello, Friends!
USD/CAD pair is in the uptrend because previous week’s candle is green, while the price is clearly falling on the 4H timeframe. And after the retest of the support line below I believe we will see a move up towards the target above at 1.374 because the pair is oversold due to its proximity to the lower BB band and a bullish correction is likely.
Disclosure: I am part of Trade Nation's Influencer program and receive a monthly fee for using their TradingView charts in my analysis.
✅LIKE AND COMMENT MY IDEAS✅
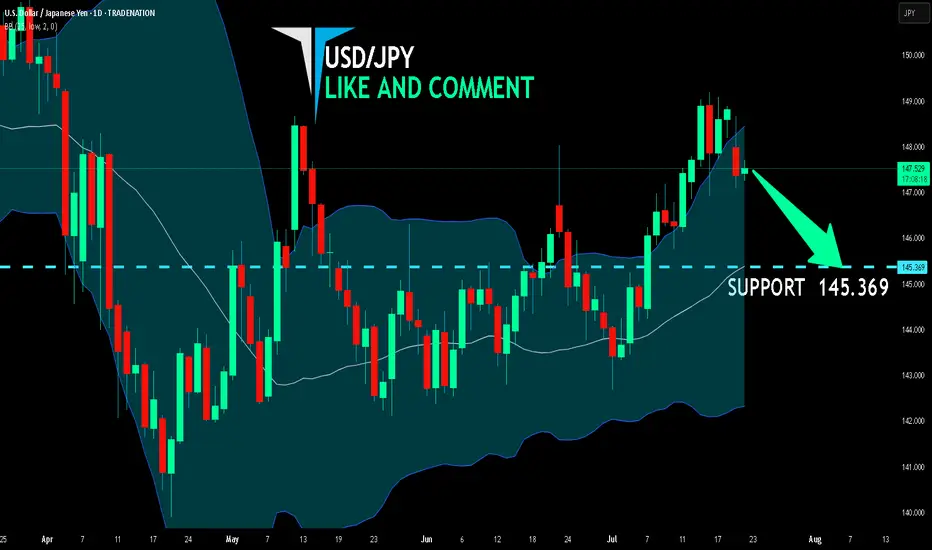
USD/JPY SENDS CLEAR BEARISH SIGNALS|SHORT
Hello, Friends!
USD/JPY pair is trading in a local uptrend which we know by looking at the previous 1W candle which is green. On the 1D timeframe the pair is going up too. The pair is overbought because the price is close to the upper band of the BB indicator. So we are looking to sell the pair with the upper BB line acting as resistance. The next target is 145.369 area.
Disclosure: I am part of Trade Nation's Influencer program and receive a monthly fee for using their TradingView charts in my analysis.
✅LIKE AND COMMENT MY IDEAS✅
SILVER LOCAL SHORT|
✅SILVER has retested a key resistance level of 39.10$
And as the pair is already making a bearish pullback
A move down to retest the demand level below at 38.61$ is likely
SHORT🔥
✅Like and subscribe to never miss a new idea!✅
Disclosure: I am part of Trade Nation's Influencer program and receive a monthly fee for using their TradingView charts in my analysis.