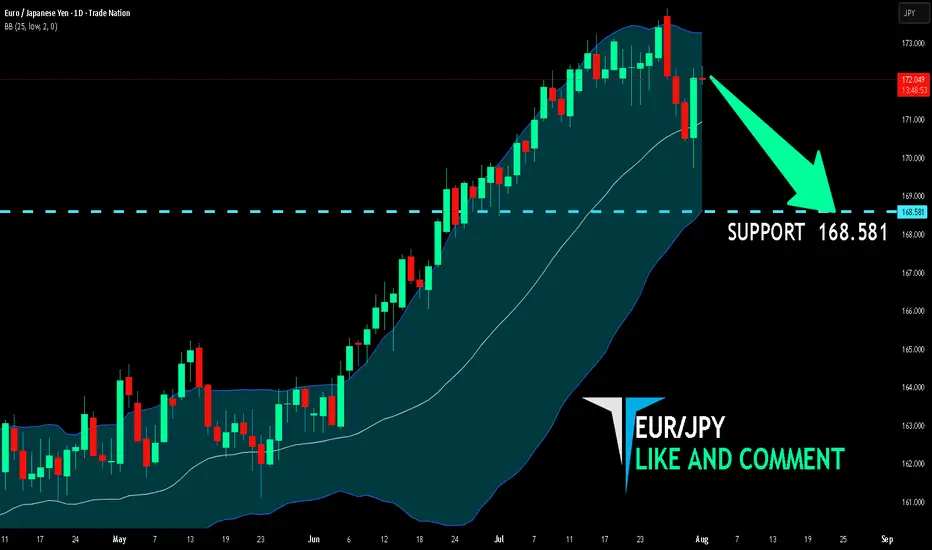
EUR/JPY BEARISH BIAS RIGHT NOW| SHORT
Hello, Friends!
We are now examining the EUR/JPY pair and we can see that the pair is going up locally while also being in a uptrend on the 1W TF. But there is also a powerful signal from the BB upper band being nearby, indicating that the pair is overbought so we can go short from the resistance line above and a target at 168.581 level.
Disclosure: I am part of Trade Nation's Influencer program and receive a monthly fee for using their TradingView charts in my analysis.
✅LIKE AND COMMENT MY IDEAS✅
Trading
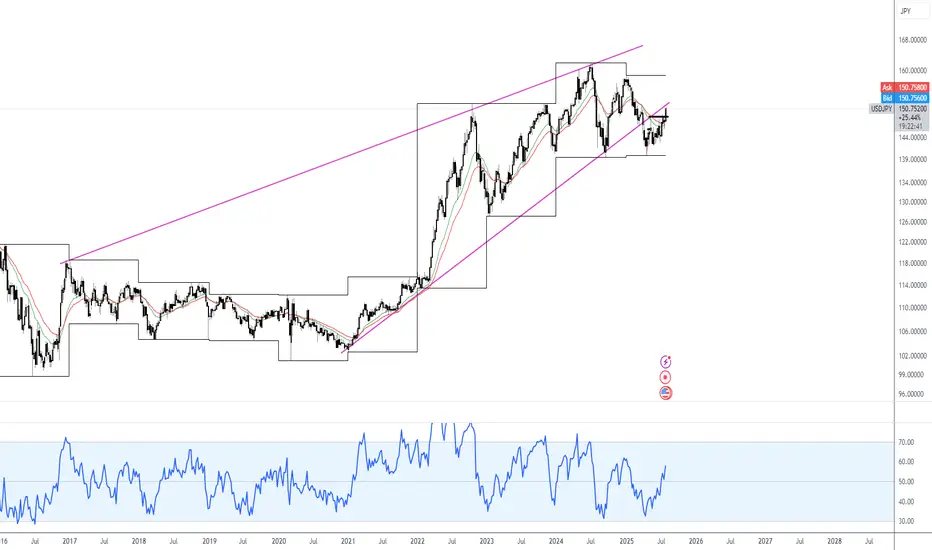
What we looking at heeeeeeeeeeere? My meaningful description is Im looking at this USDJPY pair and drawing magic lines, follow me for more meaningful insights.
TLDR possible long term down trend incoming, if confirmed, plentiful continuation shorts will be available to all.
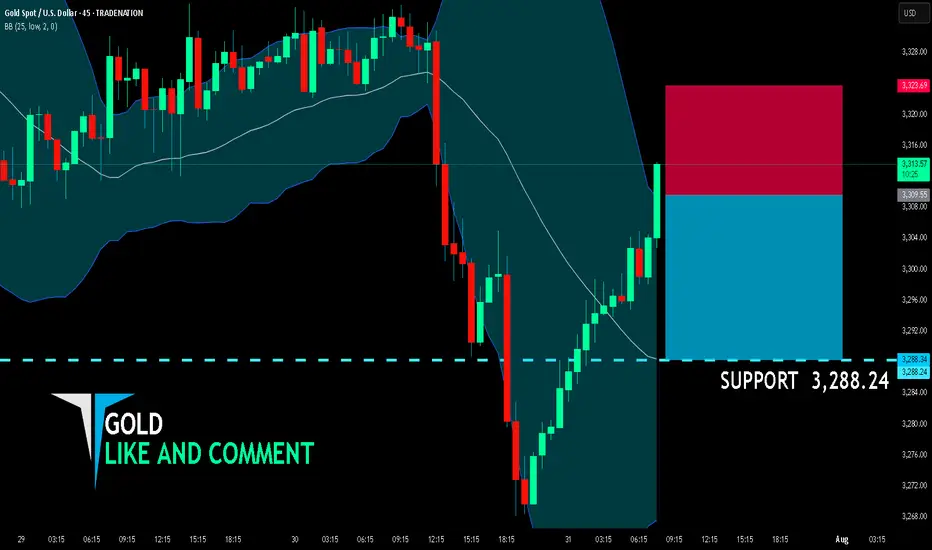
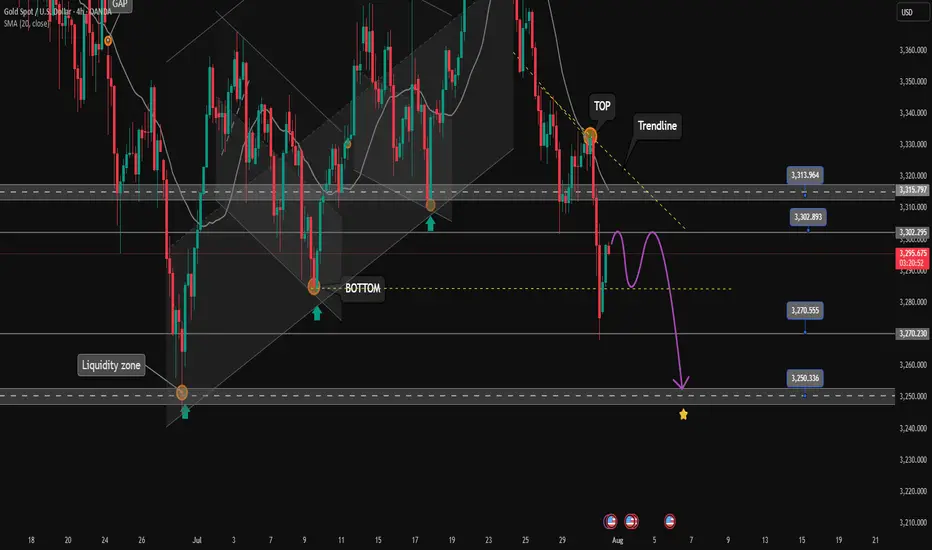
GOLD BEST PLACE TO SELL FROM|SHORT
GOLD SIGNAL
Trade Direction: short
Entry Level: 3,309.55
Target Level: 3,288.24
Stop Loss: 3,323.69
RISK PROFILE
Risk level: medium
Suggested risk: 1%
Timeframe: 45m
Disclosure: I am part of Trade Nation's Influencer program and receive a monthly fee for using their TradingView charts in my analysis.
✅LIKE AND COMMENT MY IDEAS✅
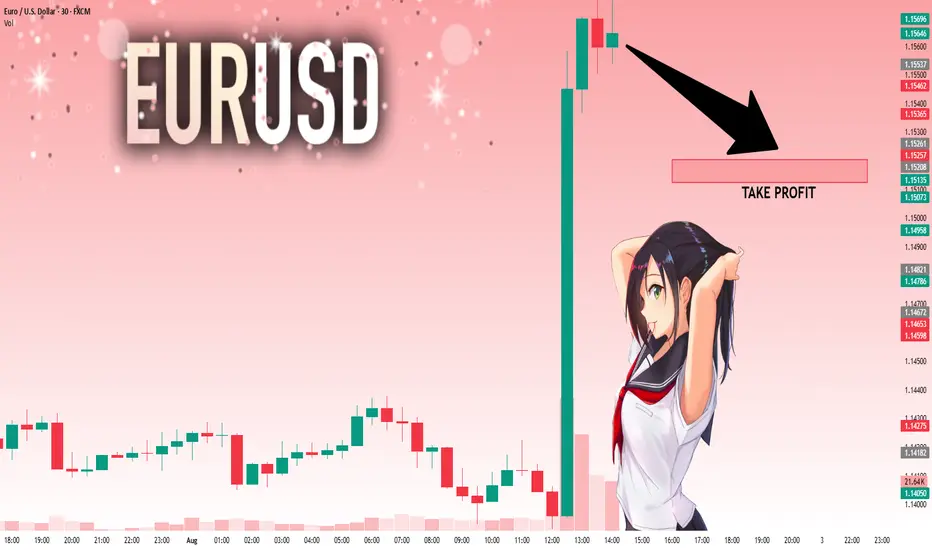
EURUSD: Move Down Expected! Short!
My dear friends,
Today we will analyse EURUSD together☺️
The price is near a wide key level
and the pair is approaching a significant decision level of 1.15337 Therefore, a strong bullish reaction here could determine the next move up.We will watch for a confirmation candle, and then target the next key level of 1.15208.Recommend Stop-loss is beyond the current level.
❤️Sending you lots of Love and Hugs❤️
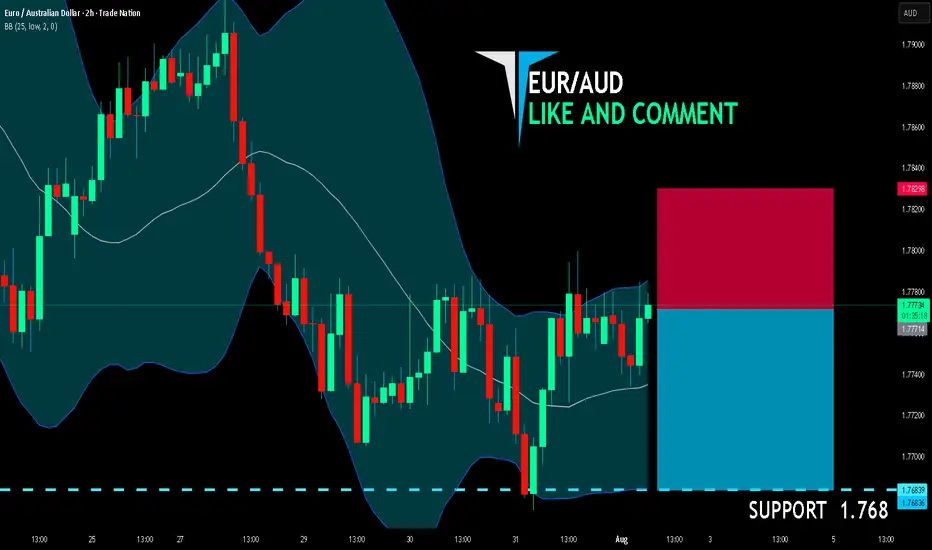
EUR/AUD BEARS ARE GAINING STRENGTH|SHORT
EUR/AUD SIGNAL
Trade Direction: short
Entry Level: 1.777
Target Level: 1.768
Stop Loss: 1.782
RISK PROFILE
Risk level: medium
Suggested risk: 1%
Timeframe: 2h
Disclosure: I am part of Trade Nation's Influencer program and receive a monthly fee for using their TradingView charts in my analysis.
✅LIKE AND COMMENT MY IDEAS✅
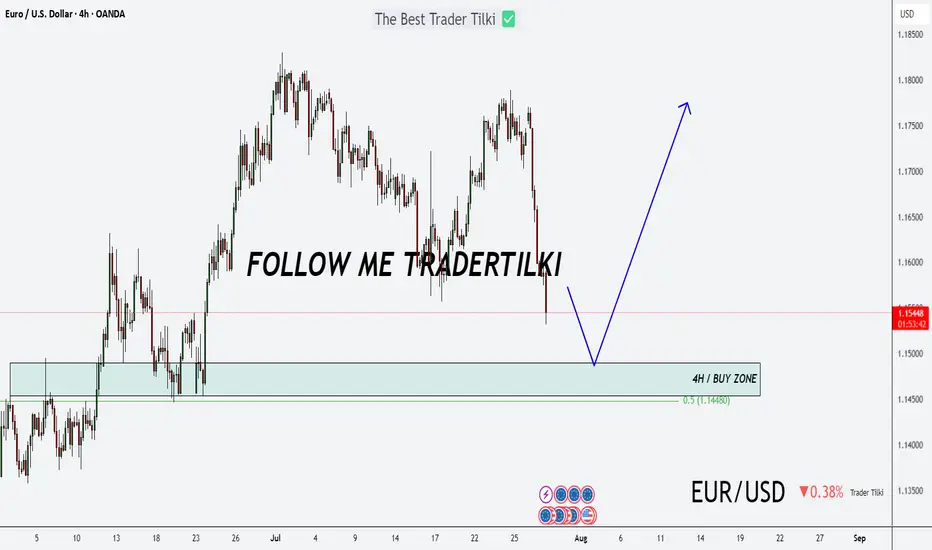
Major U.S. News Ahead—Will EURUSD Pivot?Good morning, my friends 👋
Here’s my EURUSD market analysis 📉
Currently, the pair is in a downtrend. I expect this downward move to end around 1.14899 or 1.14536, where a potential buying opportunity may emerge. I personally plan to enter a buy position once price reaches those zones 💼
Also, keep an eye on major U.S. economic reports being released today—they could trigger increased volatility 🔔
Every like you send is a huge source of motivation for me to keep sharing high-quality analysis 🙏 Thanks to everyone supporting the channel 💙
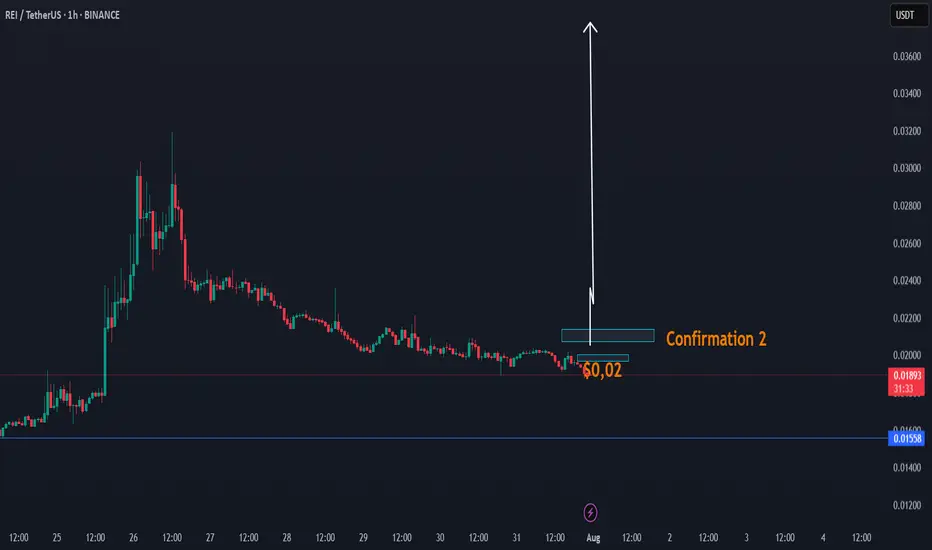
DAY UPDATE REI/USDT THE INCREASE CANDLE OF UP $0,03 - $0,05REI is an interesting coin since the update of Q4
We have seen that this coin was able to increase to $0,031 and until here $0,018 zone, a return to where we are now. There is a high chance that this coin can recover next 24H if this coin is able to confirm the confirmation $0,02 - $0,021
This coin, as before, was targeted at $ 0.02 and had low volume. We expect that if it comes back to $ 0.02, it will be confirmation of the volume, which can take the trend with a candle to up $0,03
REI CONFIRMATIONS ZONE
Higher time frame
When you look normally at this coin, then this coin is in a trend line of breakdown. This can change with the next confirmations. The question is, are we going to see again $0,02 the next 24h? If yes high chance of a break.
We also have a cycle update 2025, check it here, expecting $0,90
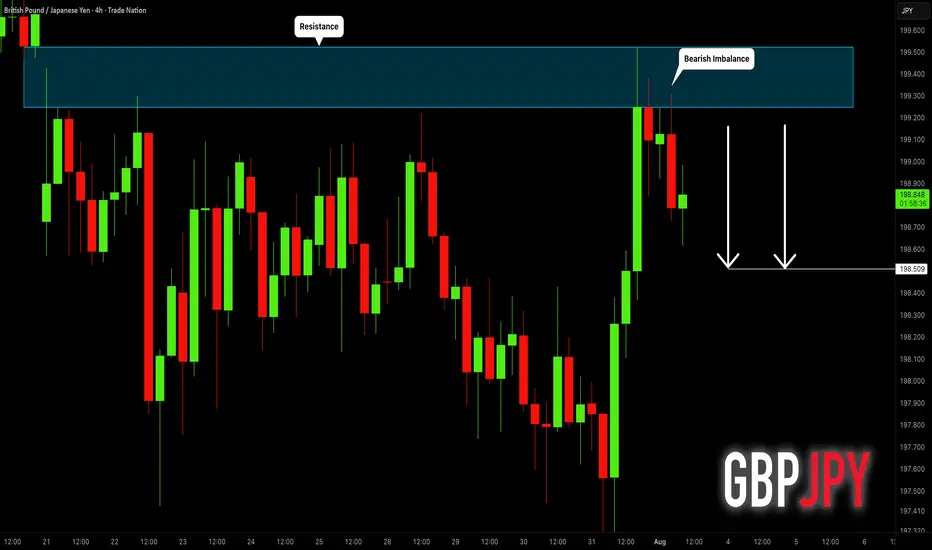
GBPJPY: Pullback From Resistance 🇬🇧🇯🇵
I think that GBPJPY will pull back from a wide
intraday supply area.
As a confirmation, I see a bearish imbalance candle that
is formed after its test.
Goal - 198.51
❤️Please, support my work with like, thank you!❤️
I am part of Trade Nation's Influencer program and receive a monthly fee for using their TradingView charts in my analysis.
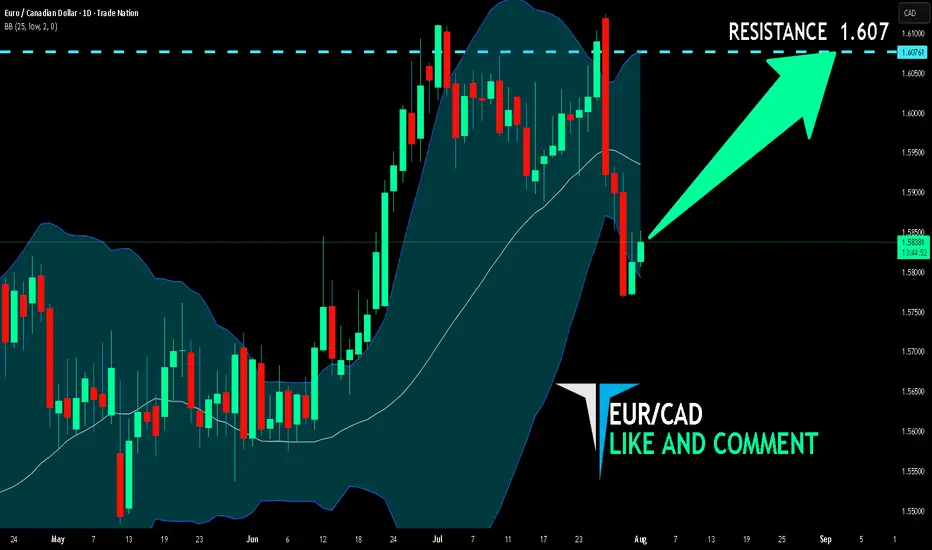
EUR/CAD BUYERS WILL DOMINATE THE MARKET|LONG
Hello, Friends!
We are going long on the EUR/CAD with the target of 1.607 level, because the pair is oversold and will soon hit the support line below. We deduced the oversold condition from the price being near to the lower BB band. However, we should use low risk here because the 1W TF is red and gives us a counter-signal.
Disclosure: I am part of Trade Nation's Influencer program and receive a monthly fee for using their TradingView charts in my analysis.
✅LIKE AND COMMENT MY IDEAS✅
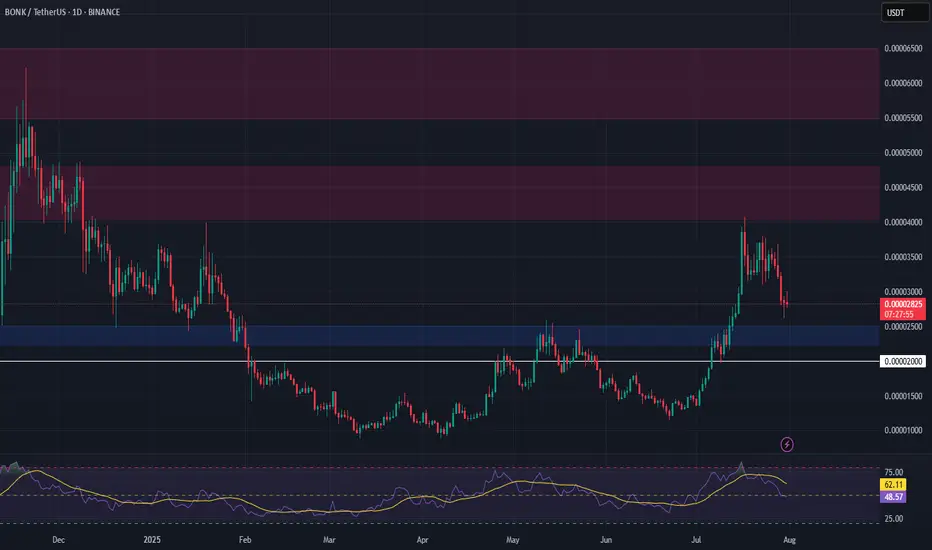
BONK Setup – Watching for Retracement After 200%+ RallyBONK has surged over 200% in recent weeks. We're now eyeing a retracement to a key support zone that could offer a prime entry for the next leg higher.
📌 Trade Setup:
• Entry Zone: $0.00002240 – $0.00002500
• Take Profit Targets:
o 🥇 $0.00004050 – $0.00004800
o 🥈 $0.00005500 – $0.00006500
• Stop Loss: Just below $0.00002000
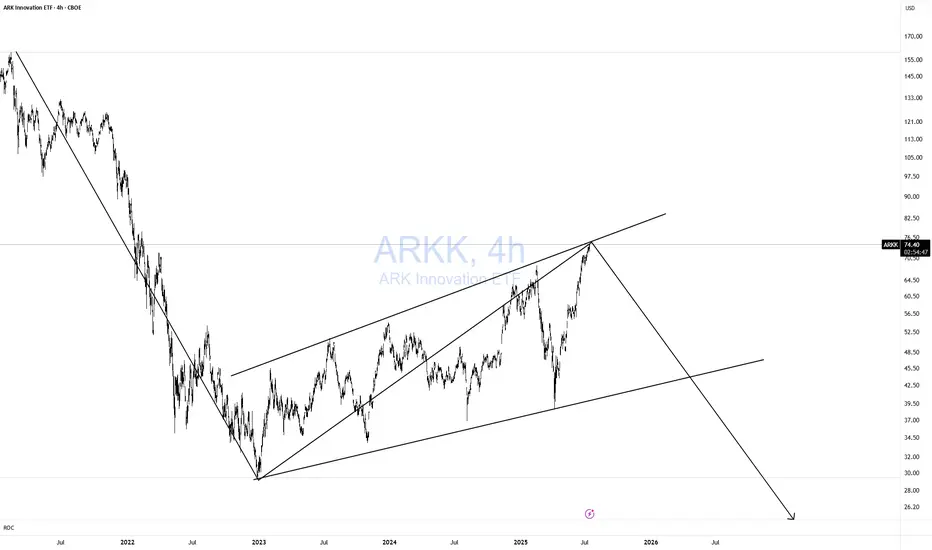
ARKK DOOMED!Classic 123 wave move down! As I like to say Short when no one else is looking! Not when everyone is looking. TOO LATE!
Simple but very effective pattern with excellent risk-reward. Remember, I am a macro trader, so don't expect to see a return on this investment tomorrow.
I won't get into the macro stuff.
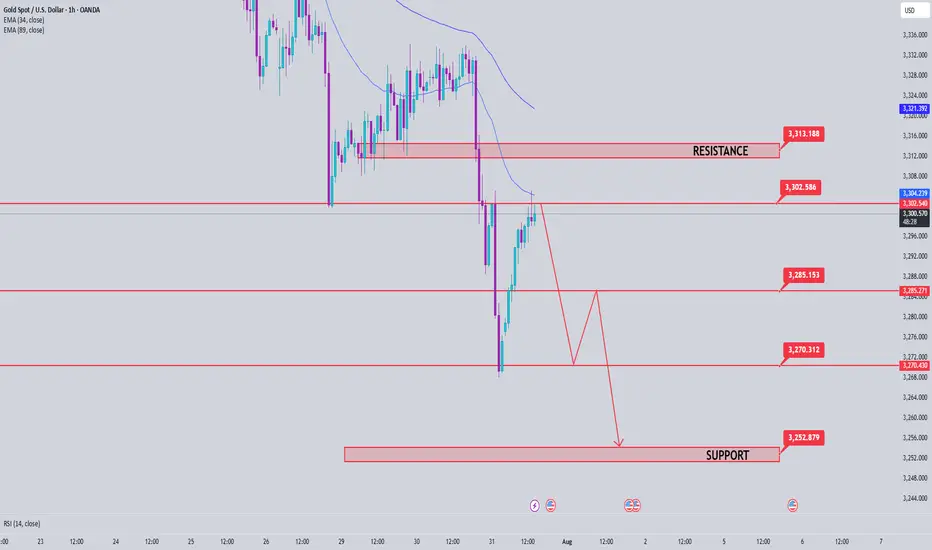
Gold price analysis July 31XAUUSD – Bearish pressure still prevails, watch for SELL in the direction of the trend
Yesterday's session witnessed a strong decline when the D1 candle closed with selling pressure up to 60 prices, forming a key candle that shapes the trend. When the market forms a main candle, the 25% and 50% candle body areas are often important price areas to continue trading in the direction of the main trend.
In the current context, the priority strategy will be to sell in the direction of the downtrend when the price rebounds to the resistance areas and there is a rejection signal.
🔹 Important resistance areas:
3301 – 3312 – 3333
🔸 Target support areas:
3285 – 3270 – 3250
🎯 Trading strategy:
Prioritize SELLing at the resistance area of 3301–3312 when there is a price reaction (rejection).
Target: 3250
BUY only considered when 3313 area is broken decisively.
Staying disciplined and sticking to the reaction price zone will be key in the context of the market moving in a clear trend.
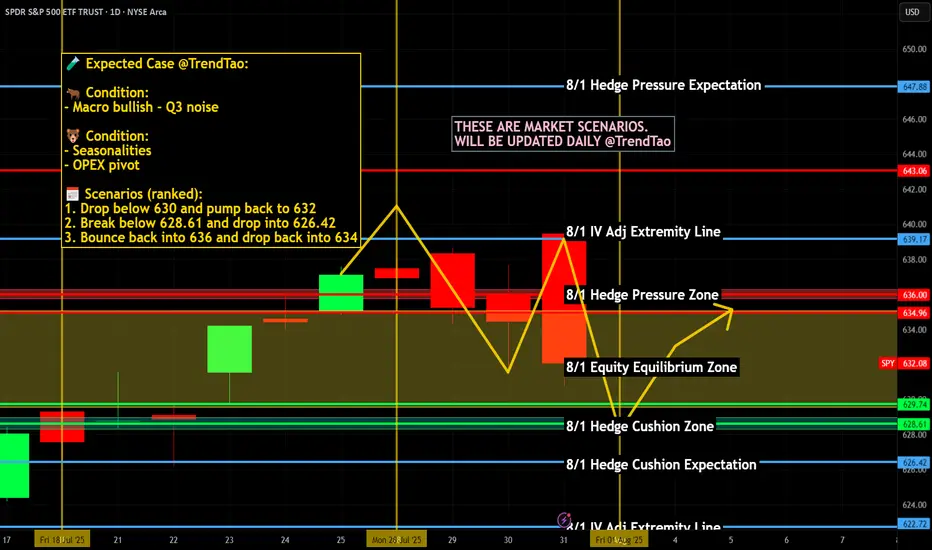
Nightly $SPY / $SPX Scenarios for August 1, 2025🔮 Nightly AMEX:SPY / SP:SPX Scenarios for August 1, 2025 🔮
🌍 Market-Moving News 🌍
📦 U.S. Imposes New Tariffs as Deadline Passes
Fresh tariffs rolled out on August 1 hitting major exporters: 25% on Indian goods, 20% on Taiwan, 19% on Thailand, and 15% on South Korea. Canadas tariff elevated to 35%, though Mexico got extra negotiation time. Global equity markets slipped modestly, led by declines in Asia-Pacific regions. AMEX:SPY futures also eased on mounting geopolitical and trade pressures.
🏦 Fed Uncertainty Mounts Despite Calm GDP
Despite robust Q2 GDP growth and a hold on interest rates this week, Fed Chair Jerome Powell faced growing unrest. Comments acknowledged downside labor risk amid trade uncertainty—investors are now assigning just a 39% chance of a rate cut in September.
📊 Key Data Releases & Events 📊
📅 Friday, August 1:
8:30 AM ET – Nonfarm Payrolls (July):
Payrolls rose by 106,000, less than June’s 147,000 but still positive. Wage growth slowed, easing inflation concerns slightly.
8:30 AM ET – Unemployment Rate:
Unemployment ticked up to 4.2%, from 4.1% in June—reflecting modest labor softness.
8:30 AM ET – Average Hourly Earnings (MoM):
Wages rose +0.2%, down from +0.4% in June, signaling wage pressure easing.
⚠️ Disclaimer:
This information is provided for educational and informational purposes only and should not be construed as financial advice. Always consult a licensed financial advisor before making investment decisions.
📌 #trading #stockmarket #economy #jobs #Fed #tariffs #inflation #technicalanalysis
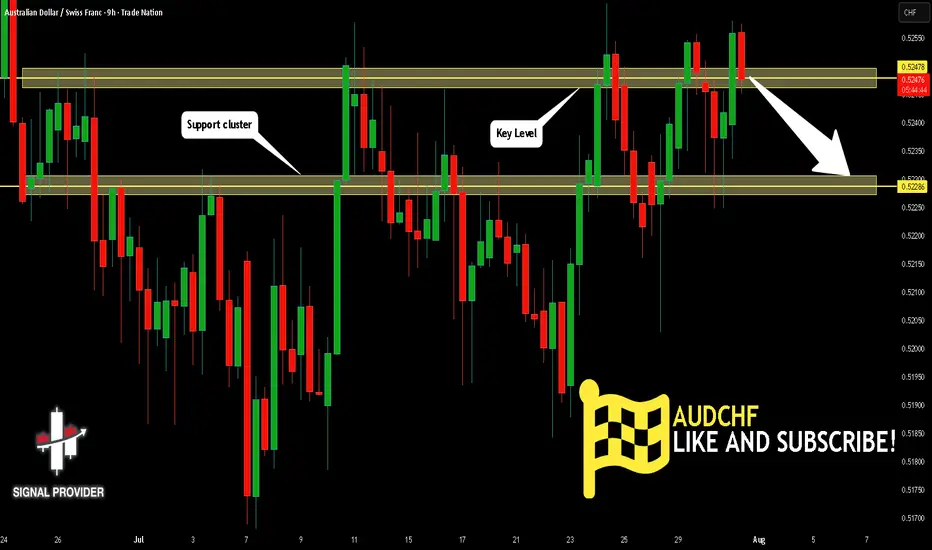
AUDCHF Will Go Down! Short!
Here is our detailed technical review for AUDCHF.
Time Frame: 9h
Current Trend: Bearish
Sentiment: Overbought (based on 7-period RSI)
Forecast: Bearish
The market is on a crucial zone of supply 0.524.
The above-mentioned technicals clearly indicate the dominance of sellers on the market. I recommend shorting the instrument, aiming at 0.522 level.
P.S
Please, note that an oversold/overbought condition can last for a long time, and therefore being oversold/overbought doesn't mean a price rally will come soon, or at all.
Disclosure: I am part of Trade Nation's Influencer program and receive a monthly fee for using their TradingView charts in my analysis.
Like and subscribe and comment my ideas if you enjoy them!
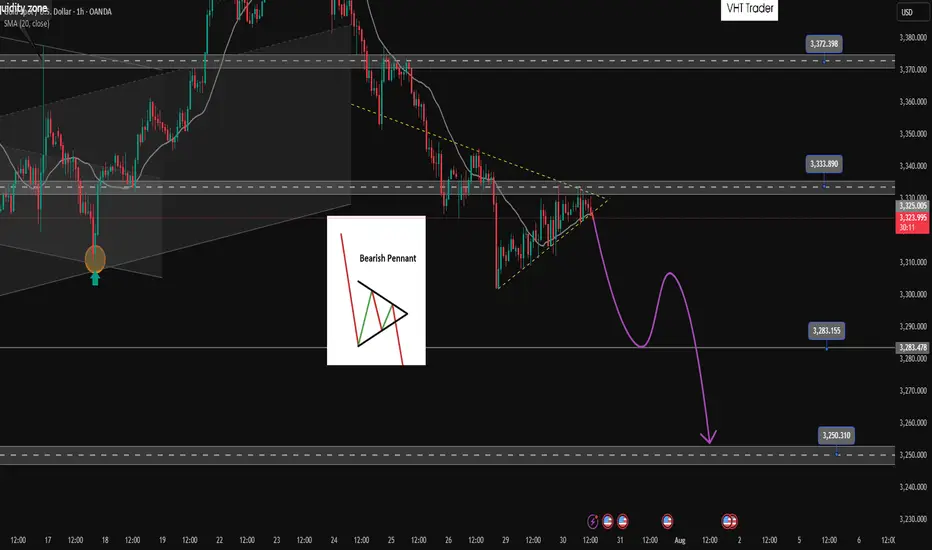
Bearish pennant pattern active. Active SELL✏️Gold price is forming a triangle accumulation pattern. That shows the hesitation of investors at the moment, they may be waiting for important economic indicators of the US this week. Just an impact that makes Price break out of the triangle border can create a strong FOMO trend. The price line is quite similar to the bearish pennant pattern and heading towards really strong support areas.
📉 Key Levels
SELL Trigger: Break bottom line 3324
Target 3285, lower is the 3250 area
BUY Trigger: Break and trading above 3333
BUY Trigger: Rejection and confirmation of candle at 3285
Leave your comments on the idea. I am happy to read your views.
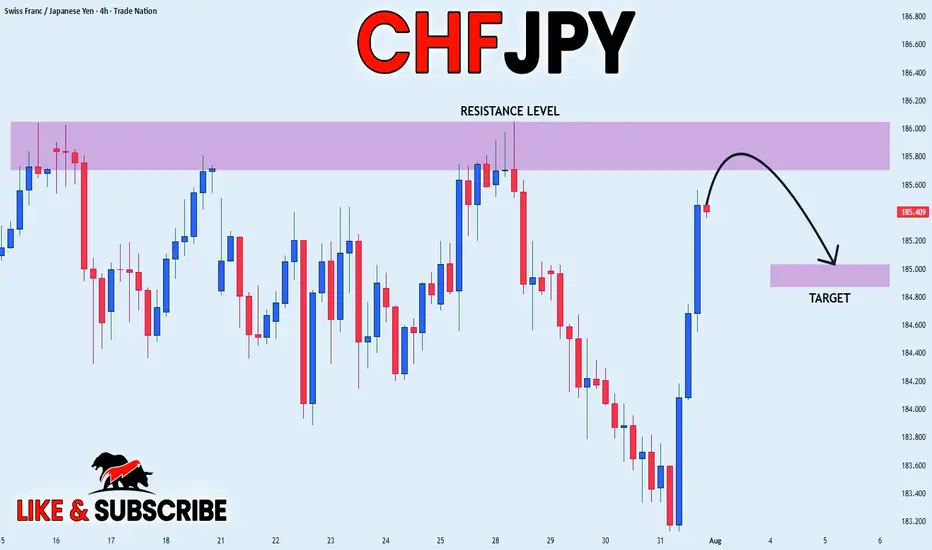
CHF_JPY LOCAL SHORT|
✅CHF_JPY has been growing recently
And the pair seems locally overbought
So as the pair is approaching a
Horizontal resistance of 186.000
Price decline is to be expected
SHORT🔥
✅Like and subscribe to never miss a new idea!✅
Disclosure: I am part of Trade Nation's Influencer program and receive a monthly fee for using their TradingView charts in my analysis.
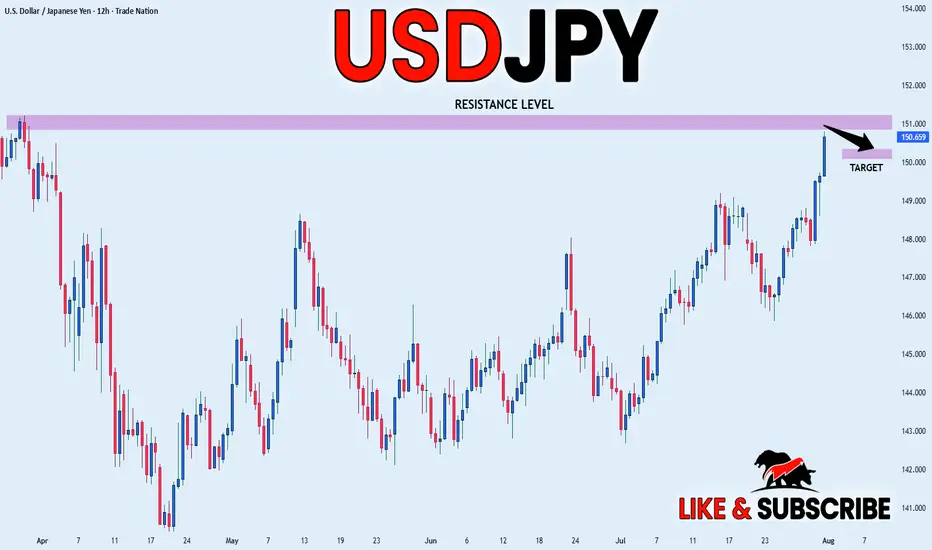
USD_JPY RESISTANCE AHEAD|SHORT|
✅USD_JPY is going up now
But a strong resistance level is ahead at 151.232
Thus I am expecting a pullback
And a move down towards the target of 150.368
SHORT🔥
✅Like and subscribe to never miss a new idea!✅
Disclosure: I am part of Trade Nation's Influencer program and receive a monthly fee for using their TradingView charts in my analysis.
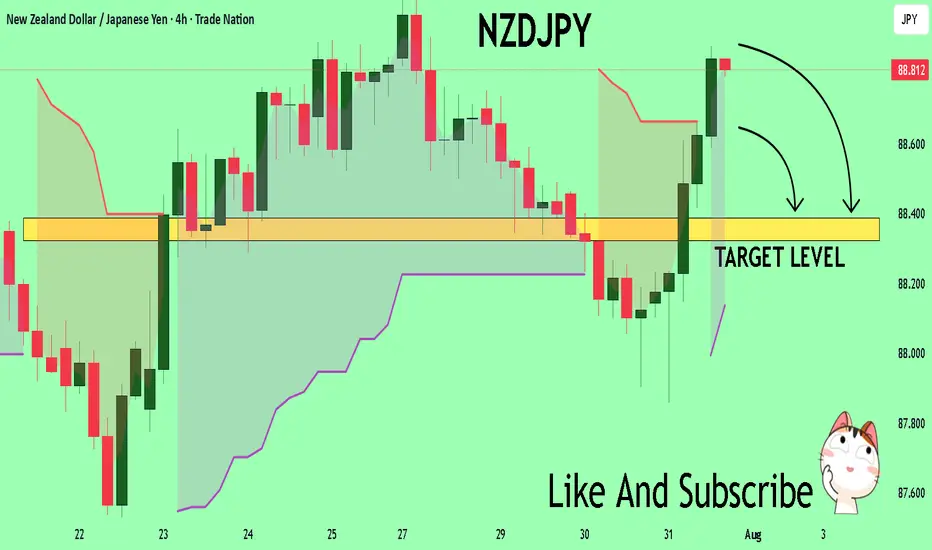
NZDJPY The Target Is DOWN! SELL!
My dear friends,
Please, find my technical outlook for NZDJPY below:
The price is coiling around a solid key level - 88.806
Bias - Bearish
Technical Indicators: Pivot Points Low anticipates a potential price reversal.
Super trend shows a clear sell, giving a perfect indicators' convergence.
Goal - 88.388
About Used Indicators:
The pivot point itself is simply the average of the high, low and closing prices from the previous trading day.
Disclosure: I am part of Trade Nation's Influencer program and receive a monthly fee for using their TradingView charts in my analysis.
———————————
WISH YOU ALL LUCK
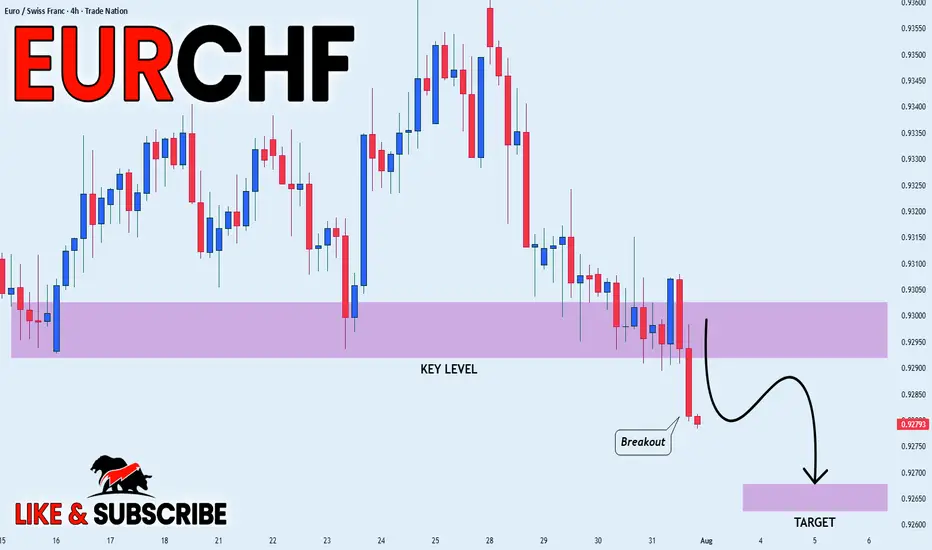
EUR_CHF WILL KEEP FALLING|SHORT|
✅EUR_CHF broke the key
Structure level of 0.9295
While trading in an local downtrend
Which makes me bearish
And I think that after the retest of the
Broken level is complete
A rebound and bearish
Continuation will follow
SHORT🔥
✅Like and subscribe to never miss a new idea!✅
Disclosure: I am part of Trade Nation's Influencer program and receive a monthly fee for using their TradingView charts in my analysis.
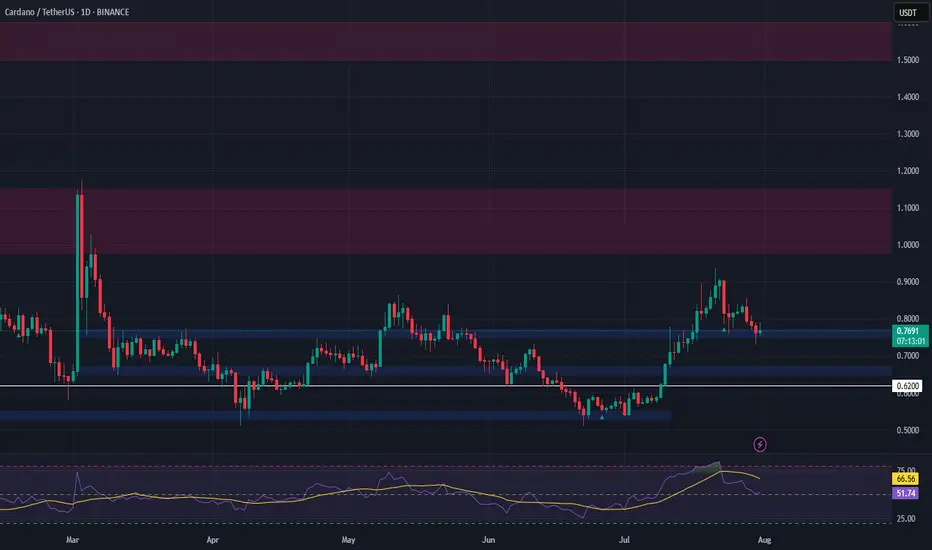
ADA Setup – Eyeing Entry After 70%+ RallyCardano (ADA) has surged over 70% in recent weeks. A healthy pullback is underway, and we’re watching the key support zone for a potential long entry targeting the next leg higher.
📌 Trade Setup:
• Entry Zone: $0.65 – $0.67
• Take Profit Targets:
o 🥇 $0.98 – $1.15
o 🥈 $1.50 – $1.60
• Stop Loss: Just below $0.62
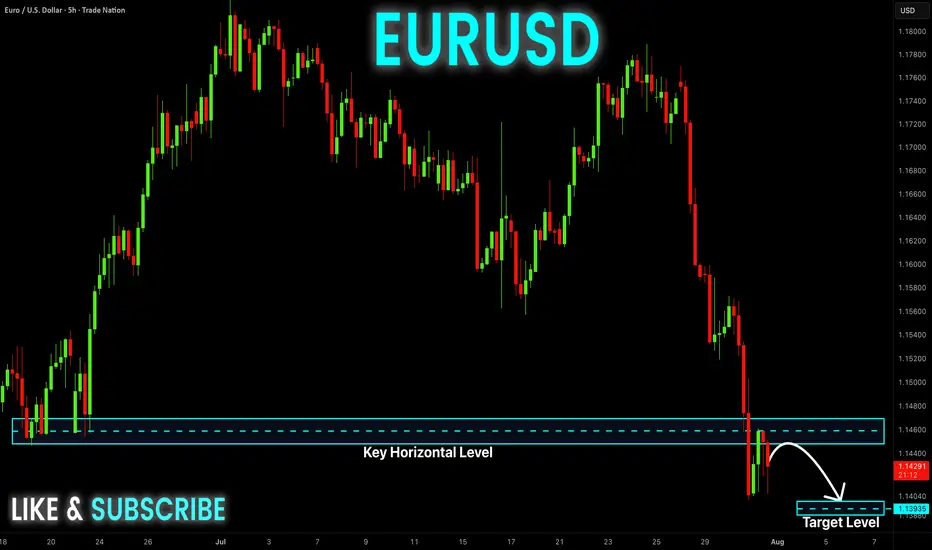
EUR-USD Bearish Breakout! Sell!
Hello,Traders!
EUR-USD made a bearish
Breakout of the key horizontal
Level of 1.1460 then made
A retest and a pullback so
We are bearish biased and
We will be expecting a
Further bearish continuation
Sell!
Comment and subscribe to help us grow!
Check out other forecasts below too!
Disclosure: I am part of Trade Nation's Influencer program and receive a monthly fee for using their TradingView charts in my analysis.
Follow master candle for today's SELL strategy✏️ OANDA:XAUUSD has continued a strong downtrend. Yesterday's D1 candle closed with a 60-price decrease, forming a master candle that determines the market trend. With the market having a master candle, pay attention to the 25% or 50% candle zones to trade in the direction of the trend. Today's main trading strategy will be to SELL according to the master candle. The BUY strategy will only be implemented when the 3313 zone is broken.
📉 Key Levels
Support: 3285-3270-3250
Resistance: 3301-3312-3333
SELL Trigger. Rejection 3301, 3312
Target 3250
Leave your comments on the idea. I am happy to read your views.
US30: Will Go Down! Short!
My dear friends,
Today we will analyse US30 together☺️
The recent price action suggests a shift in mid-term momentum. A break below the current local range around 47,577.1 will confirm the new direction downwards with the target being the next key level of 43,436.6 .and a reconvened placement of a stop-loss beyond the range.
❤️Sending you lots of Love and Hugs❤️
