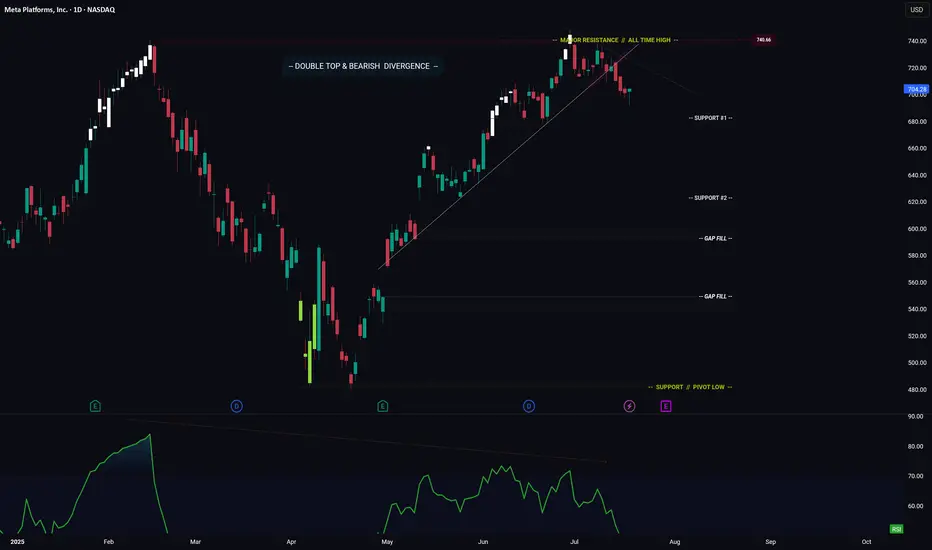
META -- Breakdown? Or Move Higher? Levels To Watch ForHello Traders!
Meta has broken down from its ascending trendline. This is bearish.
In addition price has formed a major Double Top pattern with Bearish Divergence.
Bearish Factors
1) Breakdown of ascending trendline
2) Double top
3) Bearish divergence
Two things need to happen if META is going to make a move higher...
1) Price needs to stay above "Support #1"
2) Price needs to break above the descending trendline (connecting the range highs)
IF price does breaks lower... where do we start looking for long positions?
- Support #2 is a great starting point, however if price makes it to support #2, then I could also see price trading down to fill the gap just below.
- This is where you could enter again to average down your position.
Thanks everyone and best of luck on your trading journey!
Trading
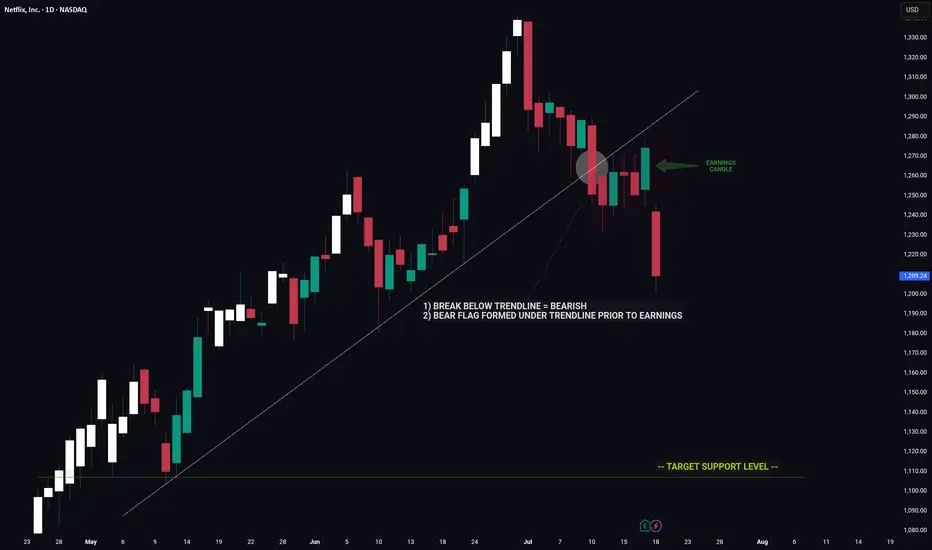
NETFLIX -- Price Signaled A Move Lower Prior To EarningsHello Traders!
The chart of NFLX is a great example of using clues to decipher a future move.
Prior to earnings we had major bearish indicators on the chart that hinted towards a move down on earnings.
1) Break below major trendline
2) Bear flag
These two signals by themselves are very bearish however the fact that these signals appeared coming into earnings was an even strong indicator of a potential for negative move.
Now that the upward trend is broken NFLX has a long way to fall before reaching the next key support level.
Thanks everyone and best of luck on your trading journey!
XAUUSD 4Hour TF - July 20th, 2025XAUUSD 7/20/2025
XAUUSD 4 hour Long Idea
Monthly - Bullish
Weekly - Bullish
Daily - Bullish
4hour - Bullish
GOLD,GOLD,GOLD. This thing has been bullish on all timeframes and doesn’t really show any signs of stopping just yet.
We can see two scenarios for the week ahead so let’s dive in:
Bullish continuation - Price action on gold is breaking out of a descending triangle pattern. This is a strong bullish move but for us to consider trades we want the confirmation.
Look for a retest of our 61.8% fib level and mostly recently broken structure. If we can spot bullish conviction coming off this level we can then consider targeting higher resistance levels like 3.395.000. Our -27% fib level lines up with this zone as well.
Bearish Reversal - For us to consider Gold bearish again we would need to see something very convincing. If we did see a break below 3,320.000 with a confirmed lower high I would then consider short scenarios.
Look to target toward major support levels on the way down to 3,225.000, our next monthly support zone.

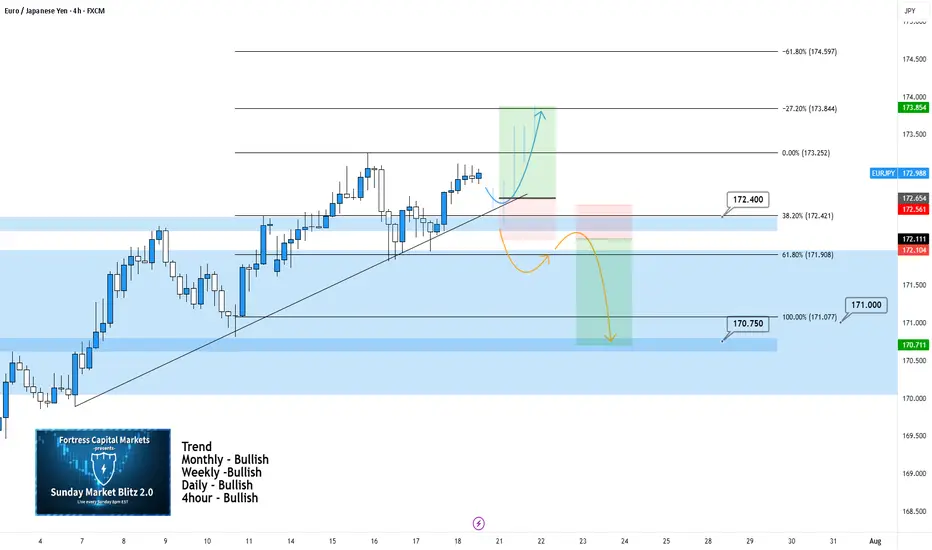
EURJPY 4Hour TF - July 20th, 2025EURJPY 7/20/2025
EURJPY 4hour Bullish Idea
Monthly - Bullish
Weekly - Bullish
Daily - Bullish
4hour - Bullish
Bullish Continuation - This is the most likely scenario for EJ this week as nothing suggests anything other than Bullish activity.
EJ could take off right at market open and start pushing up without giving us a retest to enter on. If we do get some sort of retest or pullback, look for rejection as close to 172.400 as possible before looking long.
If this does execute it looks like it will be a very small window of opportunity to enter. Trade cautiously with EJ in this bullish scenario.
Bearish Reversal - This scenario is less likely but is much more favorable in my opinion.
For us to consider EJ bearish we would need to see a clear break below 172.400 with a lower high below. This would give us enough confidence to consider short scenarios and start looking lower toward major support levels like 170.750.
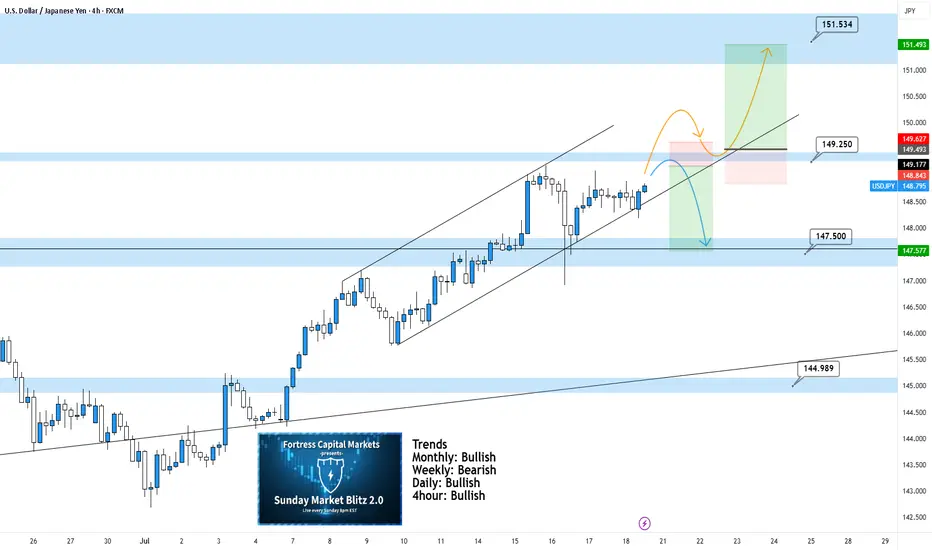
USDJPY 4Hour TF - July 20th,2025USDJPY 7/20/2025
USDJPY 4Hour Neutral Idea
Monthly - Bullish
Weekly - Bearish
Daily - Bullish
4Hour - Bullish
UJ is looking better than a couple weeks ago and at least we can spot some decent setups for the week ahead. These are NOT perfect setups but we have two scenarios that we are ready for if price action shows it is ready too. Here are the two scenarios we’re looking at for the week:
Bullish Continuation - We can see UJ in a nice 4hour channel but we are currently seeing a bit of flat price action. For us to consider UJ long setups again we would need to be convinced. Look for a break above our 149.250 zone with a confirmed higher low above. This would be enough to consider longs and target higher toward key levels of resistance.
Bearish Reversal - If price action continues to stall, this bearish setup will become more and more likely. Ideally, we want to see some strong rejection from our 149.250. If this happens look to target lower toward 147.500.
AUDJPY 4Hour TF - July 20th,2025AUDJPY 7/20/2025
AUDJPY 4hour Bullish Idea
Monthly - Bullish
Weekly - Bearish
Dailly - Bullish
4hour - Bullish
We’re looking mostly bullish on AJ going into this week but will this 96.500 hold as support? Let’s take a look at two potential scenarios for the week ahead:
Bullish Continuation - This is the most likely for AU this week according to the trends in play. For us to get confident in long scenarios, we would like to see strong bullish rejection from support around 96.500. If this happens look to target higher toward our negative fib levels and key resistance.
Bearish Reversal - For us to consider AJ bearish for the week, we would need to see some bearish pressure step in and push us below 96.500. If this happens we only need confirmation in the form of a lower high below 96.500.
Look to target lower toward major support levels like 94.500 area if this happens.

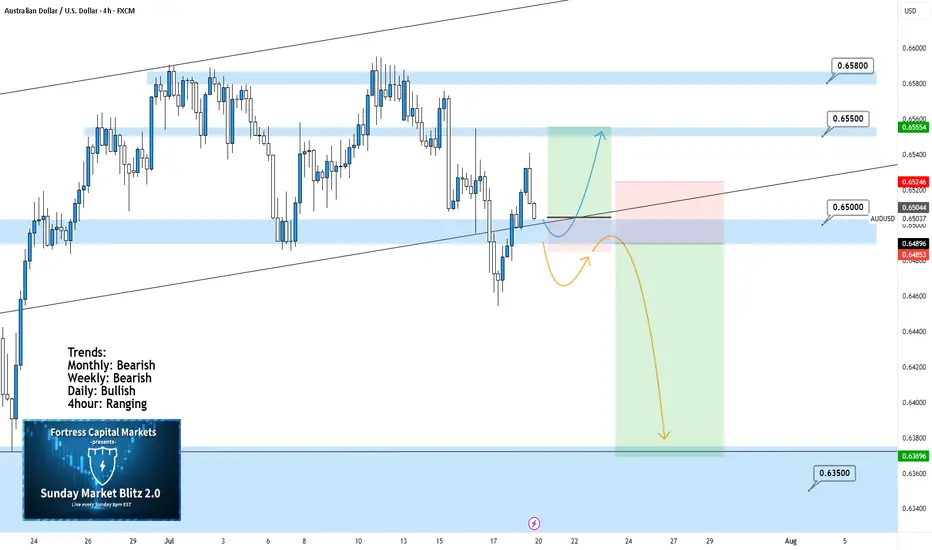
AUDUSD 4Hour TF - July 20th, 2025AUDUSD 7/20/2025
AUDUSD 4hour Neutral idea
Monthly - Bearish
Weekly - Bearish
Dailly - Bullish
4hour - Ranging
We’re looking at a fairly large range here on AU and although the higher timeframe suggests a potential bearish move, I am unsure until we have some clarity around 0.65000. Here are two scenarios that break down what could happen this week and how 0.65000 plays into it:
Range Continuation - Since late June we have seen price action establish this large range and stick to it (0.65800 Resistance & 0.65000 Support).
Currently, we can see price action attempting to break 0.65000 support but it has not done so yet. If we don’t break below 0.65000 early this week it is very likely we will see a rally into the top of the range.
Bearish Breakout - This is the setup we want to see play out this week as it presents a beauty of a trade.
For us to see AU as bearish on the 4hour we need to see a clear break below 0.65000 with a confirmed lower high below. If this happens look to target toward major support levels like 0.63500 area.
DXY 4Hour TF - July 20th, 2025DXY 7/20/2025
DXY 4hour Neutral Idea
Monthly - Bearish
Weekly - Bearish
Dailly - Bearish
4hour - Bullish
Higher timeframe trend analysis suggests that DXY is primarily bearish and is currently retracing to potential resistance.
Going into this week we are looking to see if our 98.000 zone will stay as support or transition into resistance. Here are two scenarios which highlight both a bullish and bearish outcome:
Bullish Continuation - Last week we saw a strong rally through our 98.000 zone which seems to still be holding. If this 4hour bullish trend is to continue we would like to see some sort of rejection off 98.000 support while also confirming a higher low. If this happens look to target higher toward major resistance levels like 99.250.
Bearish Reversal- If we are to consider DXY bearish again on the 4hour we would need to see a break below 98.000 support and confirm this level as new resistance.
There are a few major support levels to watch out for but DXY has the potential to fall dramatically if we see price get below 97.500.

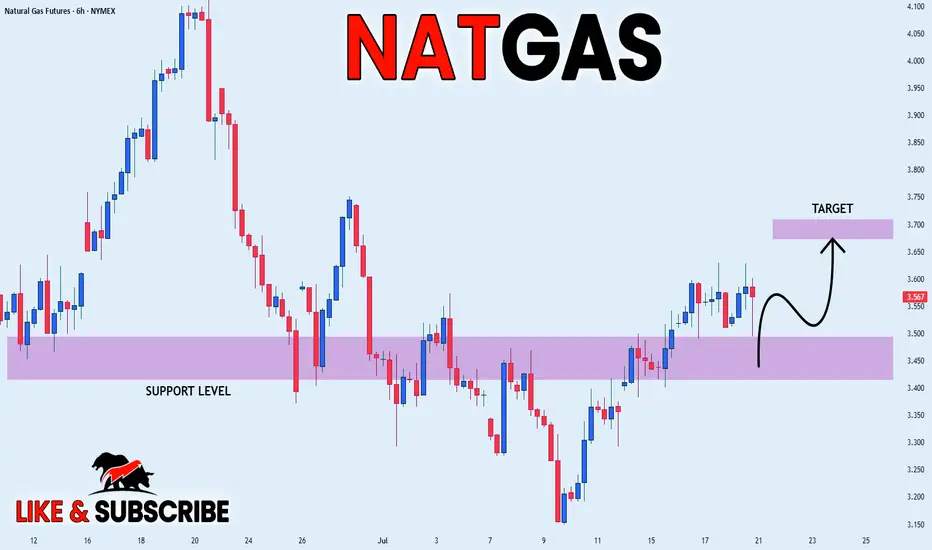
NATGAS REBOUND AHEAD|LONG|
✅NATGAS is going up now
And the price made a bullish
Rebound from the horizontal
Support level around 3.50$
So we are bullish biased and
We will be expecting a
Further bullish move up
LONG🚀
✅Like and subscribe to never miss a new idea!✅
Disclosure: I am part of Trade Nation's Influencer program and receive a monthly fee for using their TradingView charts in my analysis.
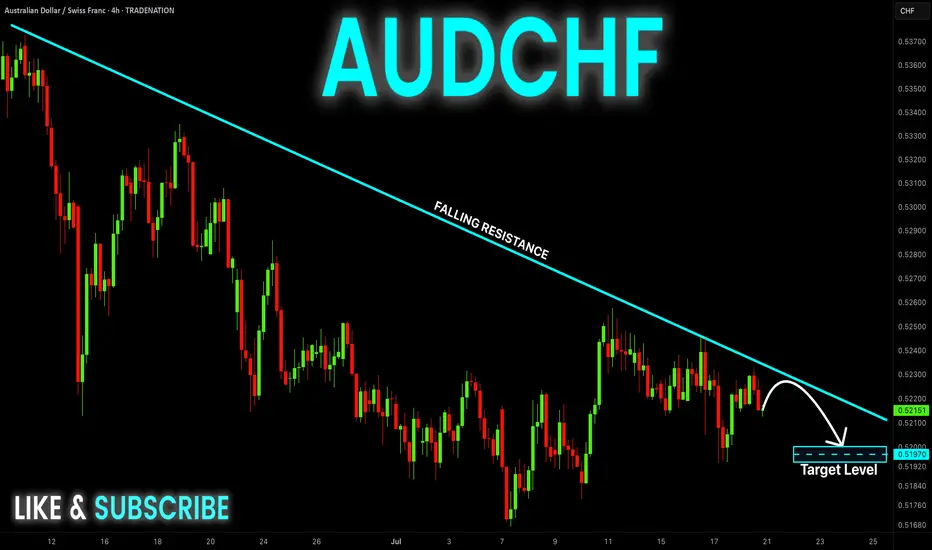
AUD-CHF Risky Short From Falling Resistance! Sell!
Hello,Traders!
AUD-CHF is trading in a
Downtrend along the falling
Resistance line so we are
Bearish biased and after
The potential retest of the
Falling resistance we will
Be expecting a further
Bearish move down
Sell!
Comment and subscribe to help us grow!
Check out other forecasts below too!
Disclosure: I am part of Trade Nation's Influencer program and receive a monthly fee for using their TradingView charts in my analysis.
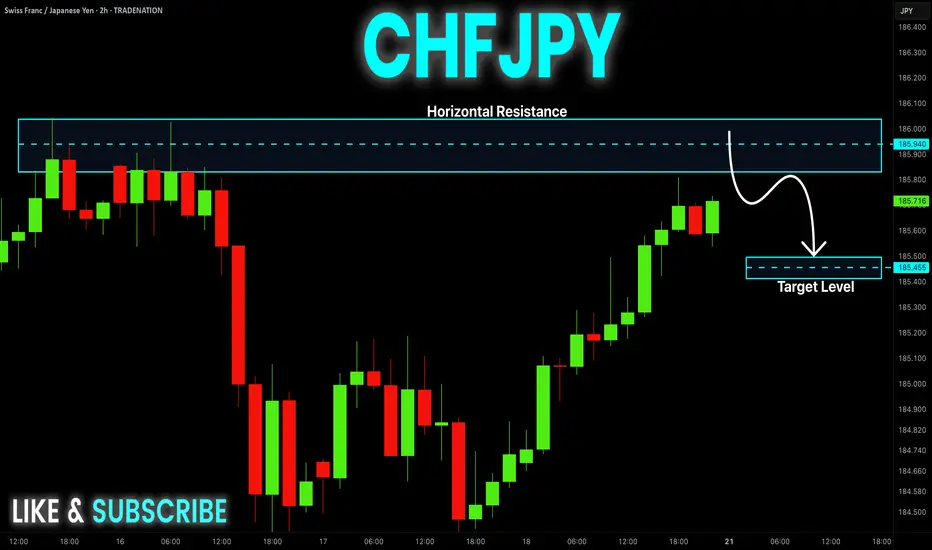
CHF-JPY Resistance Ahead! Sell!
Hello,Traders!
CHF-JPY keeps growing in
An uptrend and the pair is
Locally oversold so after the
Retest of the horizontal
Resistance of 186.000
From where we will be
Expecting a local bearish
Pullback on Monday
Sell!
Comment and subscribe to help us grow!
Check out other forecasts below too!
Disclosure: I am part of Trade Nation's Influencer program and receive a monthly fee for using their TradingView charts in my analysis.
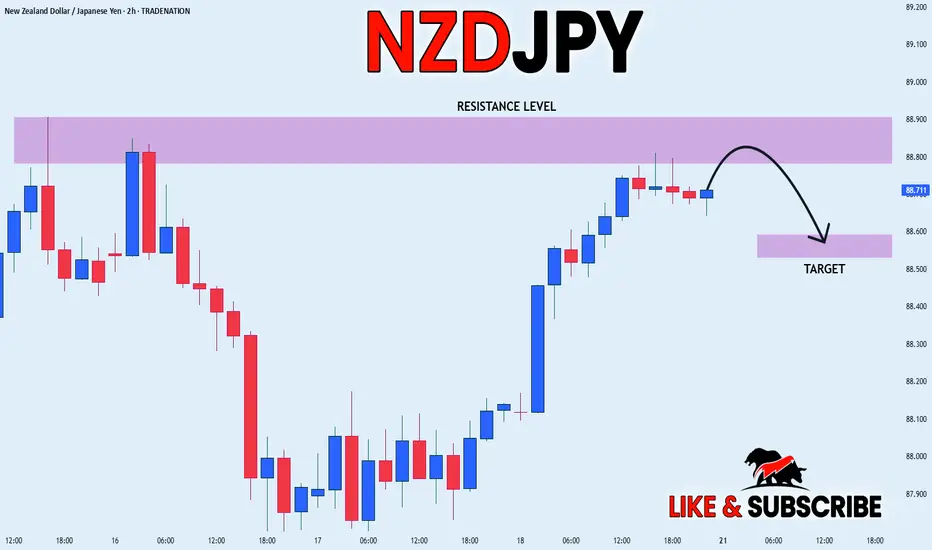
NZD_JPY PULLBACK EXPECTED|SHORT|
✅NZD_JPY has been growing recently
And the pair seems locally overbought
So as the pair has approached
A horizontal resistance of 88.900
Price fall is to be expected
SHORT🔥
✅Like and subscribe to never miss a new idea!✅
Disclosure: I am part of Trade Nation's Influencer program and receive a monthly fee for using their TradingView charts in my analysis.
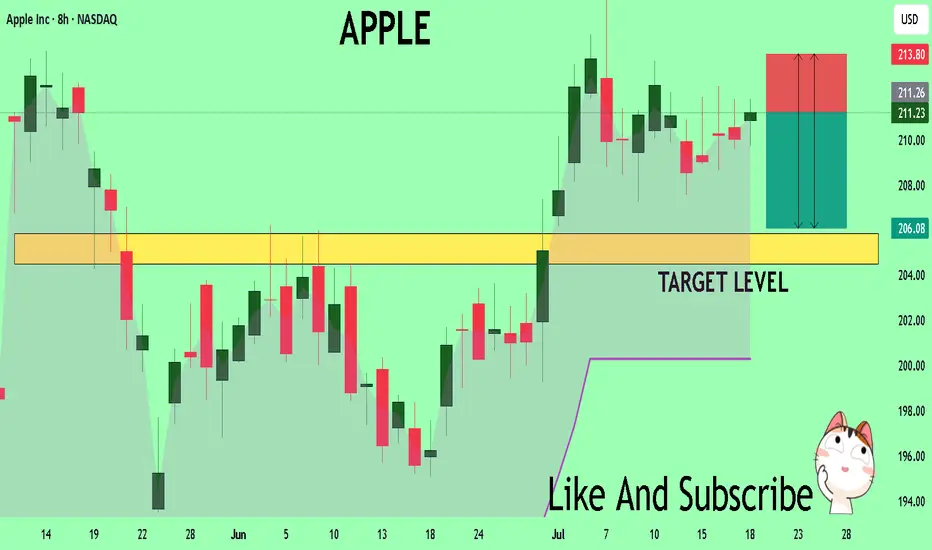
APPLE A Fall Expected! SELL!
My dear friends,
My technical analysis for APPLE is below:
The market is trading on 211.18 pivot level.
Bias - Bearish
Technical Indicators: Both Super Trend & Pivot HL indicate a highly probableBearish continuation.
Target - 205.87
Recommended Stop Loss - 213.80
About Used Indicators:
A pivot point is a technical analysis indicator, or calculations, used to determine the overall trend of the market over different time frames.
Disclosure: I am part of Trade Nation's Influencer program and receive a monthly fee for using their TradingView charts in my analysis.
———————————
WISH YOU ALL LUCK
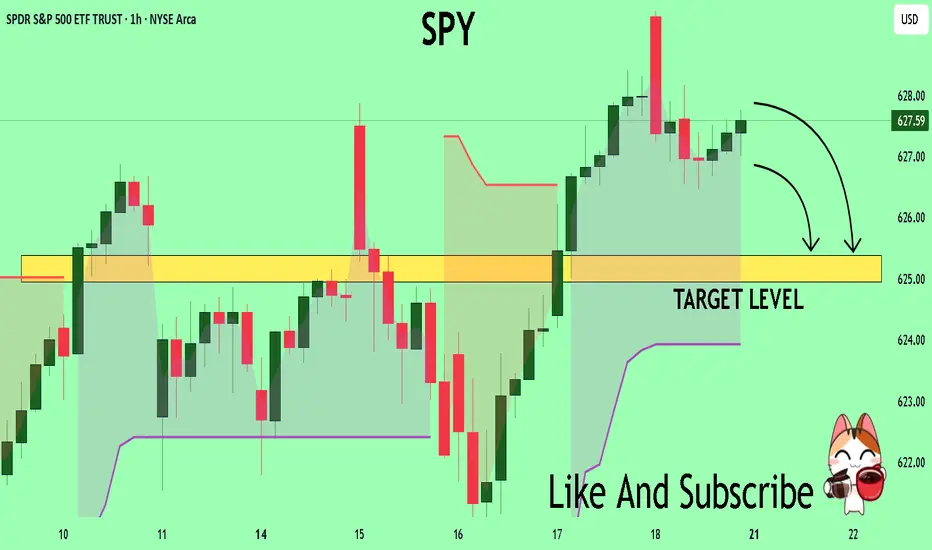
SPY What Next? SELL!
My dear friends,
Please, find my technical outlook for SPY below:
The instrument tests an important psychological level 627.59
Bias - Bearish
Technical Indicators: Supper Trend gives a precise Bearish signal, while Pivot Point HL predicts price changes and potential reversals in the market.
Target - 625.38
About Used Indicators:
Super-trend indicator is more useful in trending markets where there are clear uptrends and downtrends in price.
Disclosure: I am part of Trade Nation's Influencer program and receive a monthly fee for using their TradingView charts in my analysis.
———————————
WISH YOU ALL LUCK
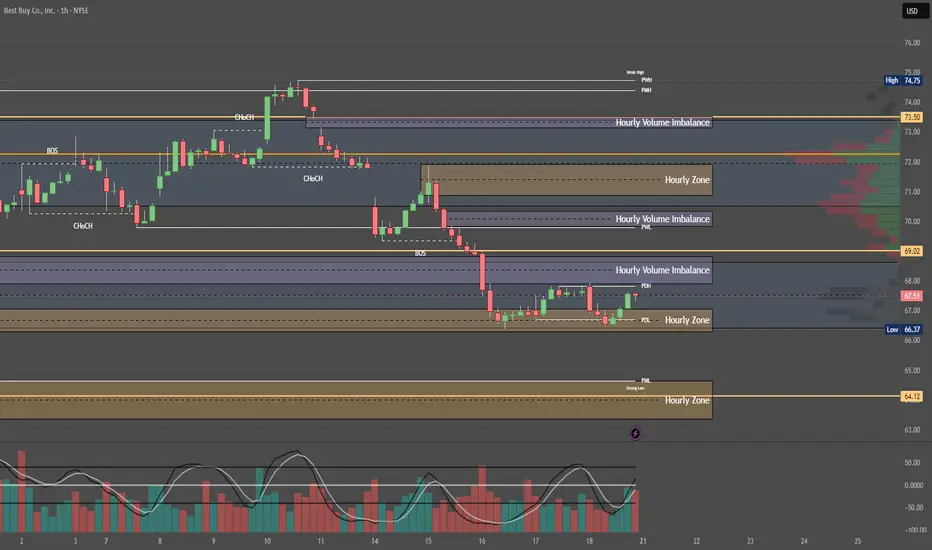
Quantum's BBY Outlook 7/20/25🚀 G.O.D. Flow (Gamma, Orderflow, Dealer Positioning)
1. 🧩 Summary Overview
Ticker: BBY
Current Price: $67.50
Flow Setup Date: Current Session
Trade Type: Intraday / 0–2 Day Swing
2. 🔬 Flow Breakdown
🔵 GEX (Gamma Exposure):
Highest -GEX at 70 → potential volatility pocket and resistance zone.
Despite matching +GEX at 70, net gamma is negative — bearish skew.
Additional +GEX at 72 & 73, but overwhelmed by -GEX at 68 and 67.
🔺 Overall gamma environment favors chop and downside unless 70 is reclaimed.
🟡 DEX (Delta Exposure):
Mirrors GEX layout.
Dealer short delta bias = likely selling into strength.
Reclaim of 70+ may signal a squeeze, but not favored without sweep confirmation.
🟣 Vanna:
Strong -Vanna clusters from 70 to 77: if IV rises, dealers sell into strength.
⚠️ This limits bullish continuation unless IV drops drastically.
Minor +Vanna at 60 = support base on deep dip (liquidity pocket if flushed hard).
🔴 Charm:
Extreme -Charm peak at 70 = time decay creates headwind at this level.
Additional -Charm pressure at 72, 73, and 77.
Minor +Charm at 60 suggests dealer support only comes much lower.
⚪ Volatility:
Neutral past week.
If vol spikes, expect dealer selling pressure to intensify under this skew.
🟢 Open Interest:
Heavy put OI at 70 = possible support IF price breaks hard.
Calls OI lighter at 72 and 73, meaning less resistance absorption if price does push up.
3. 📊 Chart Structure Setup
Price: $67.50, sitting below key gamma and charm cluster at 70.
Chart bias: Bearish unless strong reclaim of 70.
Key flush zones: 68 → 67 → 65
Confirmed supply above 70 due to clustered charm/vanna.
4. 🎯 Trade Plan
🟥 Bias: Bearish unless 70 is reclaimed and held with size.
🛠 Entry Triggers:
Rejection of 69.50–70 zone → PUT
Break and retest of 67 → PUT
📦 Contract Picks (0–5 DTE):
67p, 65p, 60p
🛑 Risk Stop:
Breakout and hold above 70.50 with size = exit or flip long bias intraday
🎯 Targets:
Target 1: 66.00 (Gamma flush)
Target 2: 63.00 (next +Charm liquidity zone)
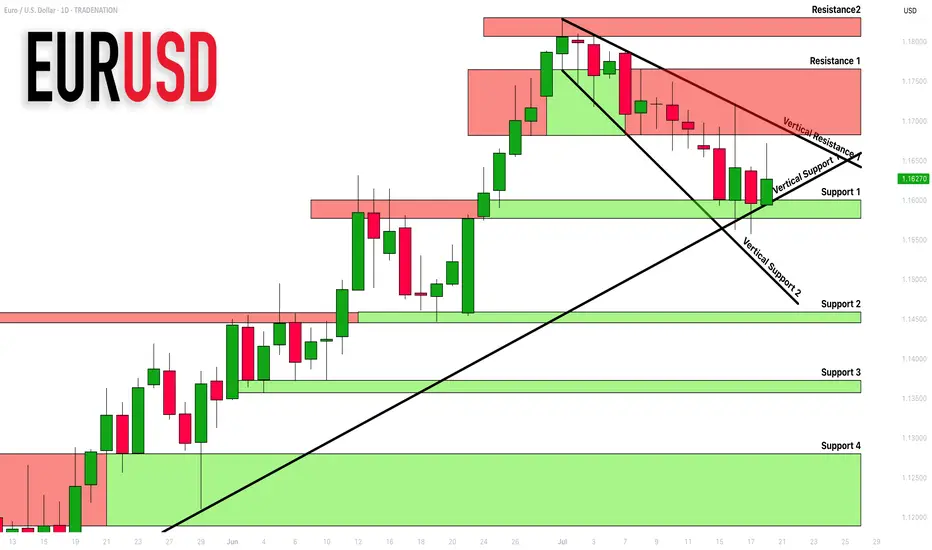
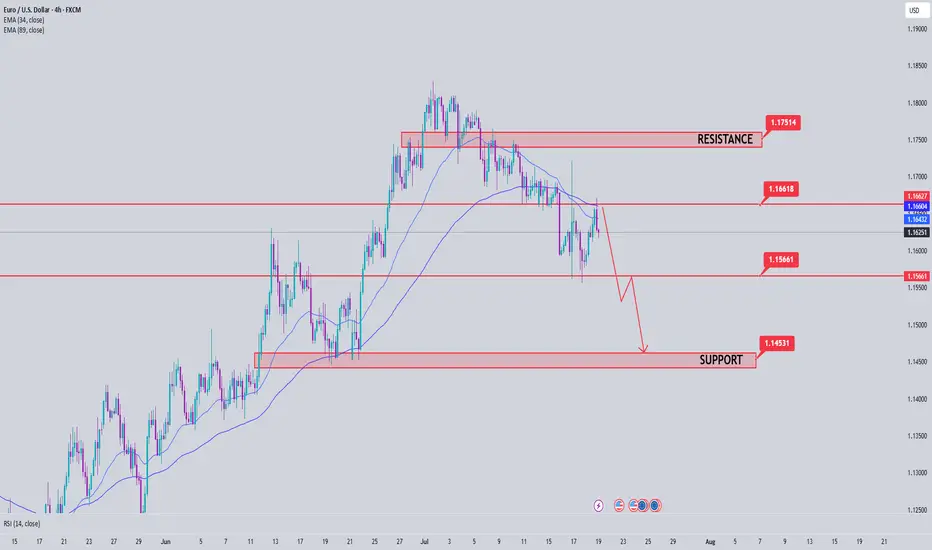
EURUSD: Support & Resistance Analysis For Next Week 🇪🇺🇺🇸
Here is my latest structure analysis and important supports/resistances
for EURUSD for next week.
Consider these structures for pullback/breakout trading.
❤️Please, support my work with like, thank you!❤️
I am part of Trade Nation's Influencer program and receive a monthly fee for using their TradingView charts in my analysis.
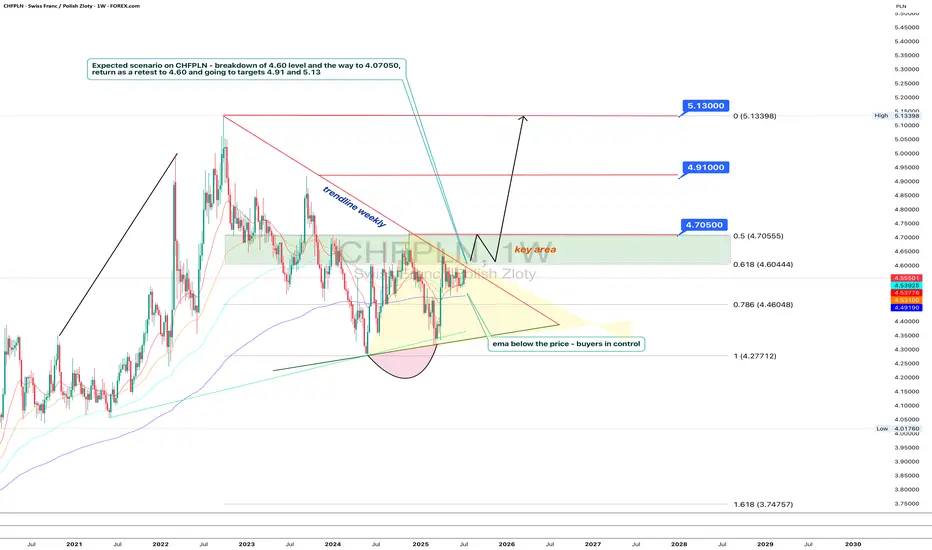
Polish zloty in trouble: Swiss franc is sharpening its teethTechnically, CHFPLN has completed a consolidation phase within a narrowing triangle and broke to the upside. The pair is now testing the 4.60 level (the 0.618 Fibonacci retracement) from below — a decisive zone. A breakout and confirmation above this area opens the path toward 4.705, which coincides with the 0.5 Fibo level and a local resistance. A pullback from that zone back to 4.60 is possible, but this time as a support retest. If the level holds, the targets remain: 4.91 and 5.13 - both marked by Fibonacci extensions and major long-term horizontal resistance. The EMAs are aligned in support of further upside, with price consistently trading above them.
Fundamentally, the Swiss franc remains a safe-haven currency, especially amidst increasing instability in the Eurozone. Weak growth in Germany, looming ECB policy easing, and rising inflationary pressures are all tilting investor interest toward CHF. Meanwhile, Poland faces political uncertainty, budgetary debates, and volatility in the agricultural and energy sectors. All of this strengthens the case for the franc in this pair.
Tactically, the game plan is straightforward: a confirmed breakout above 4.60 signals the start of a bullish impulse. The 4.60–4.705 zone is the key area of interest for buyers. If this zone is reclaimed and held, the next targets - 4.91 and 5.13 - remain valid, where large players may look to take profits.
If this scenario plays out, the zloty may soon be tuning into Polish radio to sing nostalgic songs about the golden days of its strength.
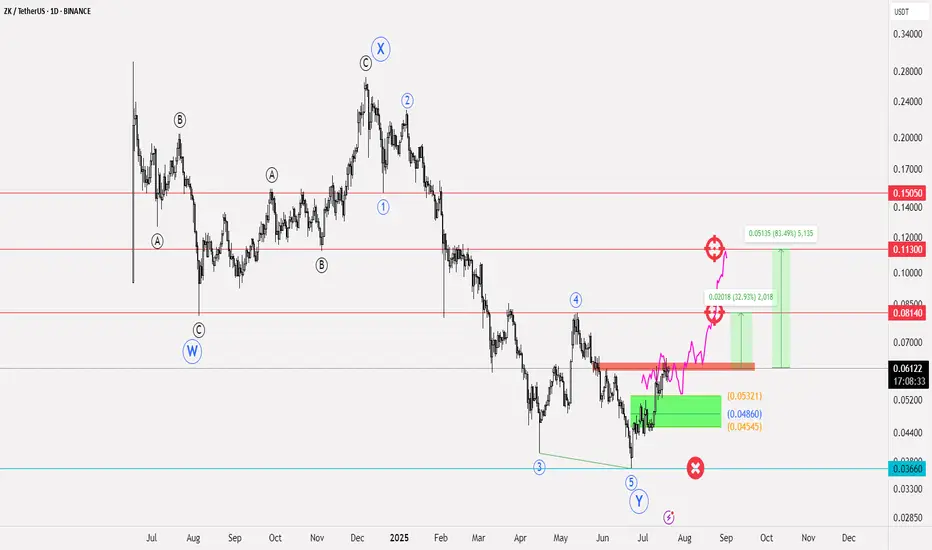
ZKUSDT Elliott Waves analysis📝 Currency NYSE:ZK
✅ Entry points for the currency: at the current price of 0.06135, the reinforcement should be within the range of 0.05321 - 0.04860
🔴 Stop loss is below 0.03660
💹 Potential targets: first target 0.08140 and if the currency enters a bullish wave, the target will be towards 0.1130, reaching up to 0.150
📊 The profit-to-loss ratio is 5:1
📝 This idea is based on Elliott Waves analysis, especially since the beginning of the currency's listing, where a WXY pattern formed, and this pattern was confirmed after the upward rebound from 0.03660, which we considered as our stop loss. The liquidity range is the range we defined for reinforcement; its stability will give momentum and strength to the currency to complete an upward path, at least achieving a trend towards the peak of wave 4
❤️ Good luck to everyone - do not enter any currency before studying the risk ratio you will undertake
EURUSD Analysis week 30🌐Fundamental Analysis
The USD rose after June retail sales beat expectations and initial jobless claims fell to 221,000. However, the USD's gains were limited as US stocks rebounded late in the session.
On Friday morning, US stock index futures rose 0.2%, indicating that risk sentiment remains dominant. If this trend continues, EUR/USD could hold support.
The next focus is on the Consumer Sentiment and Inflation Expectations Index data from the University of Michigan. If the data is positive, the USD could regain support and put pressure on EUR/USD.
🕯Technical Analysis
EURUSD is in a corrective downtrend towards the 1.145 support. If this support zone is broken, the EURUSD trend will turn to a Downtrend. Currently, the main trading strategy will be to look for SELL points. After price reacted at EMA and trendline and headed to temporary bottom 1.156 and hit important support soon.
📈📉Trading Signals
SELL EURUSD 1.17500-1.17700 Stoploss 1.18000
BUY EURUSD 1.14500-1.14300 Stoploss 1.14000
EURCHF Is Going Up! Buy!
Here is our detailed technical review for EURCHF.
Time Frame: 9h
Current Trend: Bullish
Sentiment: Oversold (based on 7-period RSI)
Forecast: Bullish
The market is testing a major horizontal structure 0.931.
Taking into consideration the structure & trend analysis, I believe that the market will reach 0.936 level soon.
P.S
Overbought describes a period of time where there has been a significant and consistent upward move in price over a period of time without much pullback.
Disclosure: I am part of Trade Nation's Influencer program and receive a monthly fee for using their TradingView charts in my analysis.
Like and subscribe and comment my ideas if you enjoy them!

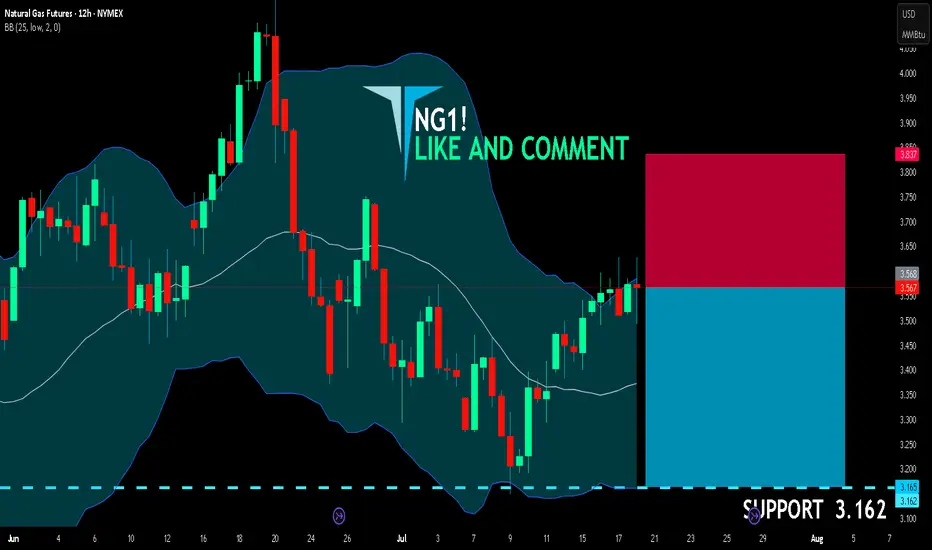
NG1! BEARS ARE STRONG HERE|SHORT
NG1! SIGNAL
Trade Direction: short
Entry Level: 3.568
Target Level: 3.162
Stop Loss: 3.837
RISK PROFILE
Risk level: medium
Suggested risk: 1%
Timeframe: 12h
Disclosure: I am part of Trade Nation's Influencer program and receive a monthly fee for using their TradingView charts in my analysis.
✅LIKE AND COMMENT MY IDEAS✅
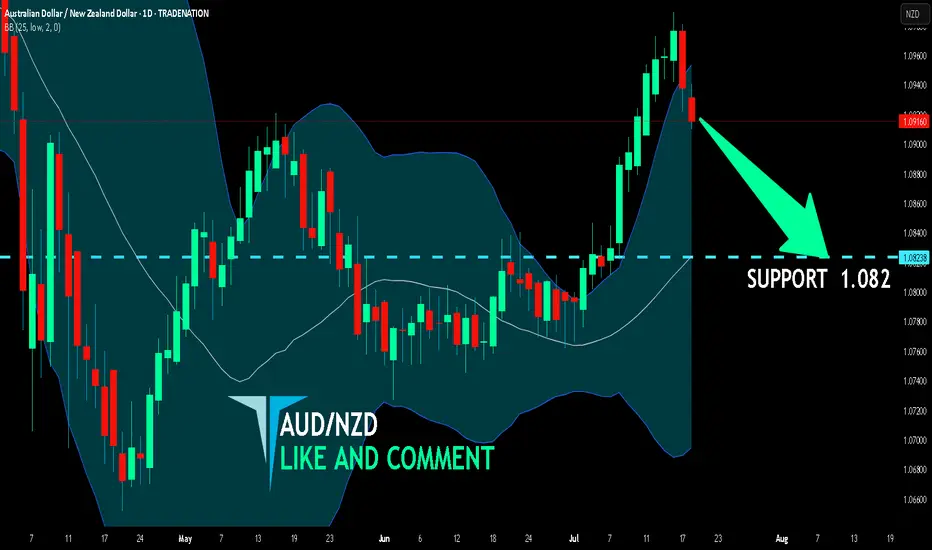
AUD/NZD SHORT FROM RESISTANCE
Hello, Friends!
The BB upper band is nearby so AUD/NZD is in the overbought territory. Thus, despite the uptrend on the 1W timeframe I think that we will see a bearish reaction from the resistance line above and a move down towards the target at around 1.082.
Disclosure: I am part of Trade Nation's Influencer program and receive a monthly fee for using their TradingView charts in my analysis.
✅LIKE AND COMMENT MY IDEAS✅
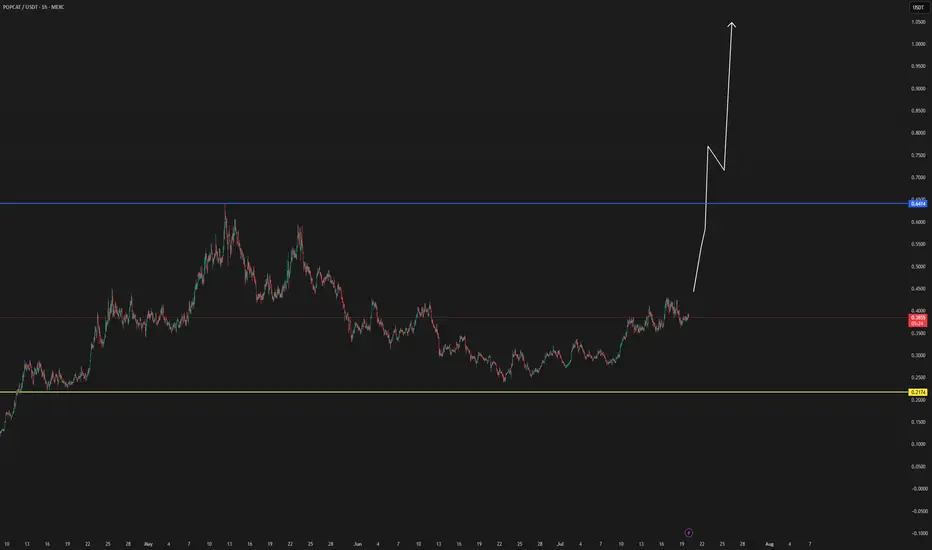
WILL POPCAT HAVE A NEW WHALE VOLUME?POPCAT seems interesting then never before, even with the last correction, are we going to see a new increase round by POPCAT? The time will show, the interest is here.
If this coin is able to make new confirmations, the updates will be below.