Quantum's BA Weekly Outlook 7/19/25🚀 G.O.D. Flow Certified Trade Blueprint – Boeing (BA)
1. 🧩 Summary Overview
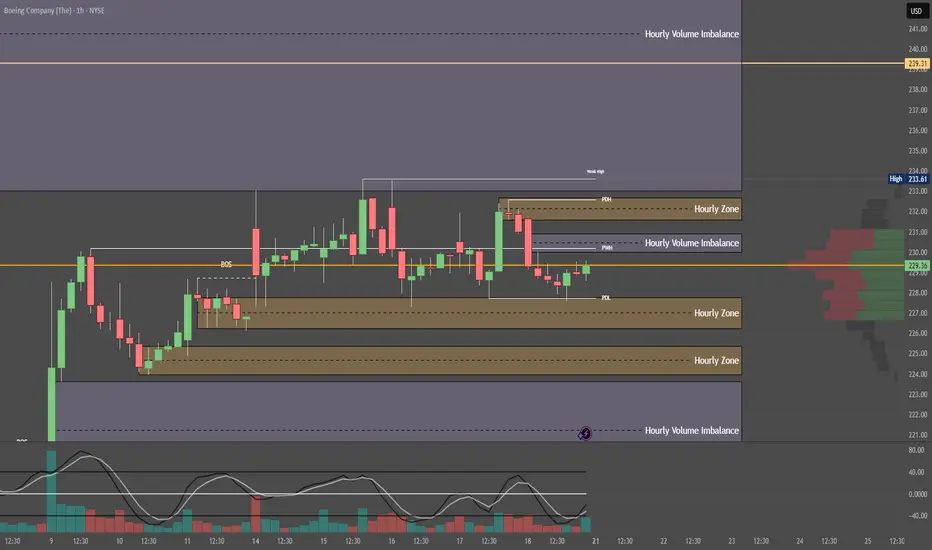
Ticker: BA
Current Price: $229.34
Trade Type: Day Trade / 0–2 Day Swing
System: G.O.D. Flow (Gamma, Orderflow, Dealer Positioning)
2. 🔬 Flow Breakdown
🔵 GEX (Gamma Exposure):
Highest negative GEX at $230 = possible resistance or sticky zone.
However, +GEX2 at $235 and +GEX3 at $240 outweigh $230 → suggests dealer hedging will push price upward through gamma bands.
🟡 DEX (Delta Exposure):
+DEX peaks at $230 then fades toward $240 and reappears at $250 → bullish flow decay confirms momentum needs volume through $235–240 to continue upward push.
🟣 Vanna:
Flip zone at $232.50 → if IV rises and price pushes upward, dealers must buy, adding tailwind.
Major positive clusters at $240 & $250 = major squeeze potential if IV increases intraday.
🔴 Charm:
Flip zone at $227.50 = above this level, morning decay benefits bulls.
Negative charm at $240 & $250 = expect afternoon fade into these zones — ideal trim targets.
⚪ Volatility:
Volatility decreasing weekly = less explosive risk, more structured/predictable flow.
Dealers will likely have cleaner hedging paths without IV shocks.
🟢 Open Interest:
Stacked calls at $230, $235, $240, $250.
Aligns with GEX/Vanna targets → confirms upside skew.
3. 🧭 Chart Structure Setup
Daily: Consolidation breakout attempt.
Hourly: Bounce off support with bullish stochastics crossover.
10M OR: Mark OR High/Low — use reclaim of OR High + VWAP as entry signal.
Resistance: $235–240 (flow + OI + chart confluence) = ideal trim zone.
4. 🎯 Trade Plan
Bias: Bullish
Trigger Entry: Break and reclaim of $232.50 (Vanna Flip)
Contract Suggestion:
235c or 240c, 0–2 DTE (Friday expiry if early week)
Stop-Loss:
VWAP loss or break below $230
Target Zones:
🎯 T1: $235 (GEX2 + OI cluster)
🎯 T2: $240 (GEX3 + Vanna/Charm confluence)
5. 🔁 Intraday Adjustment Triggers
If This Happens: Then Do This:
GEX flips positive above $232.50 Strengthen conviction
Vanna clusters weaken + IV drops Trim / De-risk
Charm flips heavily negative by 12pm Expect fade into highs
Large sweeps hit 235c/240c strikes Ride momentum with size confidence
Trading
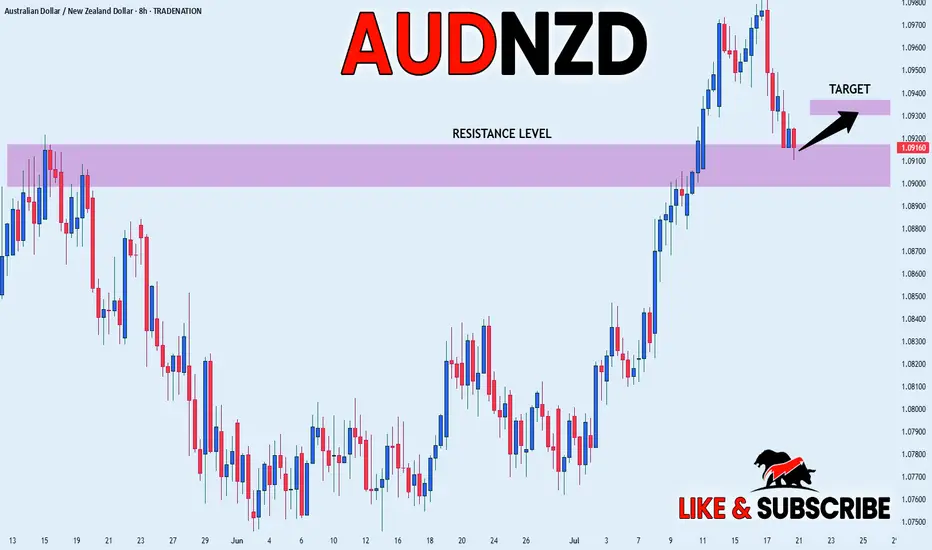
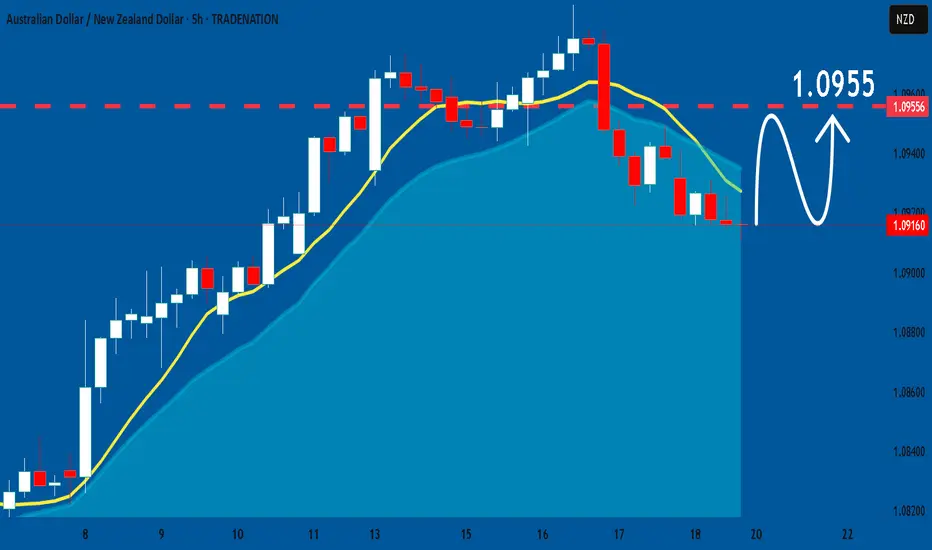
AUD_NZD GROWTH AHEAD|LONG|
✅AUD_NZD fell down sharply
But a strong support level was hit at 1.0910
Thus I am expecting a rebound
And a move up towards the target of 1.0930
LONG🚀
✅Like and subscribe to never miss a new idea!✅
Disclosure: I am part of Trade Nation's Influencer program and receive a monthly fee for using their TradingView charts in my analysis.
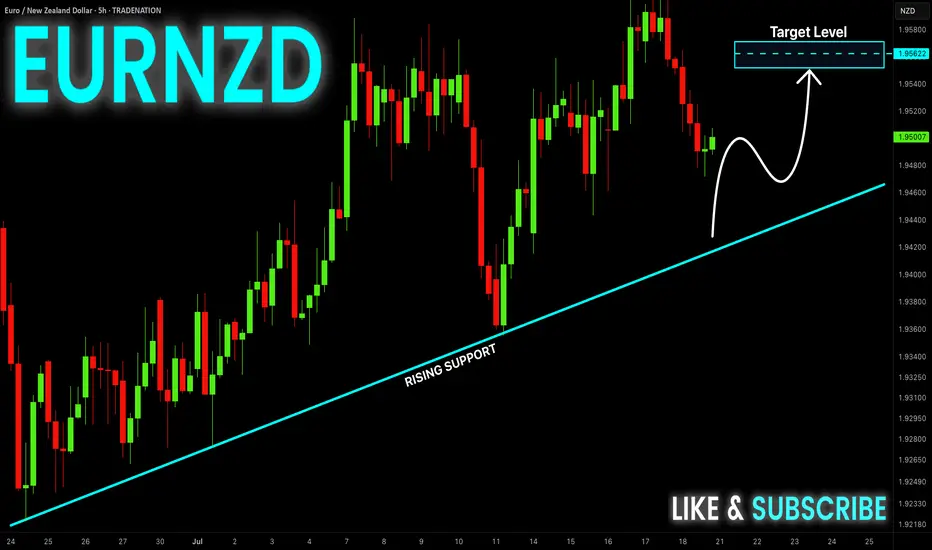
EUR-NZD Will Grow! Buy!
Hello,Traders!
EUR-NZD is making a local
Bearish correction while trading
In an uptrend along he rising
Support so after the pair hits
The support line a local bullish
Rebound is to be expected
Buy!
Comment and subscribe to help us grow!
Check out other forecasts below too!
Disclosure: I am part of Trade Nation's Influencer program and receive a monthly fee for using their TradingView charts in my analysis.
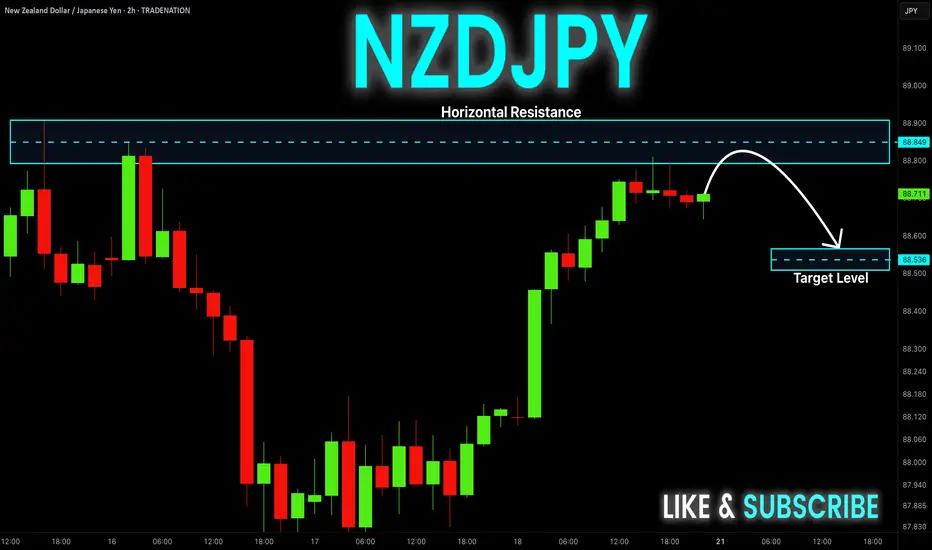
NZD-JPY Local Short! Sell!
Hello,Traders!
NZD-JPY has hit a horizontal
Resistance level of 88.851
And we are already seeing
A bearish reaction so we will
Be expecting a local
Bearish move down
On Monday!
Sell!
Comment and subscribe to help us grow!
Check out other forecasts below too!
Disclosure: I am part of Trade Nation's Influencer program and receive a monthly fee for using their TradingView charts in my analysis.
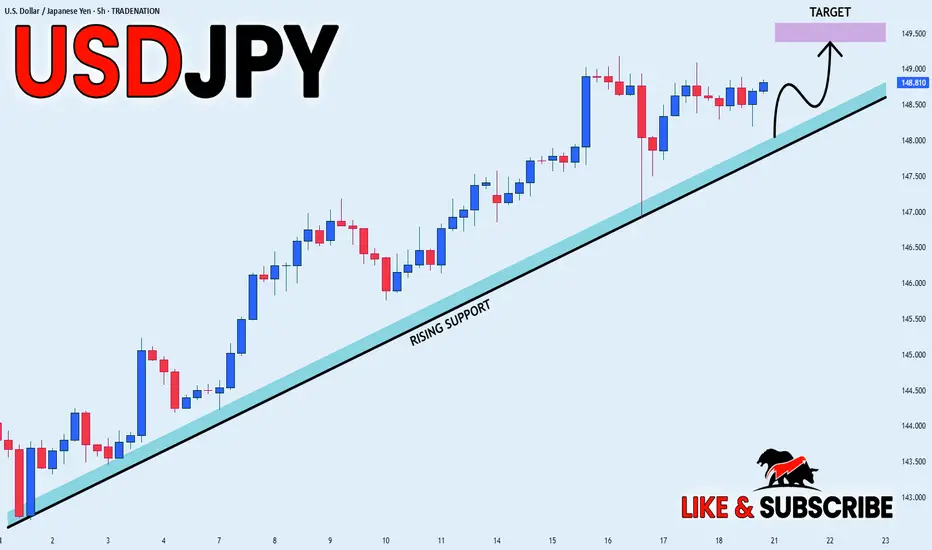
USD_JPY STRONG UPTREND|LONG|
✅USD_JPY is in a strong
Long-term uptrend now
And the pair is accumulating
For the next leg up so we will
Be expecting a bullish continuation
On Monday!
LONG🚀
✅Like and subscribe to never miss a new idea!✅
Disclosure: I am part of Trade Nation's Influencer program and receive a monthly fee for using their TradingView charts in my analysis.
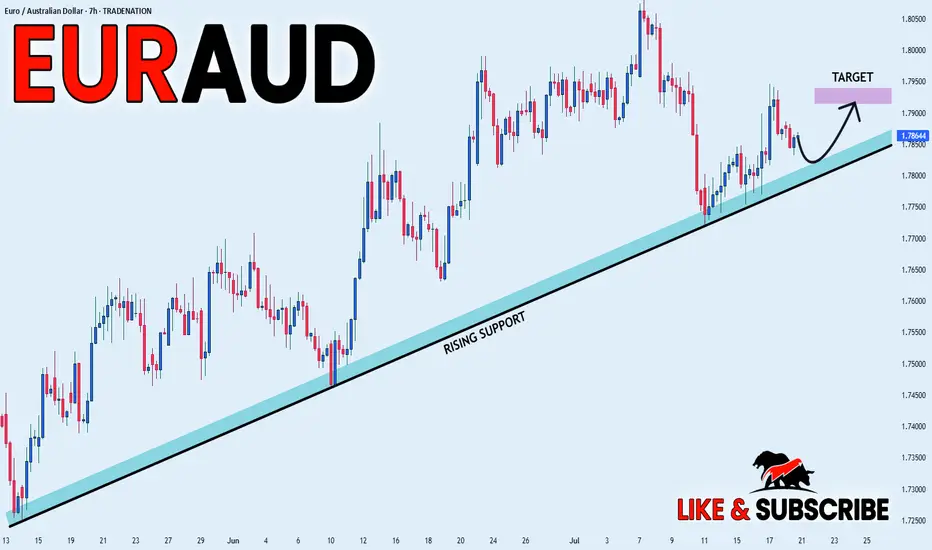
EUR_AUD WILL GROW|LONG|
✅EUR_AUD is trading in an uptrend
With the pair set to retest
The rising support line
From where I think the growth will continue
LONG🚀
✅Like and subscribe to never miss a new idea!✅
Disclosure: I am part of Trade Nation's Influencer program and receive a monthly fee for using their TradingView charts in my analysis.
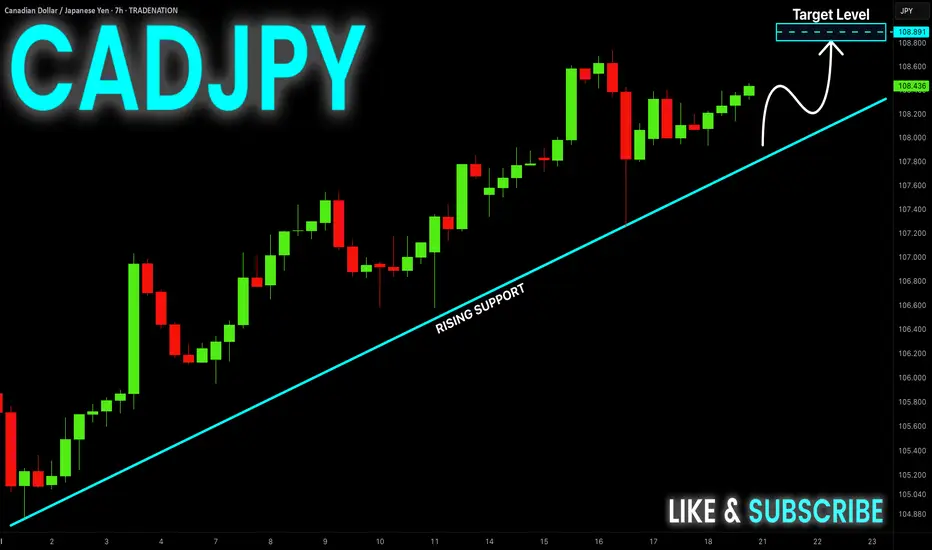
CAD-JPY Will Keep Growing! Buy!
Hello,Traders!
CAD-JPY keeps trading in
An uptrend and there is a
Rising support below so
We are bullish biased
And we will be expecting
A further bullish move up
Buy!
Comment and subscribe to help us grow!
Check out other forecasts below too!
Disclosure: I am part of Trade Nation's Influencer program and receive a monthly fee for using their TradingView charts in my analysis.
Gold breaks trendline and returns to uptrend. BUY NOW!✏️ OANDA:XAUUSD A deep sweep to 3310 and bounce back to the trading range. Gold is reacting at the Trendline around the price zone of 3344. This is an important price zone that if broken will return to the uptrend and head towards 3373 soon. 3332 plays an important role in the current bullish wave structure, which is a suitable SL placement point for BUY signals.
📉 Key Levels
Support: 3332-3312
Resistance: 3344-3357-3373-3389
BUY trigger: Break and trading above Resistance 3344 (trendline, top uptrend wave 1)
BUY DCA trigger: Break Resistance 3353
Target 3373
Leave your comments on the idea. I am happy to read your views.

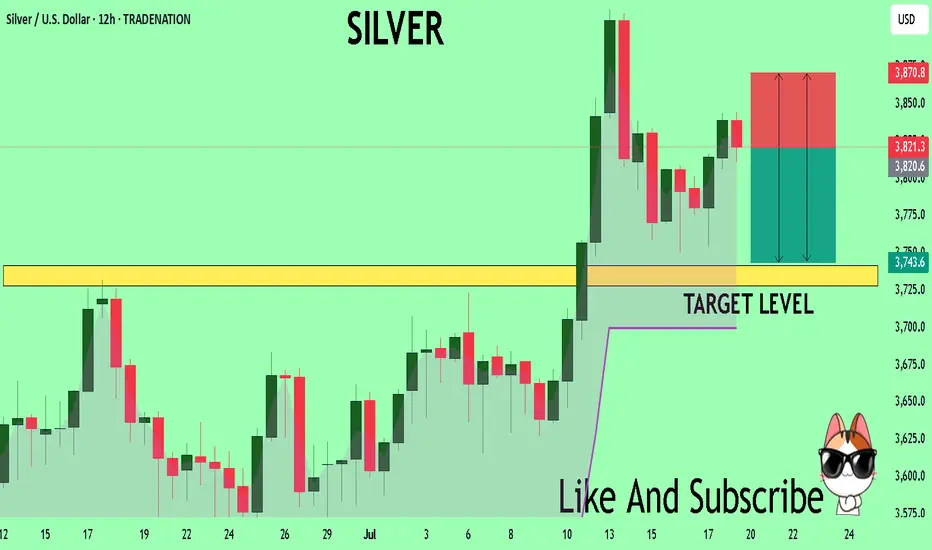
SILVER Massive Short! SELL!
My dear subscribers,
SILVER looks like it will make a good move, and here are the details:
The market is trading on 38.213 pivot level.
Bias - Bearish
My Stop Loss - 38.708
Technical Indicators: Both Super Trend & Pivot HL indicate a highly probable Bearish continuation.
Target - 37.413
About Used Indicators:
The average true range (ATR) plays an important role in 'Supertrend' as the indicator uses ATR to calculate its value. The ATR indicator signals the degree of price volatility.
Disclosure: I am part of Trade Nation's Influencer program and receive a monthly fee for using their TradingView charts in my analysis.
———————————
WISH YOU ALL LUCK
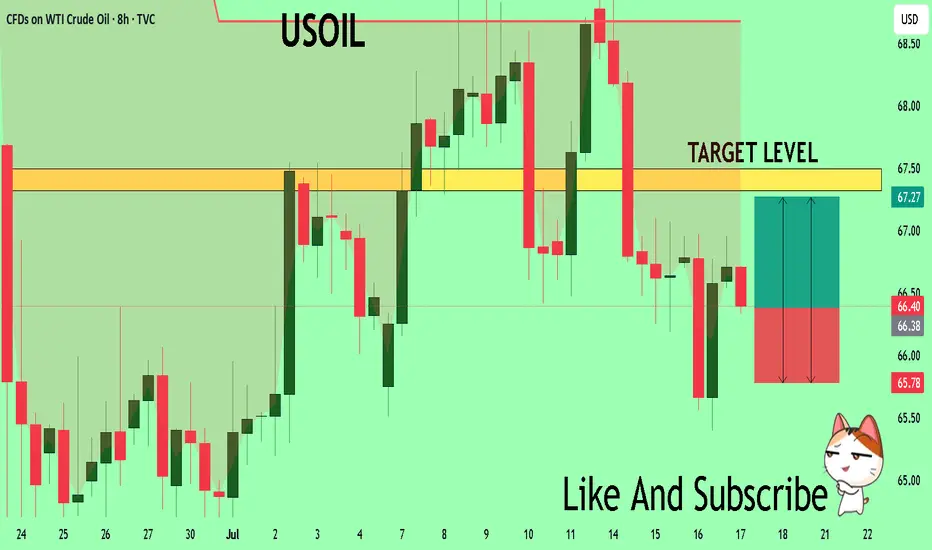
USOIL Technical Analysis! BUY!
My dear followers,
This is my opinion on the USOIL next move:
The asset is approaching an important pivot point 66.40
Bias - Bullish
Safe Stop Loss - 65.78
Technical Indicators: Supper Trend generates a clear long signal while Pivot Point HL is currently determining the overall Bullish trend of the market.
Goal - 67.32
About Used Indicators:
For more efficient signals, super-trend is used in combination with other indicators like Pivot Points.
Disclosure: I am part of Trade Nation's Influencer program and receive a monthly fee for using their TradingView charts in my analysis.
———————————
WISH YOU ALL LUCK
AUDNZD: Growth & Bullish Forecast
The analysis of the AUDNZD chart clearly shows us that the pair is finally about to go up due to the rising pressure from the buyers.
Disclosure: I am part of Trade Nation's Influencer program and receive a monthly fee for using their TradingView charts in my analysis.
❤️ Please, support our work with like & comment! ❤️
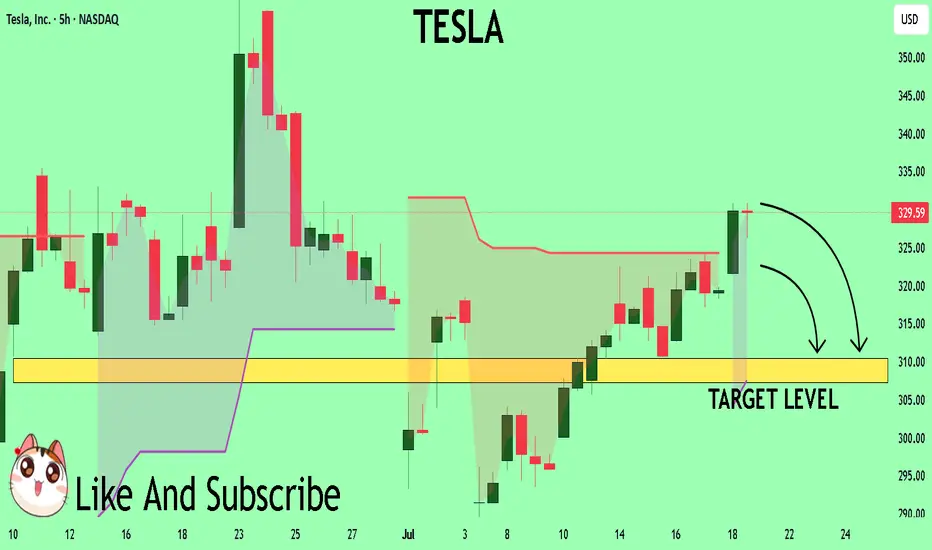
TESLA My Opinion! SELL!
My dear subscribers,
My technical analysis for TESLA is below:
The price is coiling around a solid key level -329.59
Bias - Bearish
Technical Indicators: Pivot Points High anticipates a potential price reversal.
Super trend shows a clear sell, giving a perfect indicators' convergence.
Goal - 310.44
About Used Indicators:
By the very nature of the supertrend indicator, it offers firm support and resistance levels for traders to enter and exit trades. Additionally, it also provides signals for setting stop losses
Disclosure: I am part of Trade Nation's Influencer program and receive a monthly fee for using their TradingView charts in my analysis.
———————————
WISH YOU ALL LUCK
GOLD OUTLOOK – READY FOR THE NEW TRADING WEEK (JULY 21–25)GOLD OUTLOOK – READY FOR THE NEW TRADING WEEK (JULY 21–25)
🟡 Market Recap:
Gold made a strong bullish reversal at the end of last week, following a liquidity sweep at the FVG ZONE 3310. Price surged quickly toward the OBS SELL ZONE around 335x–336x.
However, by Friday’s close, price reacted to multiple confluences (OBS + FIBO zones) and closed below the VPOC level in the recent uptrend – forming a potential short-term top.
📉 Outlook for July 21–25:
No major economic data expected next week.
However, geopolitical tensions and trade policy concerns (e.g. tariffs, military conflicts) will be the key catalysts.
These events could lead to high volatility and liquidity grabs across the board.
🧠 Technical Perspective – H1 Mid-Term View:
Gold continues to form multiple unfilled Fair Value Gaps (FVGs) after strong bullish moves.
Recent price action created new high-zone FVGs, but lower FVGs remain untested.
🔁 Expected scenario: A potential retracement to fill the lower FVG zones (3310/3305), followed by another bullish leg.
📍Trading Strategy:
Wait for price to retrace into FVG Low Zones.
Look for early BUY setups at confluence areas:
CP zones
FIBO retracement levels
Volume/Price reaction zones
🎯 Target Outlook:
Bullish targets around 333x – 336x remain valid.
If price sustains momentum after pullback, we may aim for Buy Side Liquidity near 3371.749.
✅ Key Reminders:
Avoid chasing highs (FOMO).
Stick to proper TP/SL rules, especially with headline-driven markets next week.
🎉 Wishing you a relaxing weekend – recharge and get ready to conquer the markets next week!
🚀 GOD BLESS ALL

#013: Long Investment Opportunity on GBP/USD
In this article, I want to share the complete trading logic that led me to place a long order on GBP/USD, applying my proprietary SwipeUP v9.3.1 Elite FX model.
I won't discuss specific levels, but only the logical structure, because the goal is to demonstrate how hedge funds think and why waiting is sometimes more profitable than impulsive entry.
🔍 Phase 1 – Manipulation has already occurred
GBP/USD recently formed a technical double bottom, with a long shadow that chased away the stops placed by the most reactive retail investors. This is a clear signal: the first phase of manipulation is complete.
You don't enter immediately after a shadow: you wait for the market to return to seek residual liquidity, simulating a new decline.
📉 Phase 2 – The expected institutional dump
Before the real movement begins, I expect the price to be pushed lower again. This push serves only to:
trigger the stops of longs who entered too early
raise new liquidity for the banks
test the presence of passive institutional orders near volume supports
This dump will likely be the last countermove before the final reversal.
That's exactly where I placed my order.

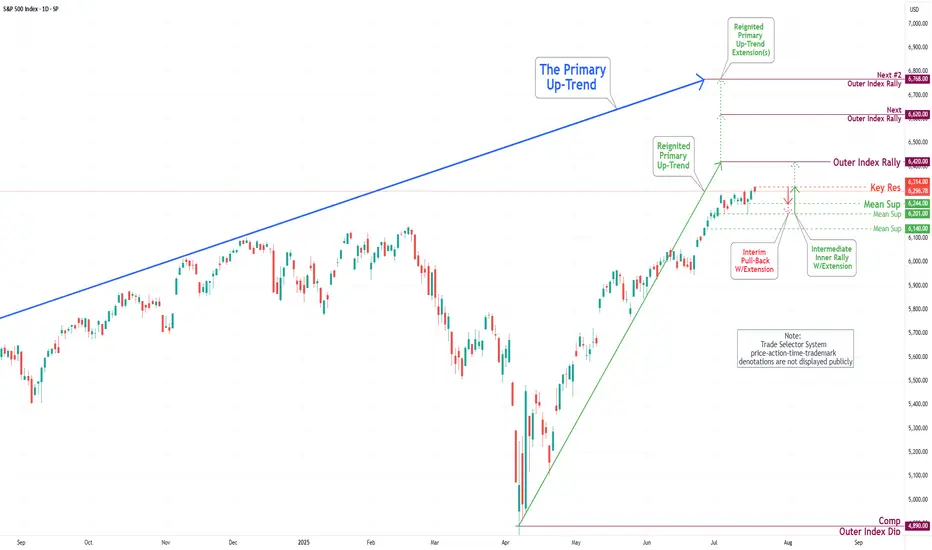
S&P 500 Daily Chart Analysis For Week of July 18, 2025Technical Analysis and Outlook:
During the current trading week, the S&P 500 Index has demonstrated a predominantly upward trajectory. It has successfully retested the Mean Support level at 6200 and established a new Key Resistance level at 6314. Currently, the index displays a bullish sentiment, with the objective for the Outer Index Rally set at 6420.
Nevertheless, it is essential to recognize that the current price action may result in a decline, potentially leading to a retest of the Mean Support at 6244 and extending to the Mean Support at 6201. Following this potential downward movement, it is anticipated that the index will resume its upward trend, driving the price action towards the Key Resistance level at 6314 and ultimately achieving the Outer Index Rally target of 6420.
EUR/USD Daily Chart Analysis For Week of July 18, 2025Technical Analysis and Outlook:
In the current trading session, the Euro has continued its decline, completing our Mean Support level of 1.160. Recent analyses indicate that the Euro is likely to experience a sustained downward trend, with an anticipated retest at the Mean Support level of 1.159 and a possible further decline to reach a Currency Dip of 1.152. Nevertheless, it is crucial to consider the potential for a dead-cat bounce toward the Mean Resistance level of 1.167, which could trigger a significant reversal of the downtrend and target a Currency Dip of 1.152.

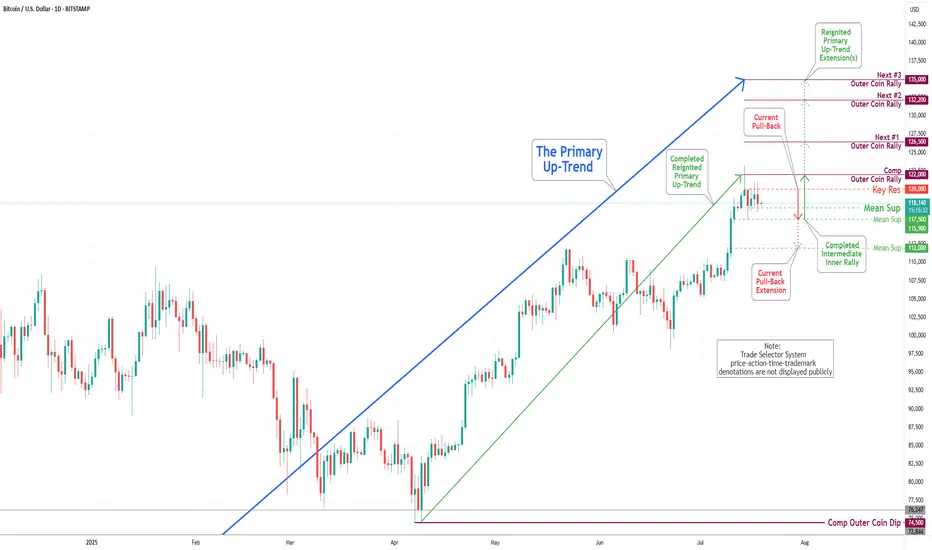
Bitcoin(BTC/USD) Daily Chart Analysis For Week of July 18, 2025Technical Analysis and Outlook:
In last week's trading session, we achieved a new historical high by completing our Outer Coin Rally at 122000. Following this milestone, the coin retraced, as expected, to the newly established Mean Support at 115900 and is currently trading at the Intermediate Mean Support at 117500. Presently, the coin is set to retest the Mean Support at 115900, with the potential for a further pullback to the Mean Support at 112000. This anticipated decline will necessitate a retest for the completed Outer Coin Rally at 122000. The designated targets for the renewed Primary Up-Trend are 126500, 132200, and 135000.
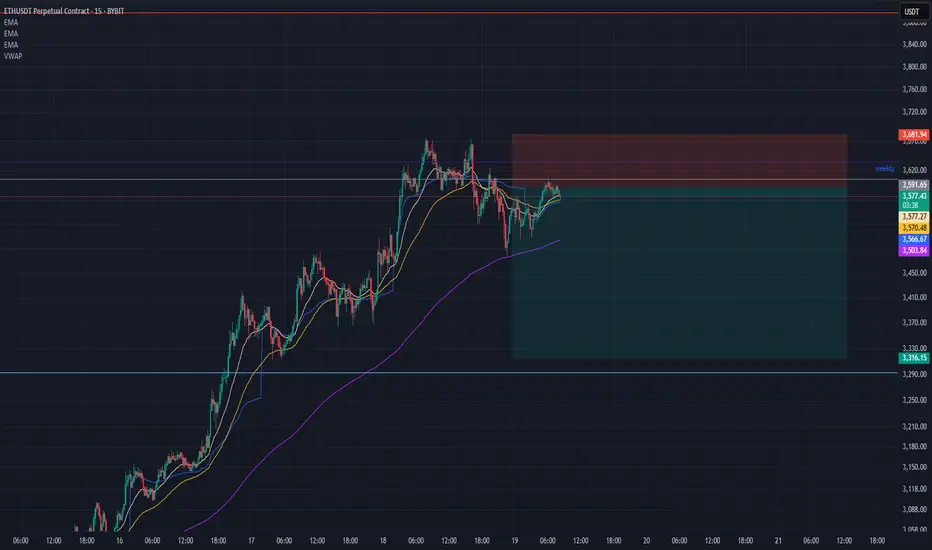
ETH SCALP SHORT RR 3:1 Ethereum just hit weekly level with two 15min lower high and lower low. Rules are telling us to not short against trend, but there can be hedge for long positions.
I don't ask to trade more then 0.5 % capital per trade.
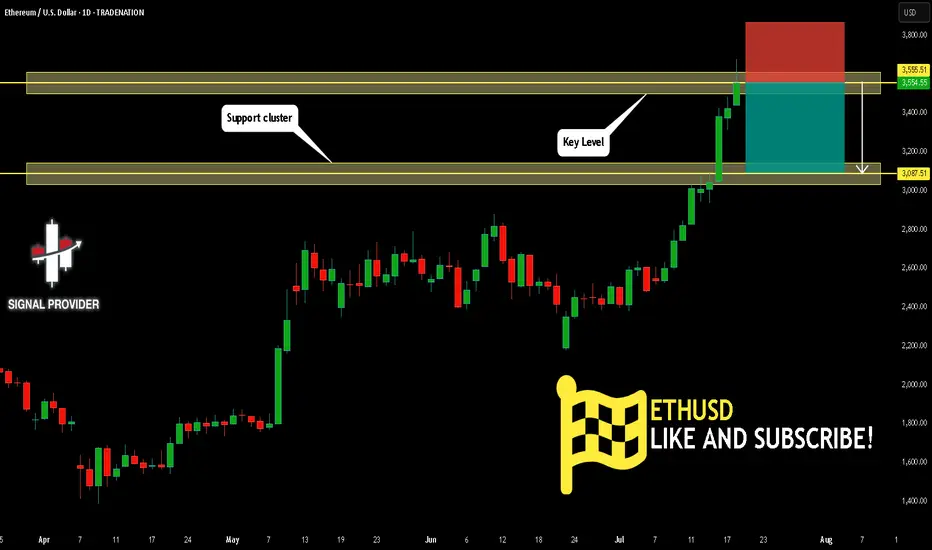
ETHUSD Will Fall! Short!
Take a look at our analysis for ETHUSD.
Time Frame: 1D
Current Trend: Bearish
Sentiment: Overbought (based on 7-period RSI)
Forecast: Bearish
The market is approaching a key horizontal level 3,555.51.
Considering the today's price action, probabilities will be high to see a movement to 3,087.51.
P.S
Please, note that an oversold/overbought condition can last for a long time, and therefore being oversold/overbought doesn't mean a price rally will come soon, or at all.
Disclosure: I am part of Trade Nation's Influencer program and receive a monthly fee for using their TradingView charts in my analysis.
Like and subscribe and comment my ideas if you enjoy them!
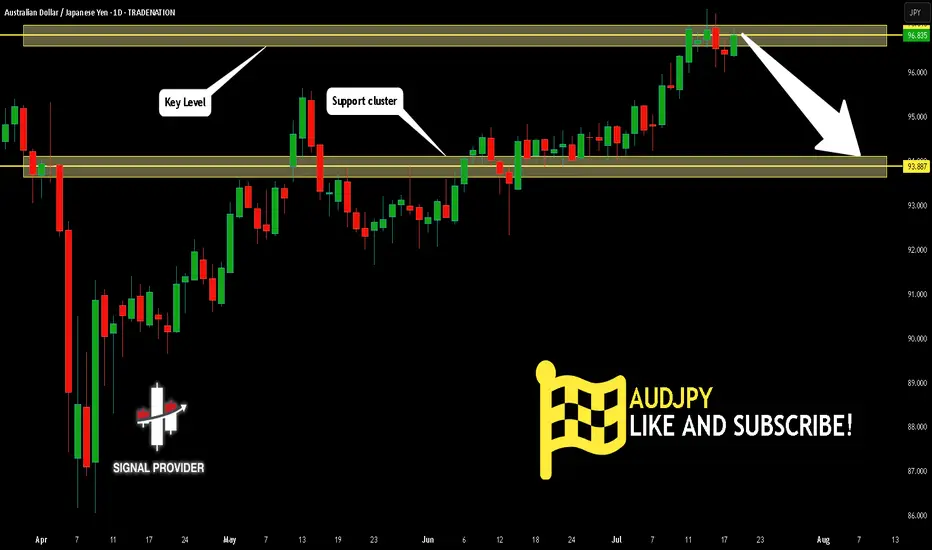
AUDJPY Will Go Lower From Resistance! Sell!
Please, check our technical outlook for AUDJPY.
Time Frame: 1D
Current Trend: Bearish
Sentiment: Overbought (based on 7-period RSI)
Forecast: Bearish
The market is approaching a significant resistance area 96.835.
Due to the fact that we see a positive bearish reaction from the underlined area, I strongly believe that sellers will manage to push the price all the way down to 93.887 level.
P.S
The term oversold refers to a condition where an asset has traded lower in price and has the potential for a price bounce.
Overbought refers to market scenarios where the instrument is traded considerably higher than its fair value. Overvaluation is caused by market sentiments when there is positive news.
Disclosure: I am part of Trade Nation's Influencer program and receive a monthly fee for using their TradingView charts in my analysis.
Like and subscribe and comment my ideas if you enjoy them!
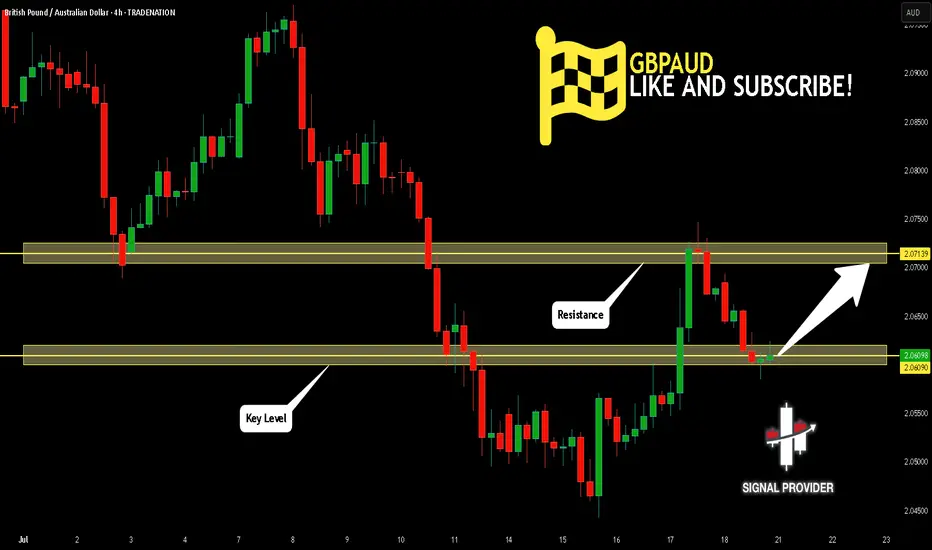
GBPAUD Will Go Up From Support! Long!
Here is our detailed technical review for GBPAUD.
Time Frame: 4h
Current Trend: Bullish
Sentiment: Oversold (based on 7-period RSI)
Forecast: Bullish
The market is on a crucial zone of demand 2.060.
The oversold market condition in a combination with key structure gives us a relatively strong bullish signal with goal 2.071 level.
P.S
We determine oversold/overbought condition with RSI indicator.
When it drops below 30 - the market is considered to be oversold.
When it bounces above 70 - the market is considered to be overbought.
Disclosure: I am part of Trade Nation's Influencer program and receive a monthly fee for using their TradingView charts in my analysis.
Like and subscribe and comment my ideas if you enjoy them!
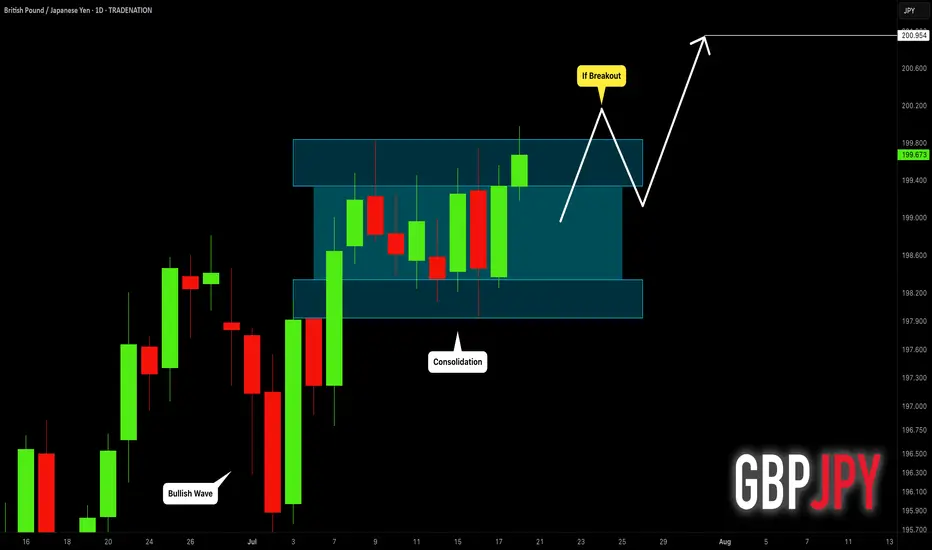
GBPJPY: Get Ready to Buy 🇬🇧🇯🇵
GBPJPY is consolidating within a narrow horizontal range
on a daily time frame.
I am waiting for its bullish breakout and a daily candle close above
199.85 to confirm the next bullish wave.
A rise will be expected to 201 level then.
❤️Please, support my work with like, thank you!❤️
I am part of Trade Nation's Influencer program and receive a monthly fee for using their TradingView charts in my analysis.
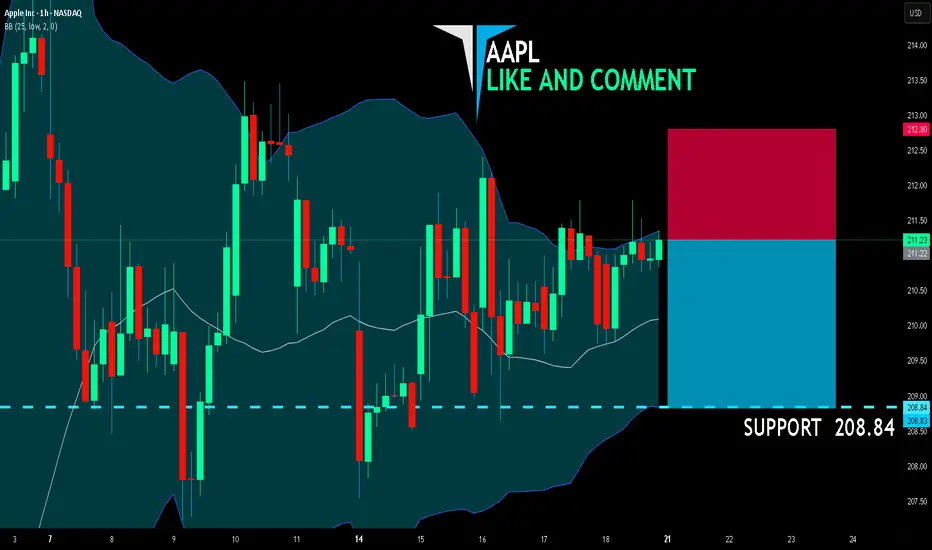
AAPL BEARS WILL DOMINATE THE MARKET|SHORT
AAPL SIGNAL
Trade Direction: short
Entry Level: 211.22
Target Level: 208.84
Stop Loss: 212.80
RISK PROFILE
Risk level: medium
Suggested risk: 1%
Timeframe: 1h
Disclosure: I am part of Trade Nation's Influencer program and receive a monthly fee for using their TradingView charts in my analysis.
✅LIKE AND COMMENT MY IDEAS✅