EURUSD Will Go Up! Buy!
Here is our detailed technical review for EURUSD.
Time Frame: 6h
Current Trend: Bullish
Sentiment: Oversold (based on 7-period RSI)
Forecast: Bullish
The market is trading around a solid horizontal structure 1.169.
The above observations make me that the market will inevitably achieve 1.177 level.
P.S
The term oversold refers to a condition where an asset has traded lower in price and has the potential for a price bounce.
Overbought refers to market scenarios where the instrument is traded considerably higher than its fair value. Overvaluation is caused by market sentiments when there is positive news.
Disclosure: I am part of Trade Nation's Influencer program and receive a monthly fee for using their TradingView charts in my analysis.
Like and subscribe and comment my ideas if you enjoy them!
Trading

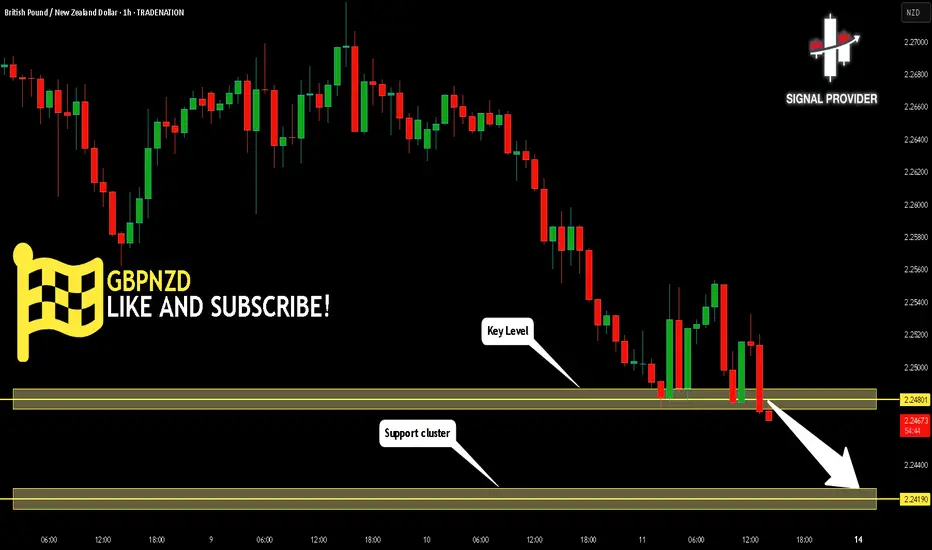
GBPNZD Is Bearish! Sell!
Please, check our technical outlook for GBPNZD.
Time Frame: 1h
Current Trend: Bearish
Sentiment: Overbought (based on 7-period RSI)
Forecast: Bearish
The market is approaching a key horizontal level 2.248.
Considering the today's price action, probabilities will be high to see a movement to 2.241.
P.S
Overbought describes a period of time where there has been a significant and consistent upward move in price over a period of time without much pullback.
Disclosure: I am part of Trade Nation's Influencer program and receive a monthly fee for using their TradingView charts in my analysis.
Like and subscribe and comment my ideas if you enjoy them!
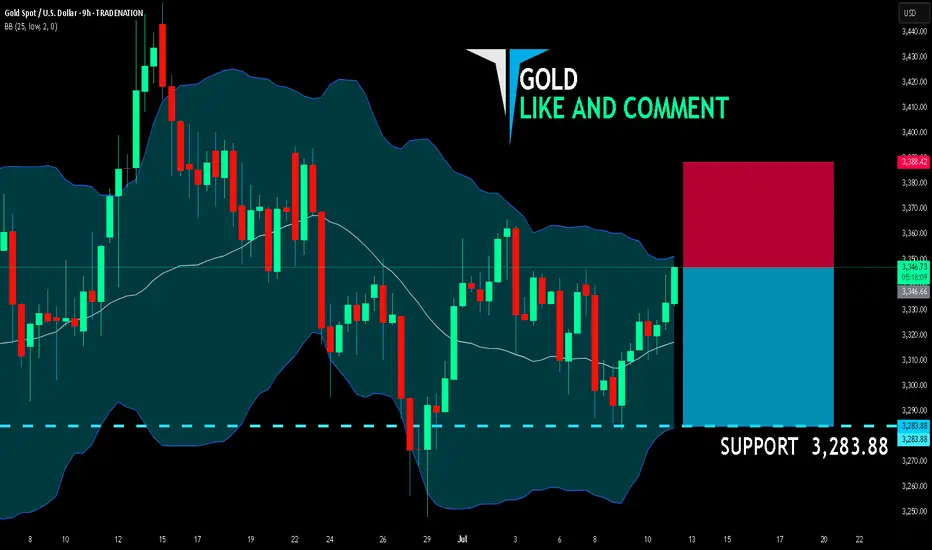
GOLD BEARISH BIAS RIGHT NOW| SHORT
GOLD SIGNAL
Trade Direction: short
Entry Level: 3,346.66
Target Level: 3,283.88
Stop Loss: 3,388.42
RISK PROFILE
Risk level: medium
Suggested risk: 1%
Timeframe: 9h
Disclosure: I am part of Trade Nation's Influencer program and receive a monthly fee for using their TradingView charts in my analysis.
✅LIKE AND COMMENT MY IDEAS✅
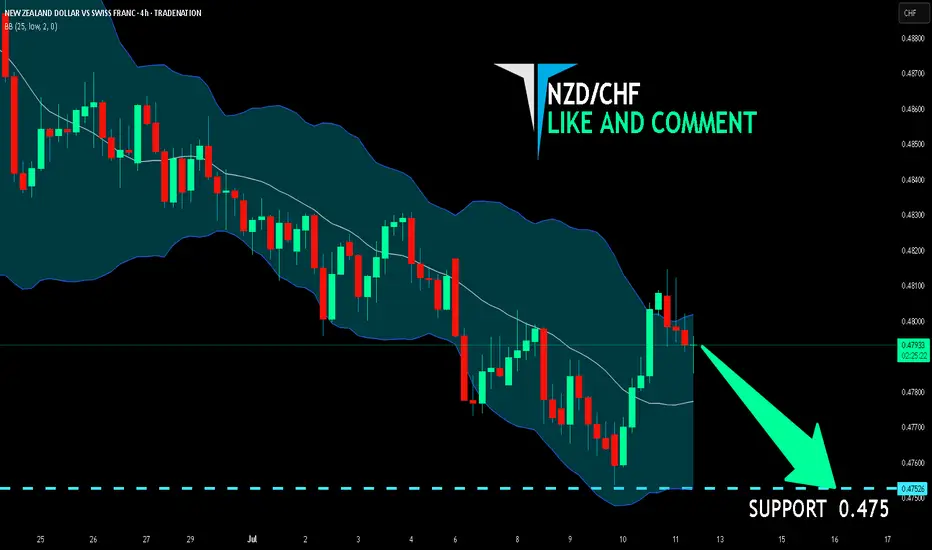
NZD/CHF BEARS ARE STRONG HERE|SHORT
Hello, Friends!
NZD/CHF is trending down which is clear from the red colour of the previous weekly candle. However, the price has locally surged into the overbought territory. Which can be told from its proximity to the BB upper band. Which presents a classical trend following opportunity for a short trade from the resistance line above towards the demand level of 0.475.
Disclosure: I am part of Trade Nation's Influencer program and receive a monthly fee for using their TradingView charts in my analysis.
✅LIKE AND COMMENT MY IDEAS✅
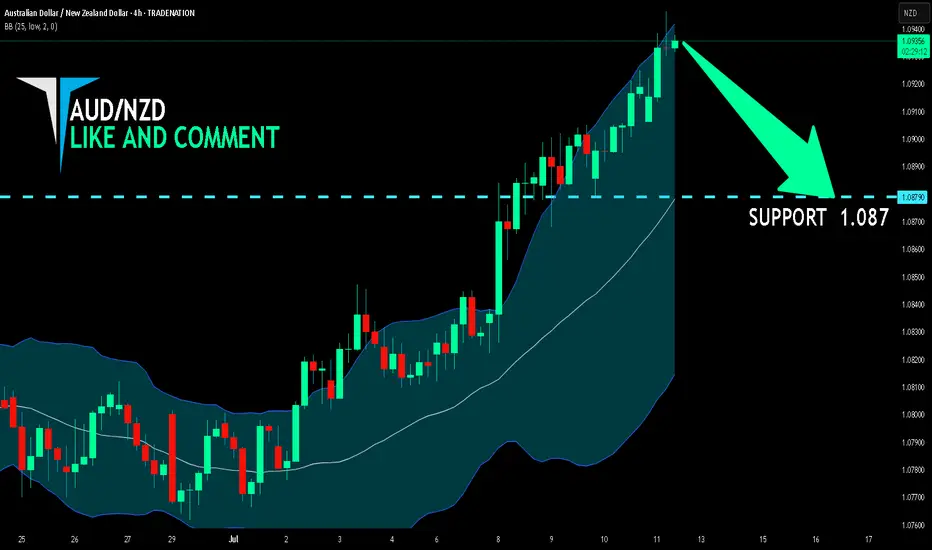
AUD/NZD SHORT FROM RESISTANCE
Hello, Friends!
AUD/NZD pair is in the downtrend because previous week’s candle is red, while the price is clearly rising on the 4H timeframe. And after the retest of the resistance line above I believe we will see a move down towards the target below at 1.087 because the pair is overbought due to its proximity to the upper BB band and a bearish correction is likely.
Disclosure: I am part of Trade Nation's Influencer program and receive a monthly fee for using their TradingView charts in my analysis.
✅LIKE AND COMMENT MY IDEAS✅
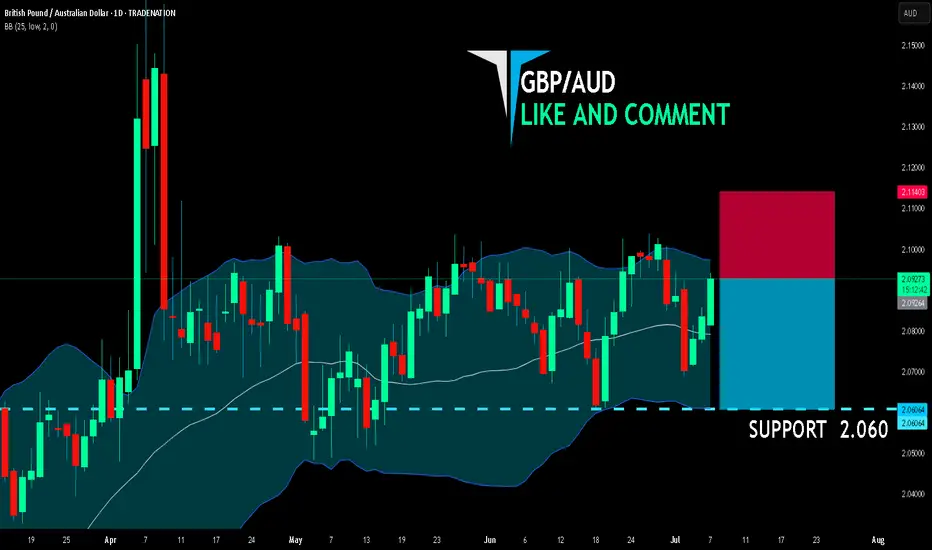
GBP/AUD BEARS ARE STRONG HERE|SHORT
GBP/AUD SIGNAL
Trade Direction: short
Entry Level: 2.092
Target Level: 2.060
Stop Loss: 2.114
RISK PROFILE
Risk level: medium
Suggested risk: 1%
Timeframe: 1D
Disclosure: I am part of Trade Nation's Influencer program and receive a monthly fee for using their TradingView charts in my analysis.
✅LIKE AND COMMENT MY IDEAS✅
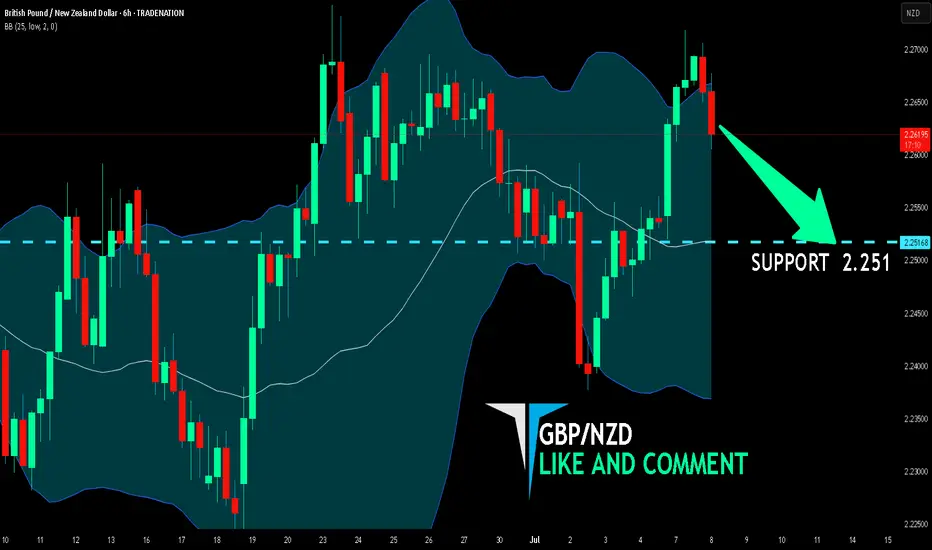
GBP/NZD BEARISH BIAS RIGHT NOW| SHORT
Hello, Friends!
GBP-NZD uptrend evident from the last 1W green candle makes short trades more risky, but the current set-up targeting 2.251 area still presents a good opportunity for us to sell the pair because the resistance line is nearby and the BB upper band is close which indicates the overbought state of the GBP/NZD pair.
Disclosure: I am part of Trade Nation's Influencer program and receive a monthly fee for using their TradingView charts in my analysis.
✅LIKE AND COMMENT MY IDEAS✅
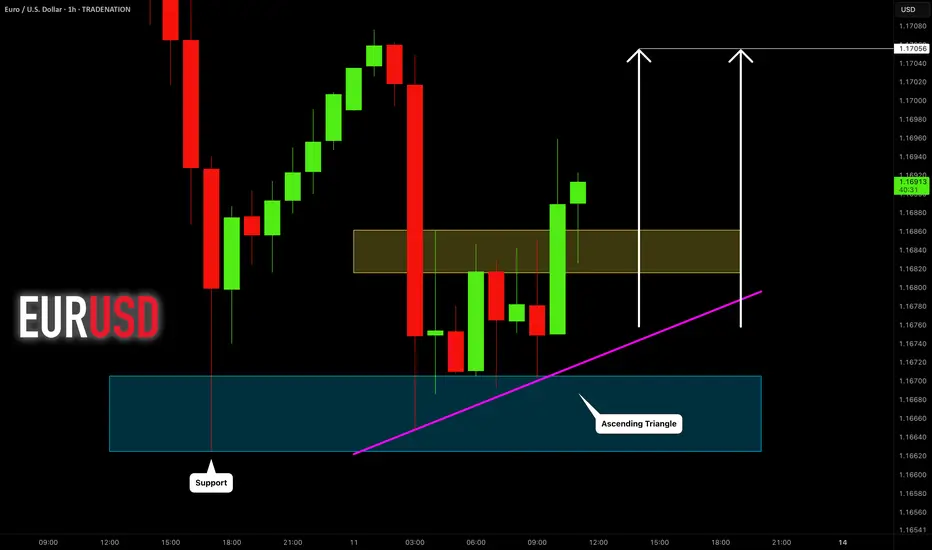
EURUSD: Strong Bullish Confirmation?! 🇪🇺🇺🇸
There is a high chance that EURUSD will move up from the
underlined intraday support.
An ascending triangle formation and a violation of its neckline
indicate a strength of the buyers.
Goal - 1.1705
❤️Please, support my work with like, thank you!❤️
I am part of Trade Nation's Influencer program and receive a monthly fee for using their TradingView charts in my analysis.
Gold Price Analysis July 11Gold price today continues to maintain a strong upward momentum after breaking the previous support trendline (gold wire). Currently, SELL orders should only be considered as short-term response transactions, with priority given to monitoring to join the main trend.
✅ Trend: Up has been confirmed, the nearest target is towards the 3390 area today.
🔑 Key Levels:
Support: 3330 – 3314
Resistance: 3345 – 3362 – 3388
🎯 Trading strategy:
SELL activation: Watch the 3345 area, only SELL when there is a price rejection signal with a confirmation of a decrease.
Potential SELL area: 3362 – 3387 (strong resistance).
BUY Activation: Look for buying opportunities at support 3330 – 3314 if there is a clear bullish reversal signal.

#AN018: Summer shock, tariffs, Fed delays, and the dollar's shif
In recent days, the forex world has experienced a sequence of key events that could redefine the global currency landscape in the coming months. Risk to the dollar has become structural, the threat of tariffs is multiplying again, and the combination of geopolitical uncertainty and monetary policy creates an extremely risky mix for exchange rates.
Let's start with the Fed minutes: Jerome Powell attributed tariff risk to the main reason for postponing possible rate cuts. Market expectations are realigning toward a longer rate cycle, fueling a climate of global uncertainty. At the same time, Goldman Sachs warns that the dollar is increasingly moving as a "risky" currency, correlated with equity markets—an emerging market rather than a safe haven.
On the geopolitical front, President Trump has relaunched the trade war: announcements of tariffs of up to 35% on Canada, up to 20% on Europe, and 50% on copper from Brazil have caused futures volatility to soar and sent the dollar into a short-term rally. But Deutsche Bank is sounding the alarm: the summer period of low liquidity and rising trade tensions represents a potential trigger for prolonged currency turbulence.
The Financial Times envisions a scenario in which the dollar loses ground as the dominant currency, ushering in a multipolar currency world in which the euro, renminbi, gold, and even cryptocurrencies could gain ground.
The impact on Forex:
USD: The narrative is changing: no longer a net safe haven, but an asset correlated with political and risk cycles. The weakness of the DXY index in the first half of 2025 (-10%) reflects this transition.
EUR/USD: Potentially favored if the dollar continues its consolidation. However, new tariffs and US-EU uncertainty could provide temporary support for the greenback.
USD/JPY and USD/CHF: These crosses will be subject to greater volatility, with the next catalyst being the Fed minutes and the timing of tariffs. Safe-haven currencies strengthen during periods of uncertainty.
CAD, AUD, NZD: penalized by tariffs on Canada and Brazil and a weak dollar. OPEC+ and geopolitical tensions could boost commodities, but data confirmation is needed.
Commodity cross-correlation: USD/CAD could rebound if oil loses momentum, while AUD/JPY is sensitive to both the RBA and increased global risk.
Conclusion:
The current currency environment appears unstable and sensitive to political and trade developments. Summer volatility could persist, and those who can read the macro and institutional signals (Fed, tariffs, geopolitics) will have the opportunity to enter accurately. Until a stable direction emerges, EUR/USD looks like the most interesting cross to capture a potential structural correction in the dollar.

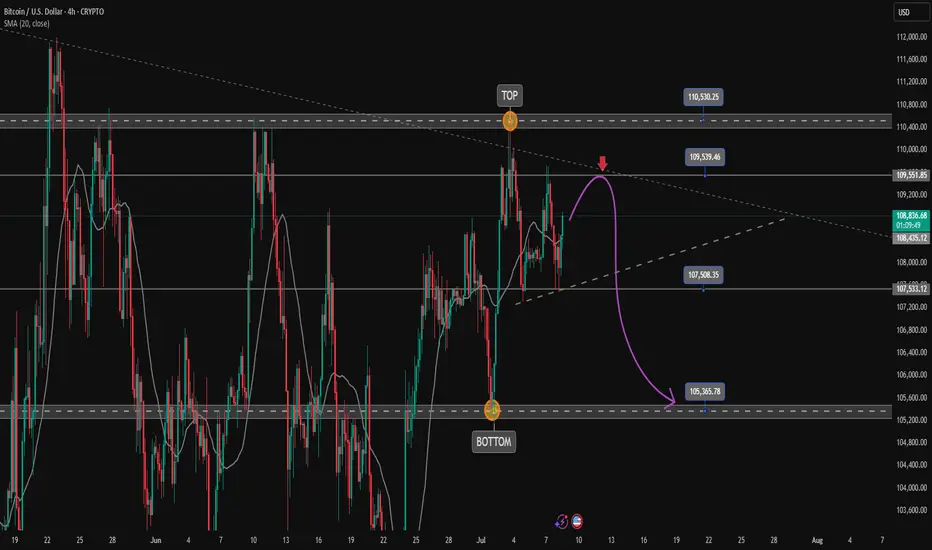
BTCUSD Heading Yesterday's Resistance Zone, Price Will React After a recovery to 107.500 BTCUSD is recovering to the upside again towards the resistance of 1.09500. This is the convergence zone between the trendline and yesterday's high. BTCUSD price may correct lower from this zone. Then find some new bullish momentum at strong support zones towards an all-time high.
Support 107.500 - 105.300
SELL Trigger: Break bellow 107.500
Resistance: 109.500- 110.500
Wish you successful trading, leave your comments about BTC.
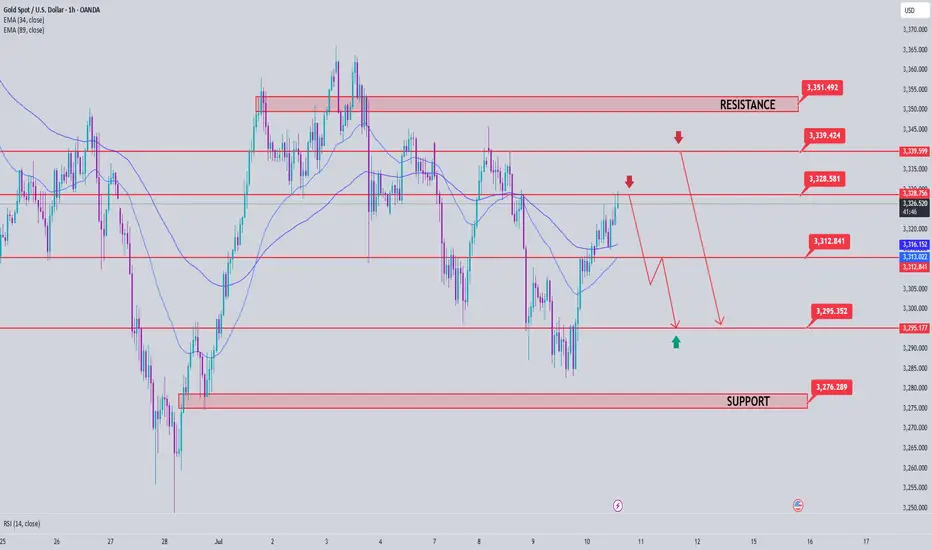
Gold price surge, today will have a decline✏️ OANDA:XAUUSD The recovery of the D1 candle and the closing candle above 3313 means that the market's downtrend has almost been broken.
The reaction at the current trendline 3284 is still very strong. The price is strongly supported by the buyers, causing gold to return to trading in a wide range.
The 3328 zone will be important in the near future. If it does not break, there will be a decline to the Gap price zone this morning. Trading according to the top-bottom method is suitable for the current market.
Support: 3312-3295-3279
Resistance: 3328-3339-3349-3363
Sell trigger: rejection from 3328–3,340 resistance block
Target: 3295 Support zone, followed by 3279 lower zone
Leave your comments on the idea. I am happy to read your views.

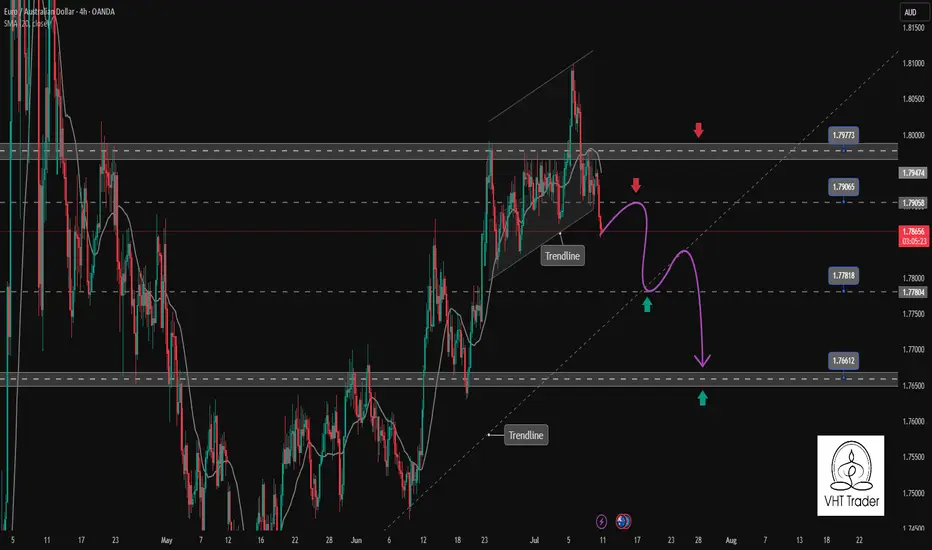
EURAUD confirms the continuation of the bearish correction trendEURAUD has just broken the rising channel to start a downtrend. The confirmation is there with the h4 candle closing completely below the support zone of the Price Channel. This corrective downtrend can now extend to the support of 1.766. The support zone is a Break point at the moment 1.778 is a positive DCA point with a SELL Entry above.
Support: 1.778-1.766
Resistance: 1.790-1.797
Sell now: Resistance zone 1.79000
Target: 1.778 Support zone, followed by 1.766 lower zone
Sell Trigger: Break below 1.778
BUY Trigger: rejection 1.778 Support zone
Leave your comments on the idea. I am happy to read your views.
Gold Price Analysis July 10🔹 XAUUSD Analysis – D1
Yesterday's D1 candle showed a strong recovery, closing above 3313, thereby significantly weakening the previous downtrend structure. Currently, the price is reacting very strongly at the trendline around 3284. Buying pressure is clearly appearing, pushing gold back to trading in a wide range.
In the short term, the 3328 area will play an important resistance role. If the price cannot break this area, the possibility of a correction down to the Gap price area this morning is quite high. The peak-bottom trading method is still giving suitable signals in the current market context.
🔹 Important zones:
Support: 3312 – 3295 – 3279
Resistance: 3328 – 3339 – 3349 – 3363
💡 Strategy:
Confirm the trading signal when the price clearly rejects the resistance zones to ensure the highest winning rate.
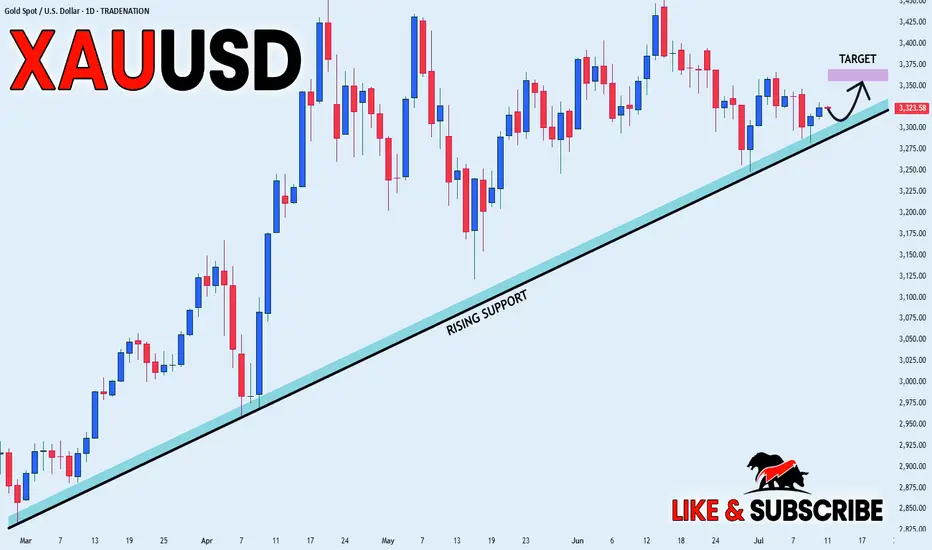
GOLD SWING LONG|
✅GOLD is trading in a strong
Long-term uptrend along the
Rising support line so we are
Bullish biased and after the price
Breakout of the local opening wedge
We we will be expecting a
Further bullish move up
LONG🚀
✅Like and subscribe to never miss a new idea!✅
Disclosure: I am part of Trade Nation's Influencer program and receive a monthly fee for using their TradingView charts in my analysis.
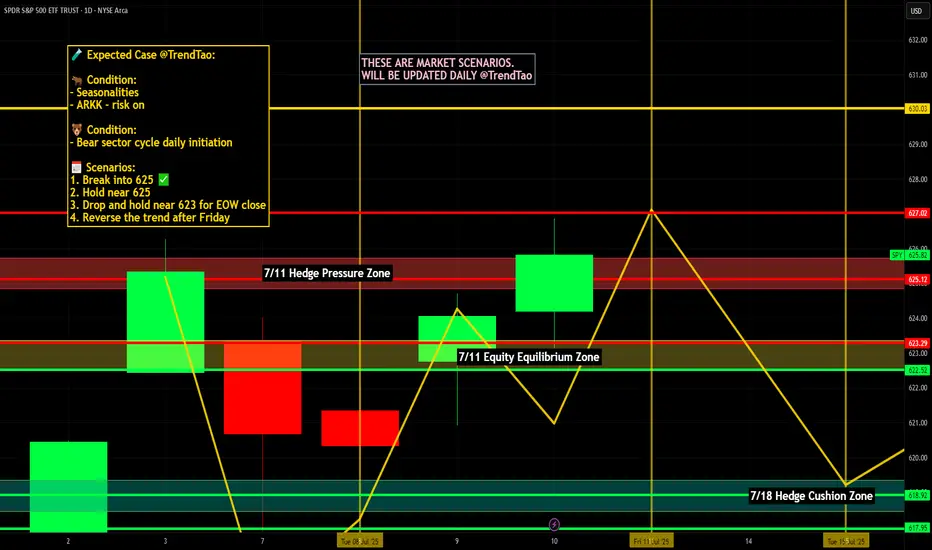
Nightly $SPY / $SPX Scenarios for July 11, 2025🔮 Nightly AMEX:SPY / SP:SPX Scenarios for July 11, 2025 🔮
🌍 Market-Moving News 🌍
🏦 Strong Bank Earnings Amid Tariff Churn
Next week’s Q2 forecasts point to robust earnings from U.S. banks—JPMorgan, Citi, Bank of America, Goldman Sachs, Morgan Stanley, and Wells Fargo—as trading and investment-banking revenue recover, offsetting uncertainties from ongoing tariffs
💬 Dimon Flags Fed Risk Pricing
JPMorgan’s Jamie Dimon cautioned that markets may be underestimating upside in interest rates. He sees a 40–50% probability of higher U.S. rates, driven by inflation from tariffs, migration, and fiscal deficits
⚖️ Tariff “Scattergun” Sparks Sector Disconnect
Trump’s plans to levy up to 200% tariffs on pharma and 50% on copper triggered uneven market reactions—copper prices rose 30% in six months, while European drugmakers remain flat, highlighting divergent sector sensitivities
📉 Tech & Macro Still Bullish
Despite policy turbulence, Nvidia climbed back above a $4 trillion valuation, and JPMorgan projects a $500 billion inflow into equities in H2—supporting gains even as broader macro pressures linger
📊 Key Data & Events
📅 Friday, July 11:
(No major U.S. economic data scheduled)
Markets will focus on bank earnings previews, tariff headlines, and the hold of the tech rally into a thin summer trading week.
⚠️ Disclaimer:
This information is for educational and informational purposes only and should not be construed as financial advice. Always consult a licensed financial advisor before making investment decisions.
📌 #trading #stockmarket #economy #tariffs #banks #tech #Fed #investing
NZD-CHF Broken Wedge Pattern! Buy!
Hello,Traders!
NZD-CHF was trading in a
Narrowing bullish wedge pattern
And now we are finally seeing
A bullish breakout so we are
Bullish biased now and we
Will be expecting a further
Bullish move up after a
Local correction
Buy!
Comment and subscribe to help us grow!
Check out other forecasts below too!
Disclosure: I am part of Trade Nation's Influencer program and receive a monthly fee for using their TradingView charts in my analysis.

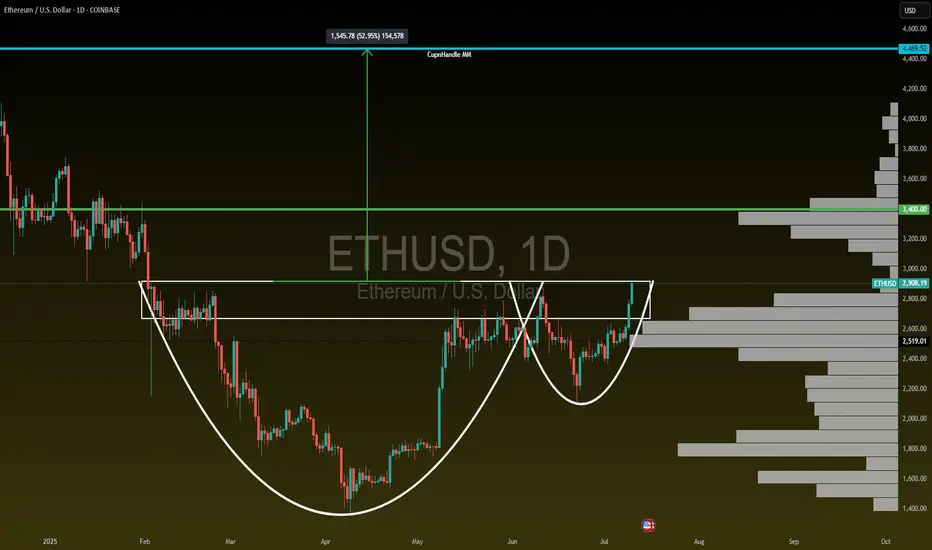
$ETH - See you later!CRYPTOCAP:ETH - See you later!
CupnHandle breakout
Volume gap up to $3400
Cupnhandle MM up to $4400+
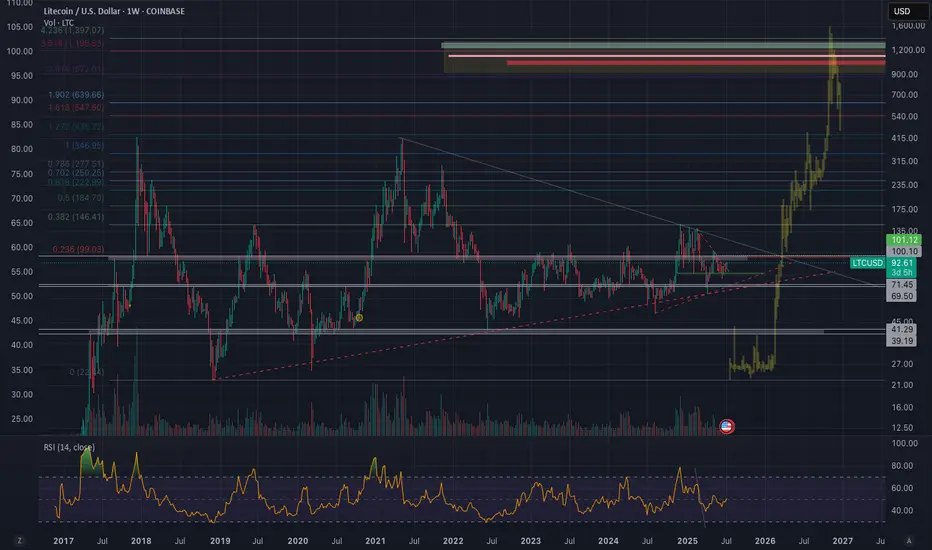
Litecoin to $1100 (12X) In This Coming AltseasonBased on tried and true fractals, multi-fib confluences, and historical price action, Litecoin is poised to hit prices between $900-1500 this cycle. The multi-fib confluences are pointing to $1100-1200 range as the most likely target. This is expected over the next 6-12 months if things continue to play out how I am expecting. As of today SEC approval of a LTC ETF is imminent but yet to be actualized.
AUD_CAD WILL KEEP GROWING|LONG|
✅AUD_CAD is going up
Now and the pair made a bullish
Breakout of the key horizontal
Level of 0.8980 and the breakout
Is confirmed so we are bullish
Biased and we will be expecting
A further bullish move up
LONG🚀
✅Like and subscribe to never miss a new idea!✅
Disclosure: I am part of Trade Nation's Influencer program and receive a monthly fee for using their TradingView charts in my analysis.

EUR-USD Bullish Bias! Buy!
Hello,Traders!
EUR-USD is trading in an
Uptrend and the pair is
Making a local bearish correction
But we are bullish biased and
After the retest of the horizontal
Support of 1.1640
We will be expecting a further
Bullish move up
Buy!
Comment and subscribe to help us grow!
Check out other forecasts below too!
Disclosure: I am part of Trade Nation's Influencer program and receive a monthly fee for using their TradingView charts in my analysis.

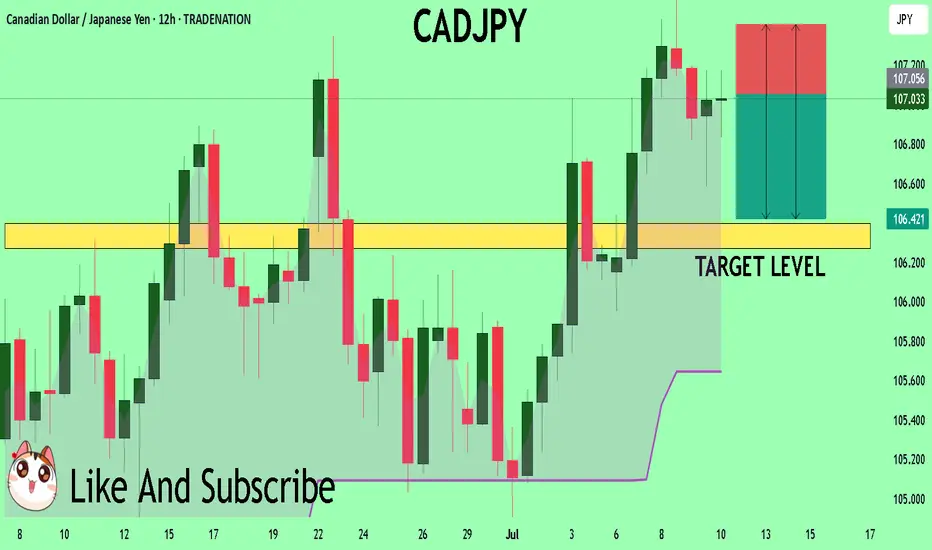
CADJPY Under Pressure! SELL!
My dear subscribers,
CADJPY looks like it will make a good move, and here are the details:
The market is trading on 107.07 pivot level.
Bias - Bearish
My Stop Loss - 107.40
Technical Indicators: Both Super Trend & Pivot HL indicate a highly probable Bearish continuation.
Target - 106.39
About Used Indicators:
The average true range (ATR) plays an important role in 'Supertrend' as the indicator uses ATR to calculate its value. The ATR indicator signals the degree of price volatility.
Disclosure: I am part of Trade Nation's Influencer program and receive a monthly fee for using their TradingView charts in my analysis.
———————————
WISH YOU ALL LUCK
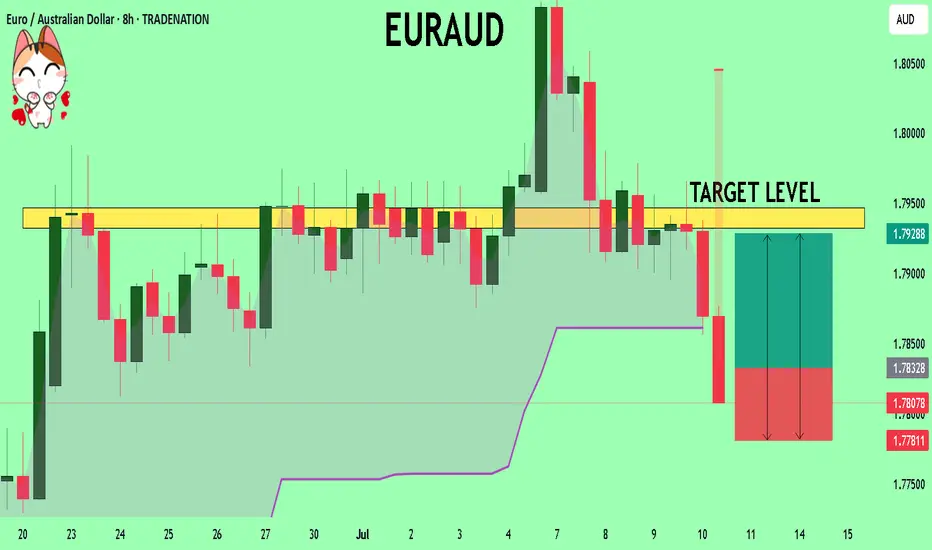
EURAUD Set To Grow! BUY!
My dear followers,
This is my opinion on the EURAUD next move:
The asset is approaching an important pivot point 1.7833
Bias - Bullish
Safe Stop Loss - 1.7781
Technical Indicators: Supper Trend generates a clear long signal while Pivot Point HL is currently determining the overall Bullish trend of the market.
Goal - 1.7932
About Used Indicators:
For more efficient signals, super-trend is used in combination with other indicators like Pivot Points.
Disclosure: I am part of Trade Nation's Influencer program and receive a monthly fee for using their TradingView charts in my analysis.
———————————
WISH YOU ALL LUCK