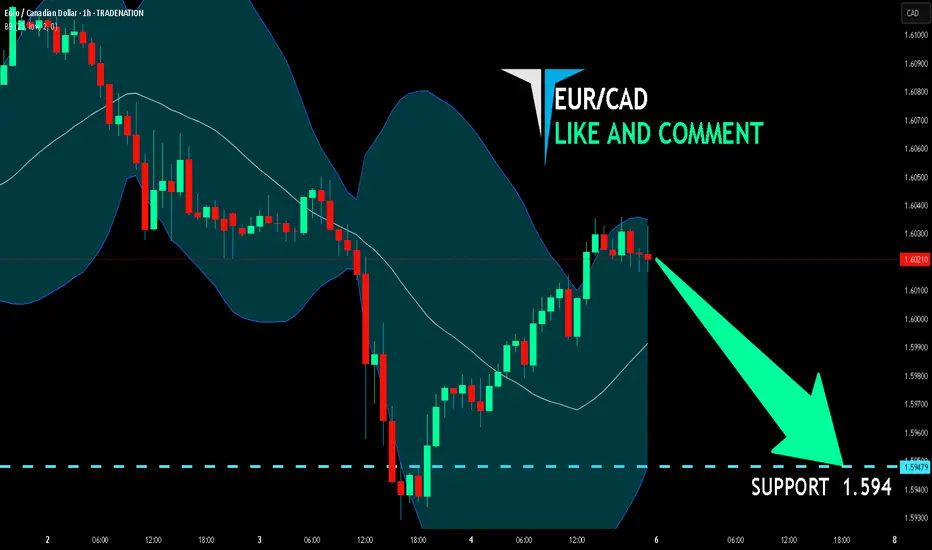
EUR/CAD BEARS ARE GAINING STRENGTH|SHORT
Hello, Friends!
We are targeting the 1.594 level area with our short trade on EUR/CAD which is based on the fact that the pair is overbought on the BB band scale and is also approaching a resistance line above thus going us a good entry option.
Disclosure: I am part of Trade Nation's Influencer program and receive a monthly fee for using their TradingView charts in my analysis.
✅LIKE AND COMMENT MY IDEAS✅
Trading
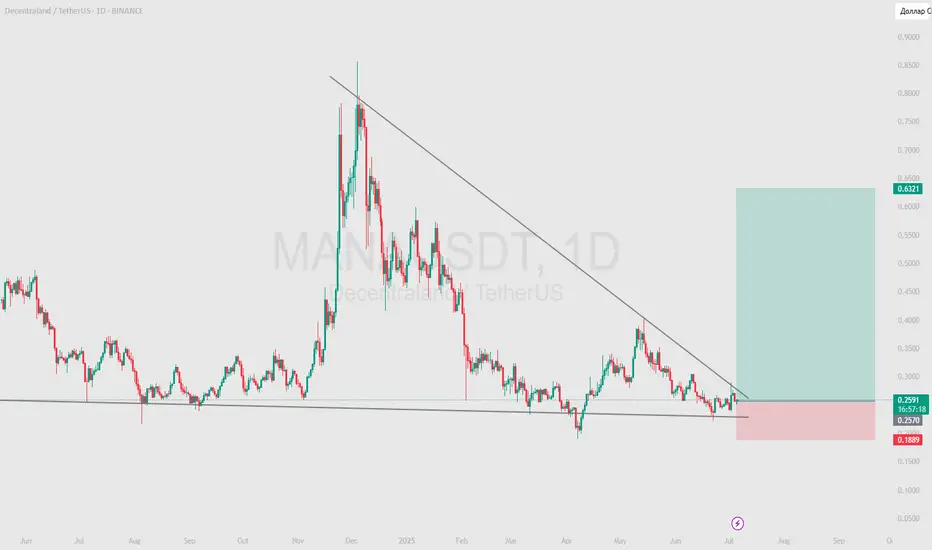
MANA - move in support and then shoot at 150%Price Prediction:
Short Term (1-3 Days):
The price may continue to move within the falling wedge, maintaining a downward trajectory. However, there is a high probability of testing the lower boundary of the wedge ($0.1900 USDT).
If the price holds above $0.1900 USDT, this could signal a corrective rally toward the $0.2750 USDT level.
Medium Term (1-2 Weeks):
If the price successfully tests the lower boundary of the wedge and rebounds upward, this could lead to a reversal of the pattern and the start of an uptrend.
The target levels after a wedge breakout would be $0.3863 USDT (previous local high).
In case of an unsuccessful test of support ($0.1889 USDT), the price may continue to decline toward deeper support levels (e.g., $0.1500 USDT).
Long Term (1 Month+):
If there is a successful reversal of the falling wedge pattern, this could mark the beginning of a sustained recovery. Target levels could extend beyond $0.3863 USDT, such as $0.5000 USDT or higher.
However, if the downtrend continues without reversal, long-term targets could be significantly below current levels.
Trading Recommendations:
Long (Buy):
Entry: After a successful test of the lower boundary of the wedge ($0.1900 USDT) and a subsequent bounce upward.
Take-Profit: $0.2750 USDT → $0.3863 USDT → $0.5000 USDT.
Stop-Loss: Below $0.1889 USDT (to protect against further declines).
Short (Sell):
Entry: If the price fails to break above the upper boundary of the wedge ($0.2750 USDT) and begins to decline.
Take-Profit: $0.1900 USDT → $0.1500 USDT.
Stop-Loss: Above $0.2750 USDT (to protect against a bullish reversal).
Conclusion:
At the moment, the asset MANA is in a downtrend, forming a falling wedge. This creates potential for both a corrective rally and a continuation of the decline. The key event will be the test of the lower boundary of the wedge ($0.1900 USDT). A successful test could lead to a reversal of the pattern and the start of an uptrend, while an unsuccessful test could strengthen the downtrend.
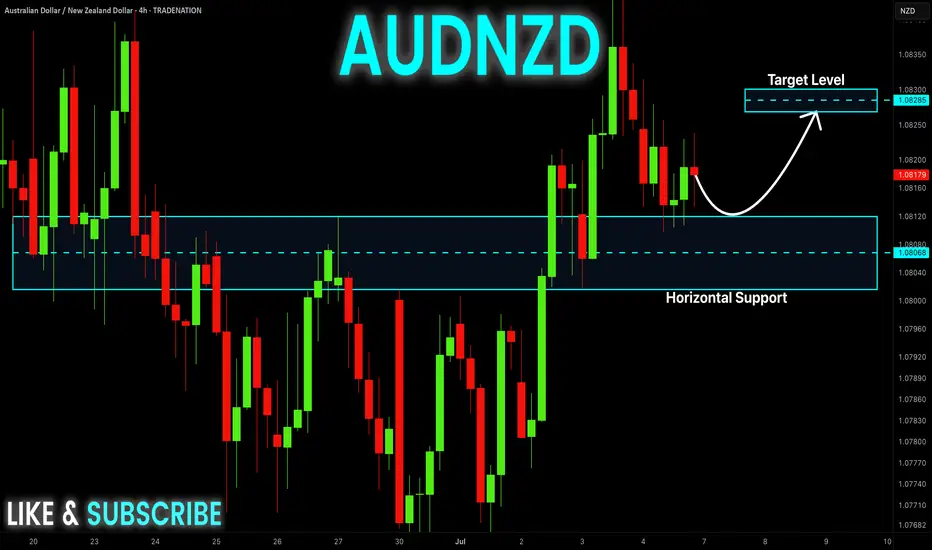
AUD-NZD Local Long! Buy!
Hello,Traders!
AUD-NZD is already making
A bullish rebound from the
Horizontal support of 1.0810
So we are locally bullish biased
And we will be expecting a
Further bullish move up
Buy!
Comment and subscribe to help us grow!
Check out other forecasts below too!
Disclosure: I am part of Trade Nation's Influencer program and receive a monthly fee for using their TradingView charts in my analysis.
An entry for a long position incoming
It looks like a good entry point for a long position.
Close the position once the price hits the SR above or the Road level

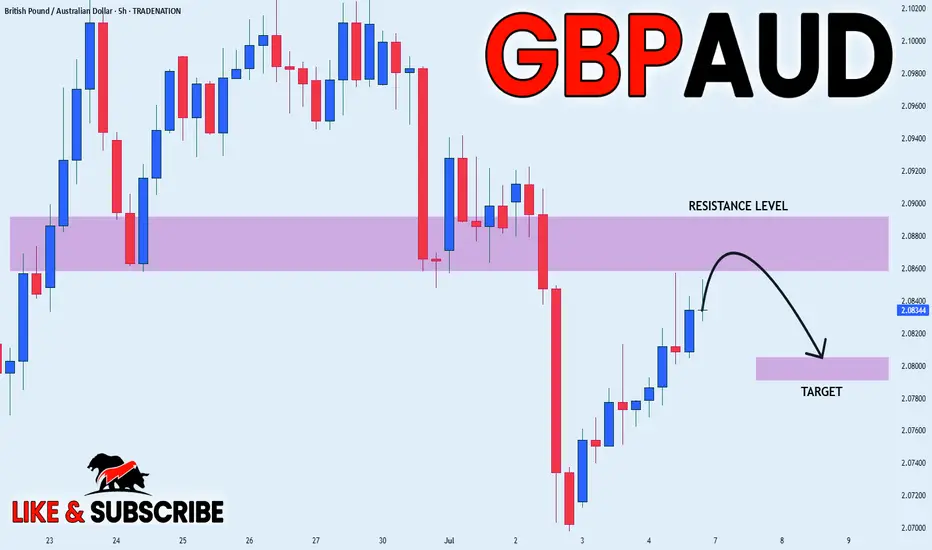
GBP_AUD BEARISH BIAS|SHORT|
✅GBP_AUD is going up to retest
A horizontal resistance of 2.0892
Which makes me locally bearish biased
And I think that we will see a pullback
And a move down from the level
Towards the target below at 2.0805
SHORT🔥
✅Like and subscribe to never miss a new idea!✅
Disclosure: I am part of Trade Nation's Influencer program and receive a monthly fee for using their TradingView charts in my analysis.
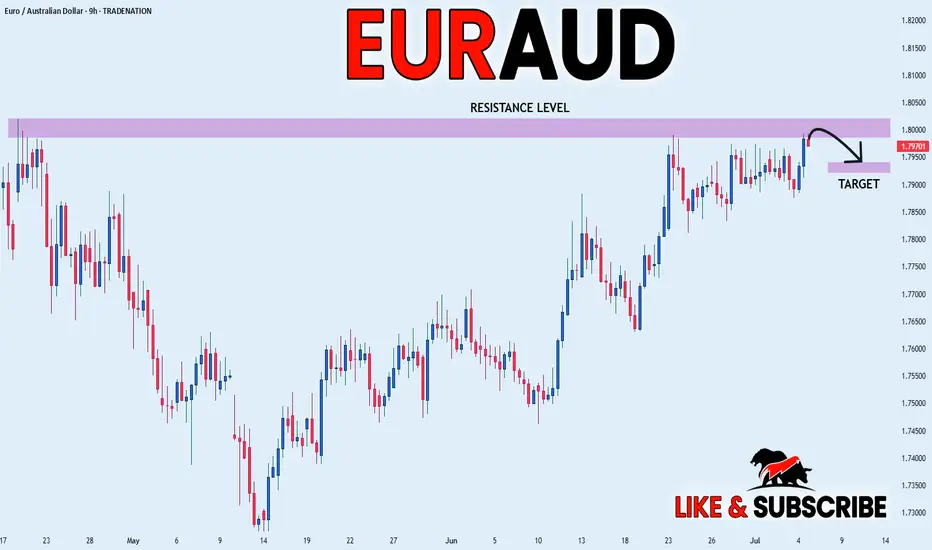
EUR_AUD LOCAL CORRECTION|SHORT|
✅EUR_AUD is set to retest a
Strong resistance level above at 1.8020
After trading in a local uptrend for some time
Which makes a bearish pullback a likely scenario
With the target being a local support below at 1.7940
SHORT🔥
✅Like and subscribe to never miss a new idea!✅
Disclosure: I am part of Trade Nation's Influencer program and receive a monthly fee for using their TradingView charts in my analysis.
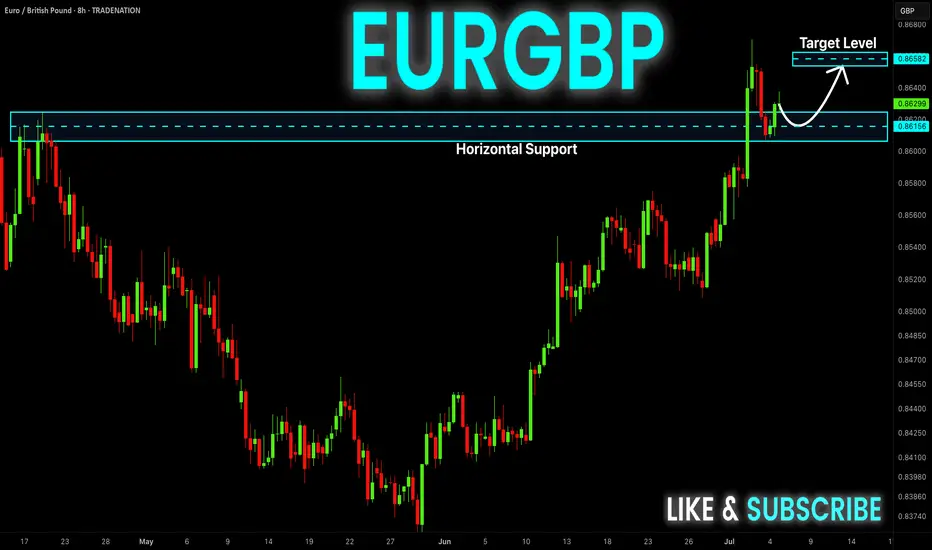
EUR-GBP Will Grow! Buy!
Hello,Traders!
EUR-GBP keeps trading in
A strong uptrend and the
Pair made a retest and a
Rebound from the horizontal
Support level around 0.8621
So we are bullish biased and
We will be expecting a
Further bullish move up
Buy!
Comment and subscribe to help us grow!
Check out other forecasts below too!
Disclosure: I am part of Trade Nation's Influencer program and receive a monthly fee for using their TradingView charts in my analysis.
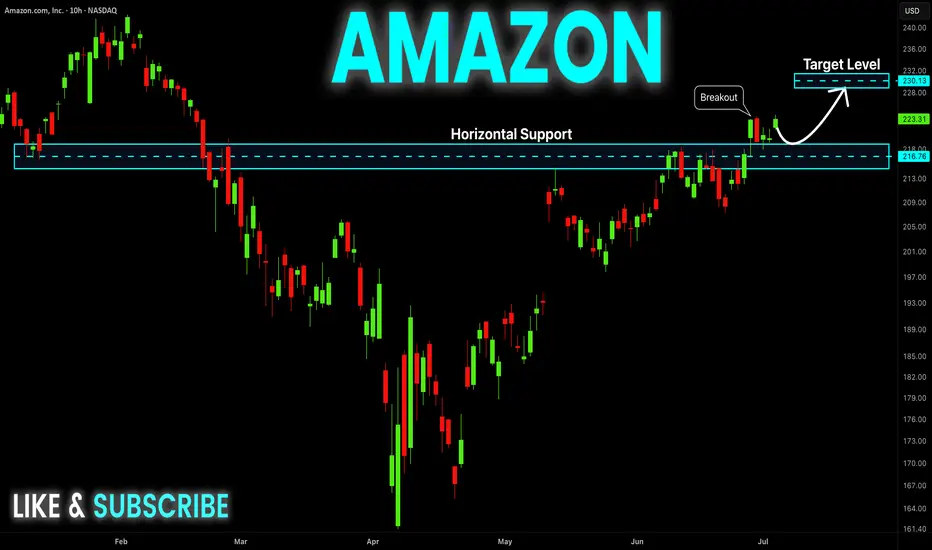
AMAZON Will Keep Growing! Buy!
Hello,Traders!
AMAZON is trading in an
Uptrend and the stock made
A breakout and retest of the
Key horizontal support
Of 218$ and is going up again
So we are bullish biased
And we will be expecting
A further bullish move up
Buy!
Comment and subscribe to help us grow!
Check out other forecasts below too!
Disclosure: I am part of Trade Nation's Influencer program and receive a monthly fee for using their TradingView charts in my analysis.
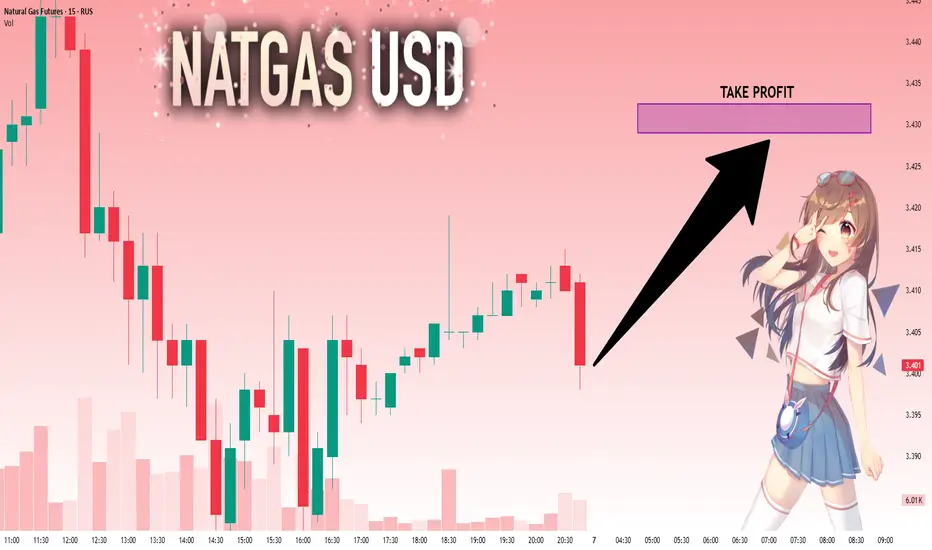
NG1!: Move Up Expected! Long!
My dear friends,
Today we will analyse NG1! together☺️
The price is near a wide key level
and the pair is approaching a significant decision level of 3.403 Therefore, a strong bullish reaction here could determine the next move up.We will watch for a confirmation candle, and then target the next key level of 3.429.Recommend Stop-loss is beyond the current level.
❤️Sending you lots of Love and Hugs❤️
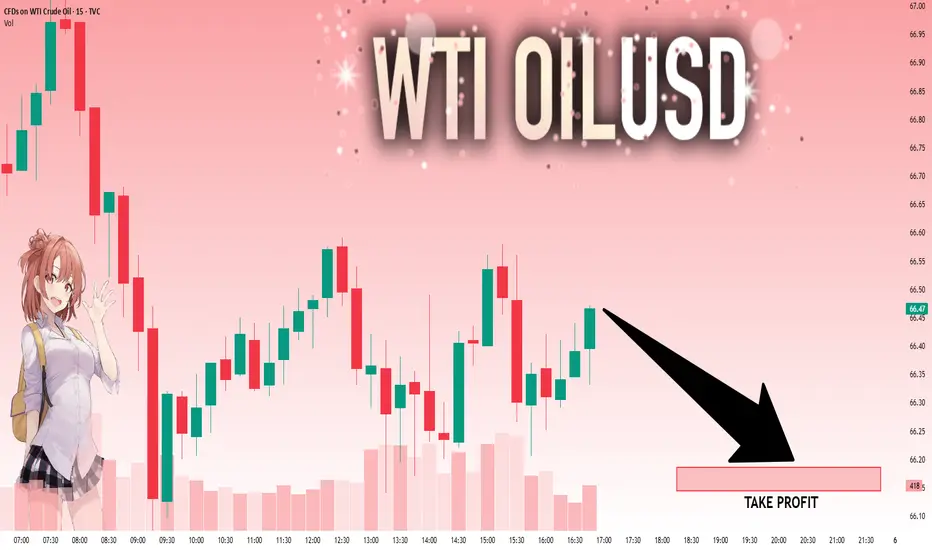
USOIL: Local Bearish Bias! Short!
My dear friends,
Today we will analyse USOIL together☺️
The recent price action suggests a shift in mid-term momentum. A break below the current local range around 66.47 will confirm the new direction downwards with the target being the next key level of 66.19.and a reconvened placement of a stop-loss beyond the range.
❤️Sending you lots of Love and Hugs❤️
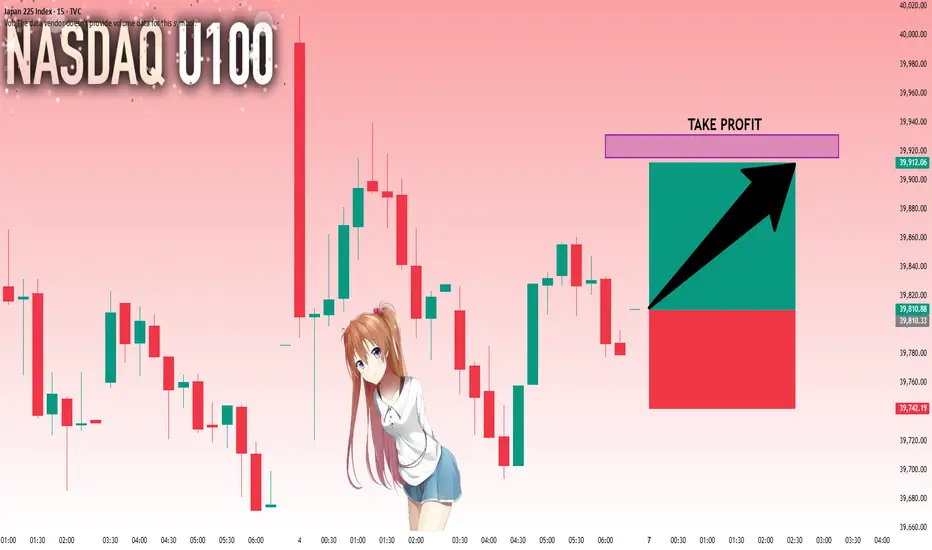
NI225: Strong Growth Ahead! Long!
My dear friends,
Today we will analyse NI225 together☺️
The in-trend continuation seems likely as the current long-term trend appears to be strong, and price is holding above a key level of 39,810.33 So a bullish continuation seems plausible, targeting the next high. We should enter on confirmation, and place a stop-loss beyond the recent swing level.
❤️Sending you lots of Love and Hugs❤️
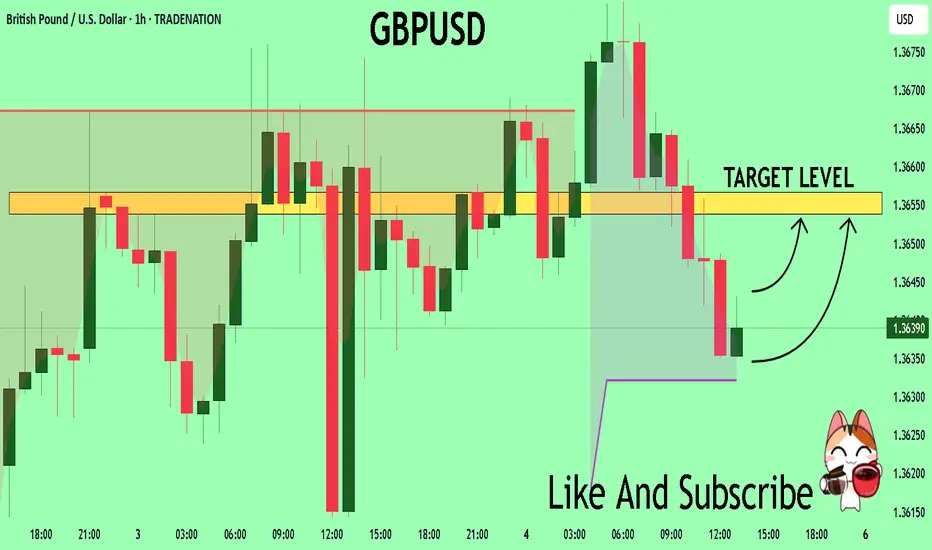
GBPUSD Sellers In Panic! BUY!
My dear friends,
Please, find my technical outlook for GBPUSD below:
The price is coiling around a solid key level - 1.3638
Bias - Bullish
Technical Indicators: Pivot Points Low anticipates a potential price reversal.
Super trend shows a clear buy, giving a perfect indicators' convergence.
Goal - 1.3653
About Used Indicators:
The pivot point itself is simply the average of the high, low and closing prices from the previous trading day.
Disclosure: I am part of Trade Nation's Influencer program and receive a monthly fee for using their TradingView charts in my analysis.
———————————
WISH YOU ALL LUCK
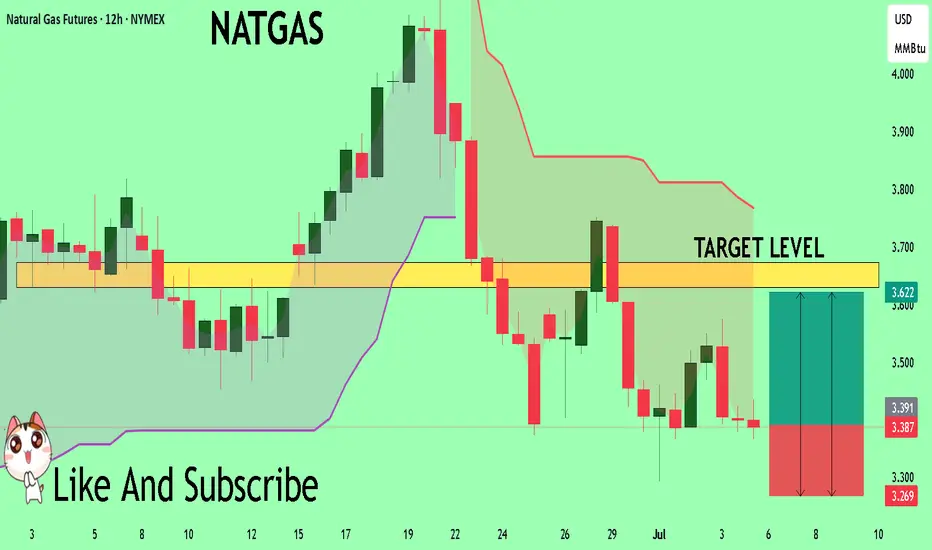
NATGAS My Opinion! BUY!
My dear followers,
This is my opinion on the NATGASnext move:
The asset is approaching an important pivot point 3.387
Bias - Bullish
Safe Stop Loss - 3.269
Technical Indicators: Supper Trend generates a clear long signal while Pivot Point HL is currently determining the overall Bullish trend of the market.
Goal - 3.630
About Used Indicators:
For more efficient signals, super-trend is used in combination with other indicators like Pivot Points.
Disclosure: I am part of Trade Nation's Influencer program and receive a monthly fee for using their TradingView charts in my analysis.
———————————
WISH YOU ALL LUCK
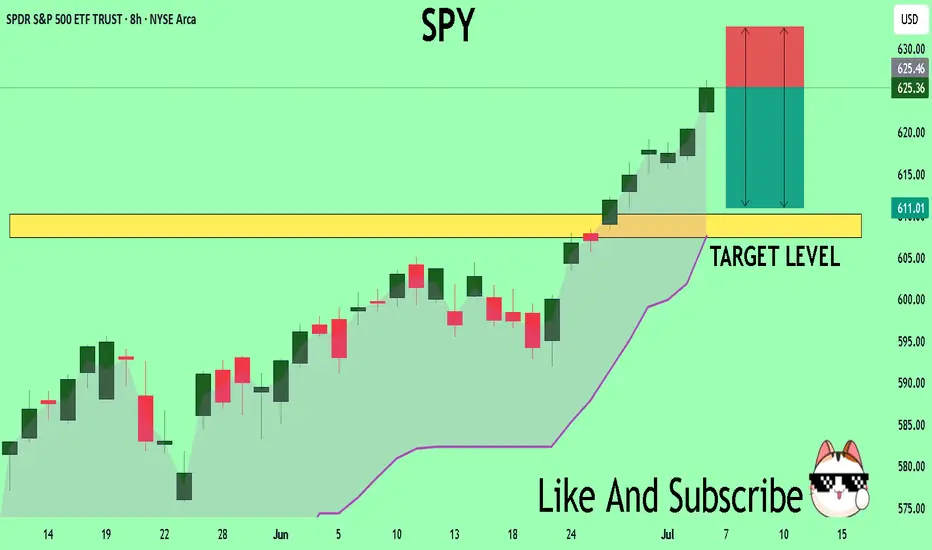
SPY Under Pressure! SELL!
My dear friends,
Please, find my technical outlook for SPY below:
The instrument tests an important psychological level 625.36
Bias - Bearish
Technical Indicators: Supper Trend gives a precise Bearish signal, while Pivot Point HL predicts price changes and potential reversals in the market.
Target - 610.17
Recommended Stop Loss - 632.61
About Used Indicators:
Super-trend indicator is more useful in trending markets where there are clear uptrends and downtrends in price.
Disclosure: I am part of Trade Nation's Influencer program and receive a monthly fee for using their TradingView charts in my analysis.
———————————
WISH YOU ALL LUCK
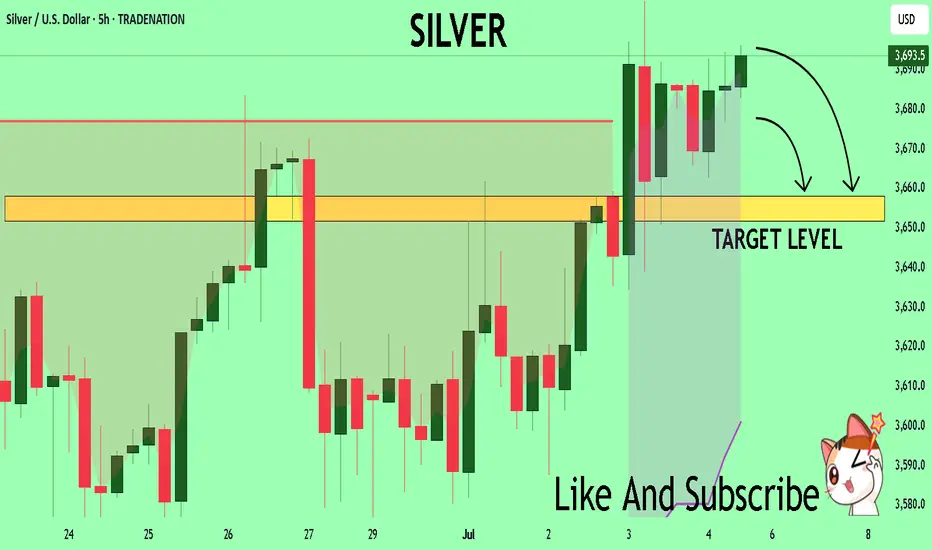
SILVER Technical Analysis! SELL!
My dear followers,
I analysed this chart on SILVER and concluded the following:
The market is trading on 36.935 pivot level.
Bias - Bearish
Technical Indicators: Both Super Trend & Pivot HL indicate a highly probable Bearish continuation.
Target - 36.582
About Used Indicators:
A super-trend indicator is plotted on either above or below the closing price to signal a buy or sell. The indicator changes color, based on whether or not you should be buying. If the super-trend indicator moves below the closing price, the indicator turns green, and it signals an entry point or points to buy.
Disclosure: I am part of Trade Nation's Influencer program and receive a monthly fee for using their TradingView charts in my analysis.
———————————
WISH YOU ALL LUCK
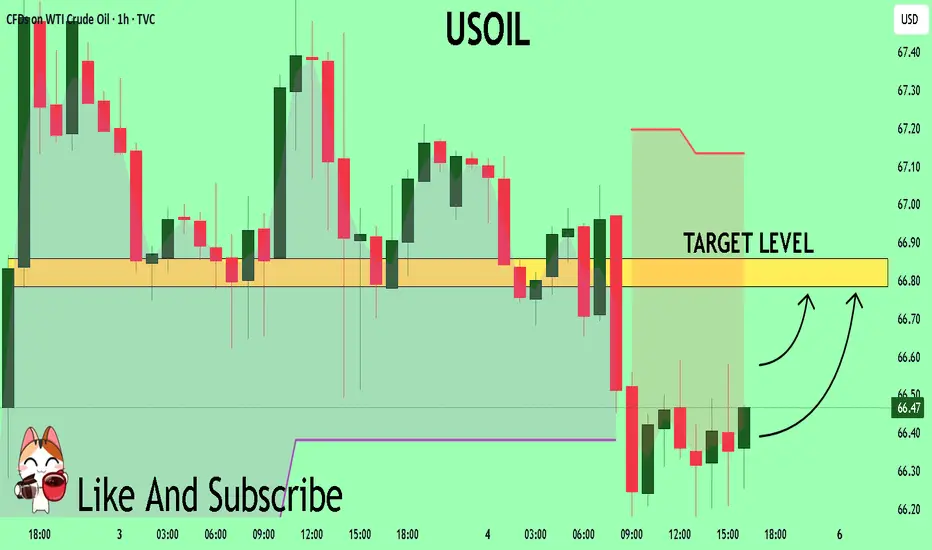
USOIL Set To Grow! BUY!
My dear friends,
USOIL looks like it will make a good move, and here are the details:
The market is trading on 66.47 pivot level.
Bias - Bullish
Technical Indicators: Supper Trend generates a clear (short / long) signal while Pivot Point HL is currently determining the overall Bullish trend of the market.
Goal - 66.79
About Used Indicators:
Pivot points are a great way to identify areas of support and resistance, but they work best when combined with other kinds of technical analysis
Disclosure: I am part of Trade Nation's Influencer program and receive a monthly fee for using their TradingView charts in my analysis.
———————————
WISH YOU ALL LUCK
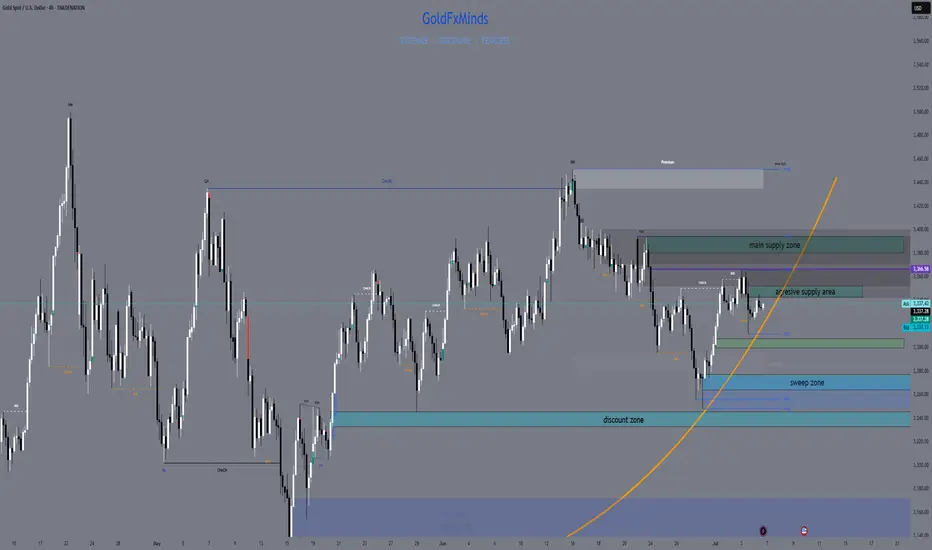
XAUUSD H4 Outlook – July 7, 2025“You don’t chase gold. You set the trap, then wait.”
👋 Hey traders — we’re gearing up for a new week on gold, and the H4 chart is starting to speak clearly. After Friday’s clean push into premium rejection zones, price is now compressing beneath a key supply block. Structure is fragile, and the next move will likely come fast.
Let’s position with precision before the breakout.
—
🔸 H4 Bias
Structure remains bearish short-term, with clear lower highs forming below a major supply at 3344–3351.
The broader bias leans neutral as we trade between unmitigated demand and inducement-heavy resistance. Confirmation is everything.
—
🔴 Supply Zones (Sell Areas)
3344–3351
→ H4 Fair Value Gap + OB combo inside premium
→ If price wicks above recent highs and rejects here, it could trigger a clean swing sell.
3380–3394
→ Origin of the last bearish leg + liquidity wick
→ High-risk, high-reward rejection zone if price spikes impulsively this week (e.g. post-Fed tone or surprise volatility).
—
🟢 Demand Zones (Buy Areas)
3265–3275
→ H4 FVG + flip zone + prior sweep level
→ If price taps and holds here, we may see re-accumulation for a move toward 3327–3340.
3235–3246
→ Strong unmitigated OB + discount level
→ Ideal sniper long zone only on clean rejection + structure shift (BOS on M15+).
—
🟡 Flip / Decision Zone
3299–3305
→ EMA50 + micro-range equilibrium
→ If price breaks and holds above this zone with strength, bias turns short-term bullish. If it rejects, continuation down is favored.
—
🎯 Execution Notes
EMA21/50 are acting as active compression bands — watch for rejection pressure
RSI shows no clear divergence yet — but volume is thinning
Liquidity is building above 3340 and below 3265 — prepare for traps both ways
—
🔚 Final Words
Sniper traders aren’t early — they’re precise. If you’ve been reacting too fast lately, this is your week to reset. Gold is telling a story here… but only structure speaks the truth.
🚀 If this helps bring clarity to your outlook, tap follow — we do this daily, with structure, not signals.
—
📢 Disclosure: I use Trade Nation’s broker feed on TradingView and I’m part of their influencer program.
📉 This is educational content, not financial advice.
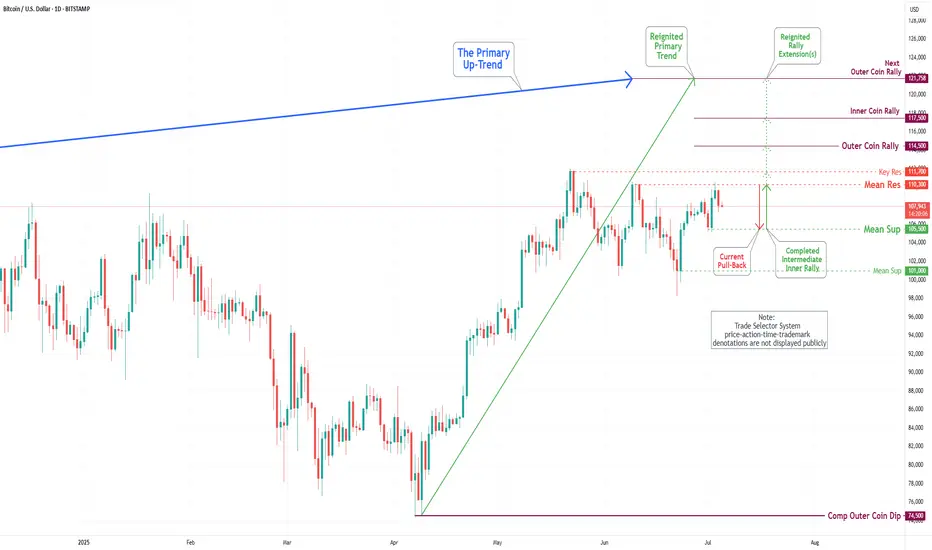
Bitcoin(BTC/USD) Daily Chart Analysis For Week of July 4, 2025Technical Analysis and Outlook:
During this week's trading session, Bitcoin rebounded from our Mean Support level of 104900 and, with significant momentum, subsequently completing the Mean Resistance level of 110300. Currently, the cryptocurrency is poised for a continuation of its downward trajectory, with a target set at the Mean Support level of 105500. This downward trend may necessitate heightened resilience to address the Key Resistance point at 111700 and the emerging historical price action of the Outer Coin Rally at 114500 and beyond. Nonetheless, it remains essential to acknowledge the possibility that current prices may experience an uptick from this juncture, bolstering the rally mentioned above.
EUR/USD Daily Chart Analysis For Week of July 4, 2025Technical Analysis and Outlook:
During the trading session this week, we witnessed the successful completion of the Outer Currency Rally at a level of 1.177. Recent analyses suggest that the Euro is likely to encounter a downward trend, with an initial target set at the Mean Support level of 1.168 and a potential extension to an additional Mean Support of 1.160. Nevertheless, it is crucial to acknowledge the possibility of a subsequent increase toward the next Outer Currency Rally level of 1.187 before any definitive downward movement transpires.

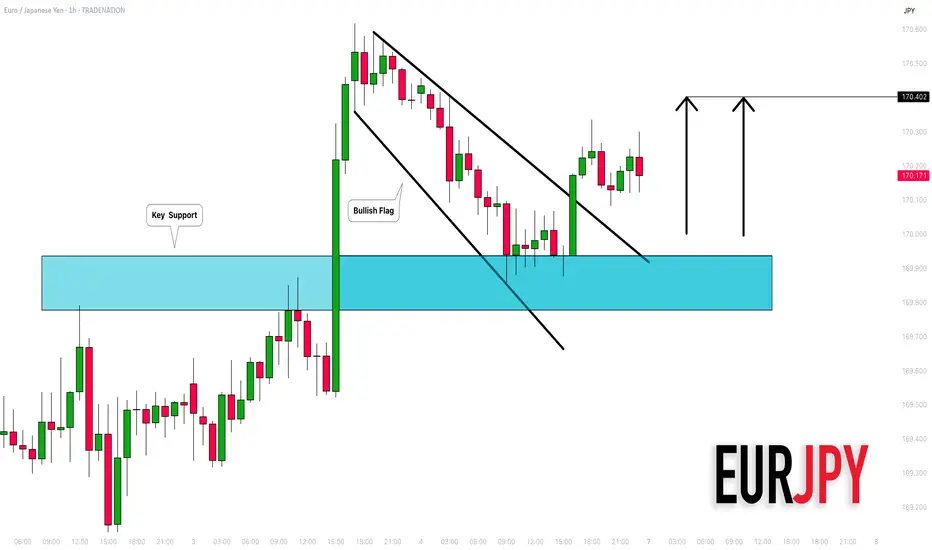
EURJPY: Bullish Outlook Explained 🇪🇺🇯🇵
There is a high chance that EURJPY will continue rising
from an underlined horizontal support.
I see 2 strong price action confirmations:
the price violated a resistance line of a bullish flag
and a neckline of a double bottom pattern.
Goal - 170.4
❤️Please, support my work with like, thank you!❤️
I am part of Trade Nation's Influencer program and receive a monthly fee for using their TradingView charts in my analysis.
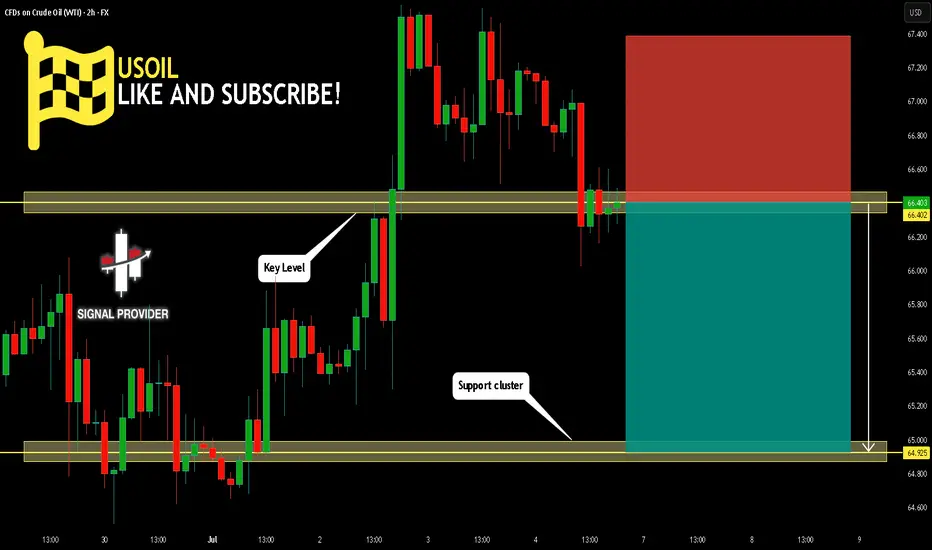
USOIL Is Bearish! Short!
Please, check our technical outlook for USOIL.
Time Frame: 2h
Current Trend: Bearish
Sentiment: Overbought (based on 7-period RSI)
Forecast: Bearish
The market is approaching a key horizontal level 66.402.
Considering the today's price action, probabilities will be high to see a movement to 64.925.
P.S
We determine oversold/overbought condition with RSI indicator.
When it drops below 30 - the market is considered to be oversold.
When it bounces above 70 - the market is considered to be overbought.
Disclosure: I am part of Trade Nation's Influencer program and receive a monthly fee for using their TradingView charts in my analysis.
Like and subscribe and comment my ideas if you enjoy them!
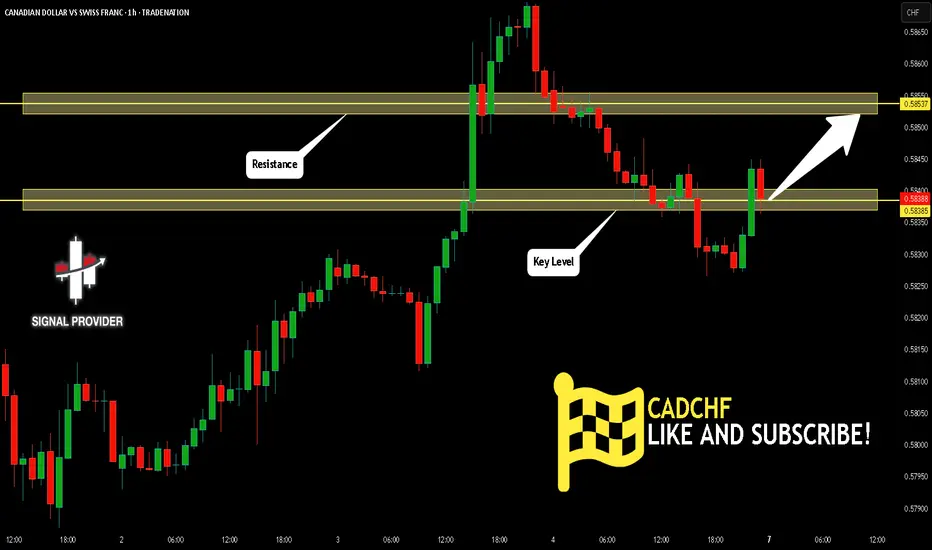
CADCHF Is Going Up! Long!
Take a look at our analysis for CADCHF.
Time Frame: 1h
Current Trend: Bullish
Sentiment: Oversold (based on 7-period RSI)
Forecast: Bullish
The market is on a crucial zone of demand 0.583.
The oversold market condition in a combination with key structure gives us a relatively strong bullish signal with goal 0.585 level.
P.S
Please, note that an oversold/overbought condition can last for a long time, and therefore being oversold/overbought doesn't mean a price rally will come soon, or at all.
Disclosure: I am part of Trade Nation's Influencer program and receive a monthly fee for using their TradingView charts in my analysis.
Like and subscribe and comment my ideas if you enjoy them!
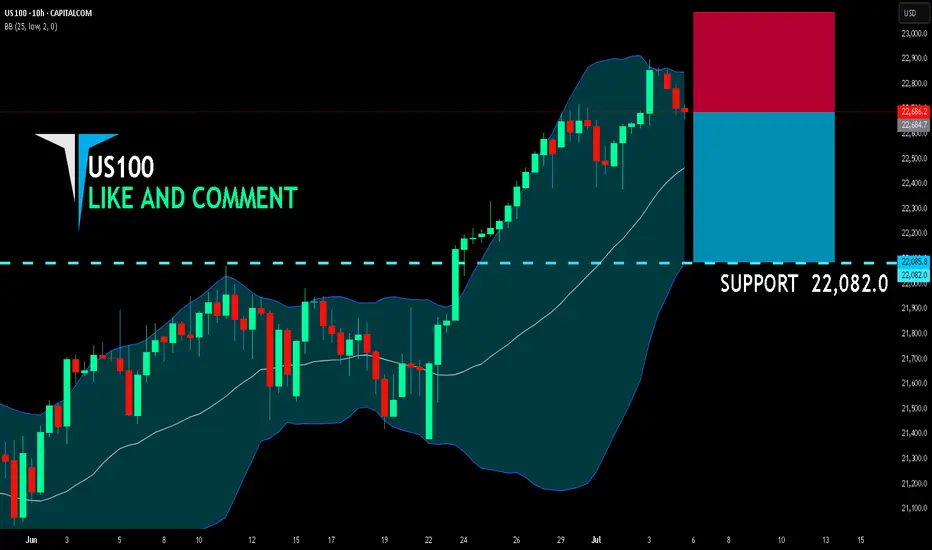
US100 SELLERS WILL DOMINATE THE MARKET|SHORT
US100 SIGNAL
Trade Direction: short
Entry Level: 22,684.7
Target Level: 22,082.0
Stop Loss: 23,085.2
RISK PROFILE
Risk level: medium
Suggested risk: 1%
Timeframe: 10h
Disclosure: I am part of Trade Nation's Influencer program and receive a monthly fee for using their TradingView charts in my analysis.
✅LIKE AND COMMENT MY IDEAS✅