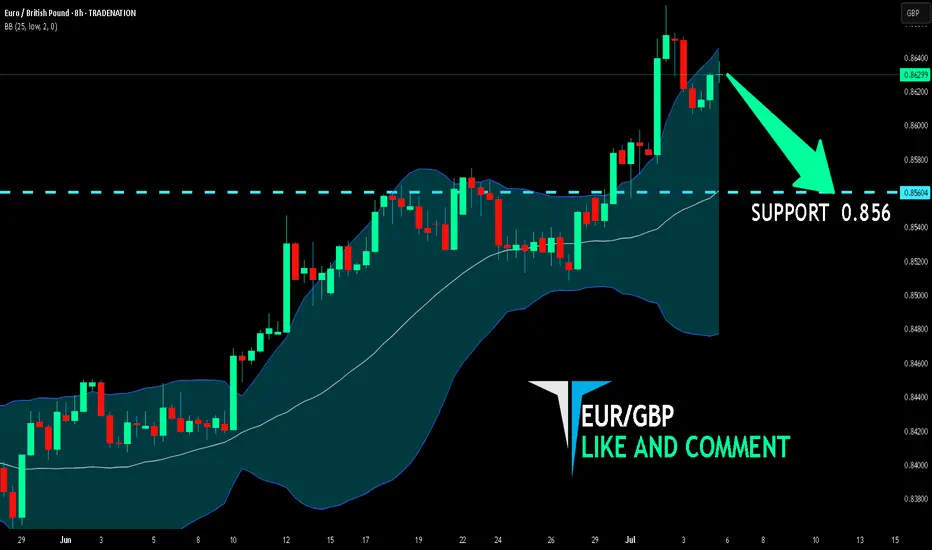
EUR/GBP BEST PLACE TO SELL FROM|SHORT
Hello, Friends!
The BB upper band is nearby so EUR-GBP is in the overbought territory. Thus, despite the uptrend on the 1W timeframe I think that we will see a bearish reaction from the resistance line above and a move down towards the target at around 0.856.
Disclosure: I am part of Trade Nation's Influencer program and receive a monthly fee for using their TradingView charts in my analysis.
✅LIKE AND COMMENT MY IDEAS✅
Trading
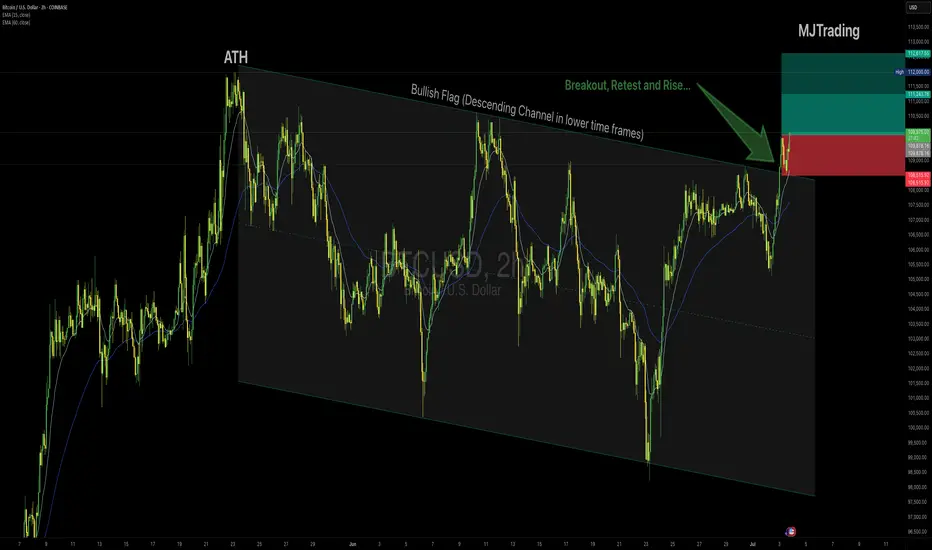
BTCUSD – Long Setup (2H Chart)👆👆🚀🚀Boost it if you like it (Thanks)🚀🚀👆👆
Idea:
Bitcoin is breaking out above the descending Flag after testing the upper boundary multiple times, showing bullish momentum confirmed by price holding above the 15 EMA and 50 EMA. The breakout aligns with strong impulse candles and sustained buying pressure.
Entry:
✅ Buy near $110,000
Stop Loss:
🔴 Below $108,500, under the breakout structure to protect against a false breakout.
Take Profit:
🟢 Tp1 $111,245
🟢 Tp2 $112,600
Rationale:
Clear breakout of the channel top resistance.
Bullish EMAs crossover with sustained slope.
Strong impulse move suggesting continuation.
Risk Management:
Position size accordingly, max risk 1–2% capital per trade.
#Bitcoin #BTCUSD #CryptoTrading #Breakout #LongSignal #TradingView #TechnicalAnalysis
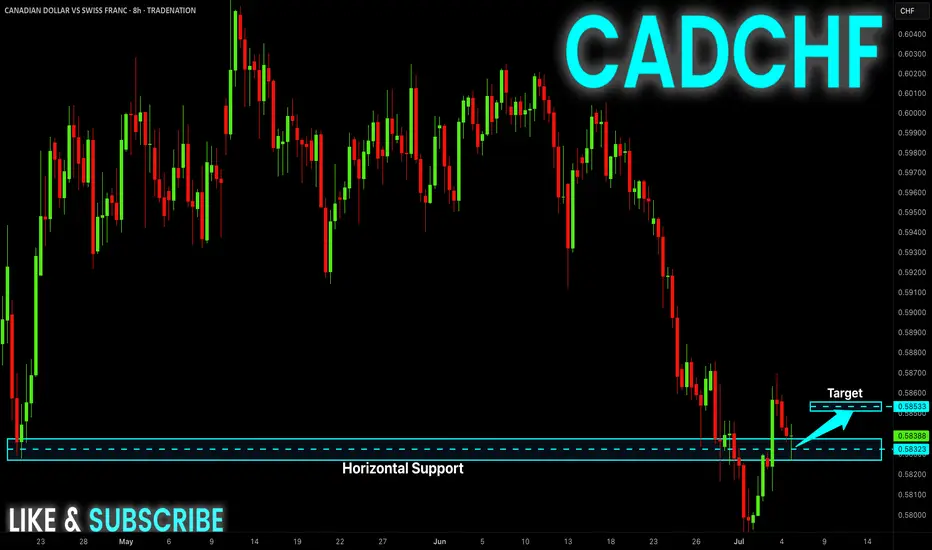
CAD-CHF Local Long! Buy!
Hello,Traders!
CAD-CHF made a retest
Of the horizontal support
Of 0.5832 so we are locally
Bullish biased and we will be
Expecting a local bullish move up
Buy!
Comment and subscribe to help us grow!
Check out other forecasts below too!
Disclosure: I am part of Trade Nation's Influencer program and receive a monthly fee for using their TradingView charts in my analysis.
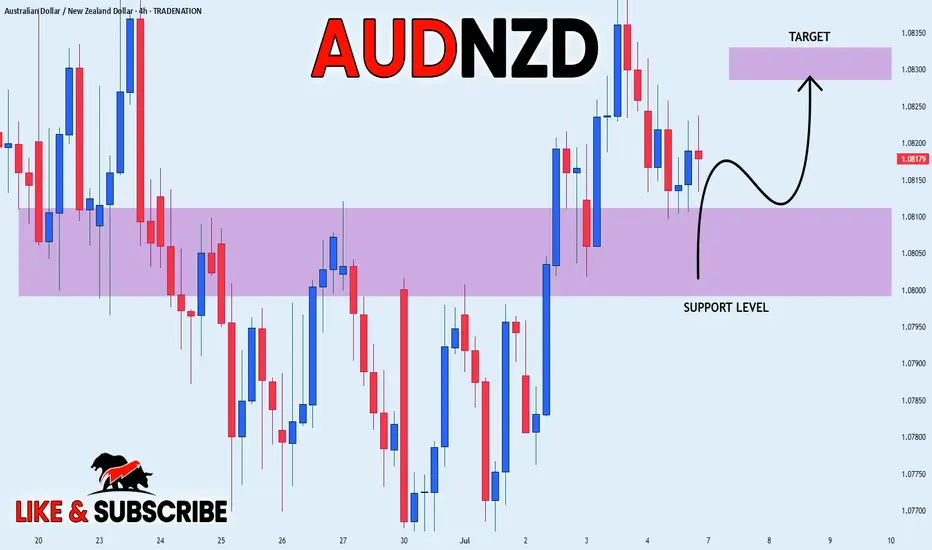
AUD_NZD WILL GROW|LONG|
✅AUD_NZD made a bullish
Rebound so we are bullish
Biased and we will be expecting
A further bullish move up
LONG🚀
✅Like and subscribe to never miss a new idea!✅
Disclosure: I am part of Trade Nation's Influencer program and receive a monthly fee for using their TradingView charts in my analysis.
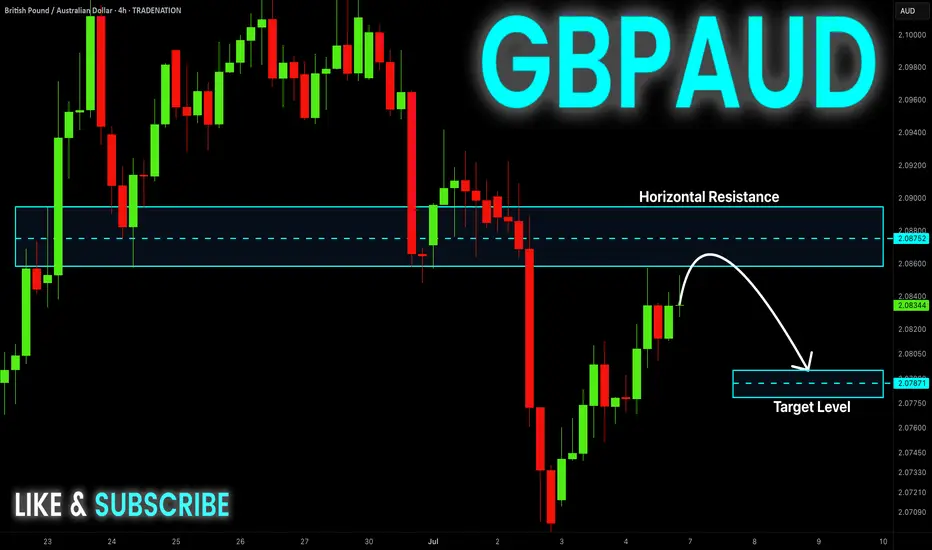
GBP-AUD Short From Resistance! Sell!
Hello,Traders!
GBP-AUD made a retest of
The horizontal resistance
Around 2.0800 from where
We will be expecting a
Local bearish move down
Sell!
Comment and subscribe to help us grow!
Check out other forecasts below too!
Disclosure: I am part of Trade Nation's Influencer program and receive a monthly fee for using their TradingView charts in my analysis.
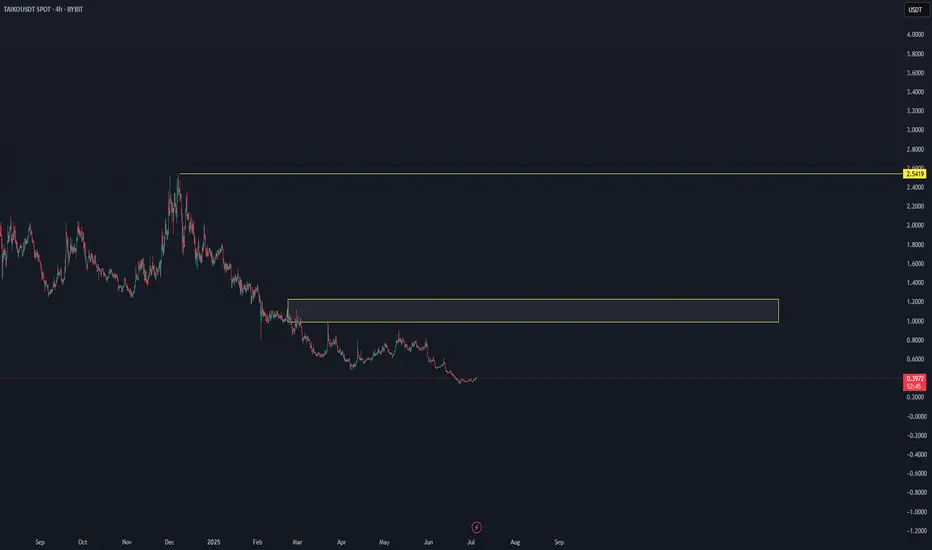
TAIKO/USDT NEW INCREASE VIEWThe latest data shows that this coin is entering a new uptrend, which can be confirmed in the coming time frames, see the last update.
In trading, it's about building a real, confirmed trend, starting with building and holding levels.
The keys are: Start of a new cycle, start of new smart money
This coin is at the first level of scan, and time frames should confirm if it's an interesting coin or not. Until now, there is no confirmation; only the first scan shows it can be interesting.
* This coin is a high-risk coin.
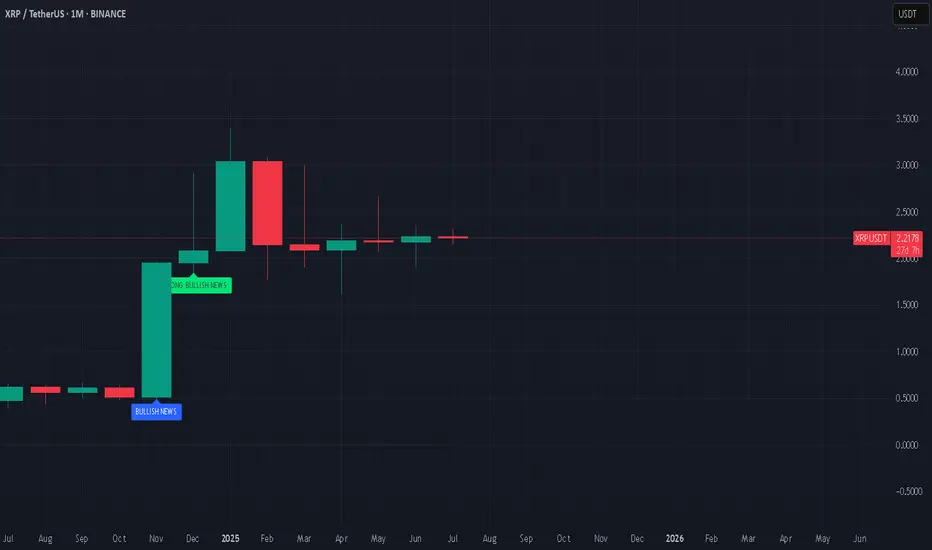
Will Ripple "leave a dent in the universe"?They called us crazy, when we bought xrp at the bottom, in the midst of court cases. What they don't see is that, many TODAY major companies that changed the world (e.g. Apple, Amazon, MSFT etc.) had long term court cases with the SEC before "leaving a dent in the universe". In our opinion, Ripple is next in line.
#xrp #crypto #bitcoin #ripple #banking #blockchain #finance #money #stablecoin #financialsystem
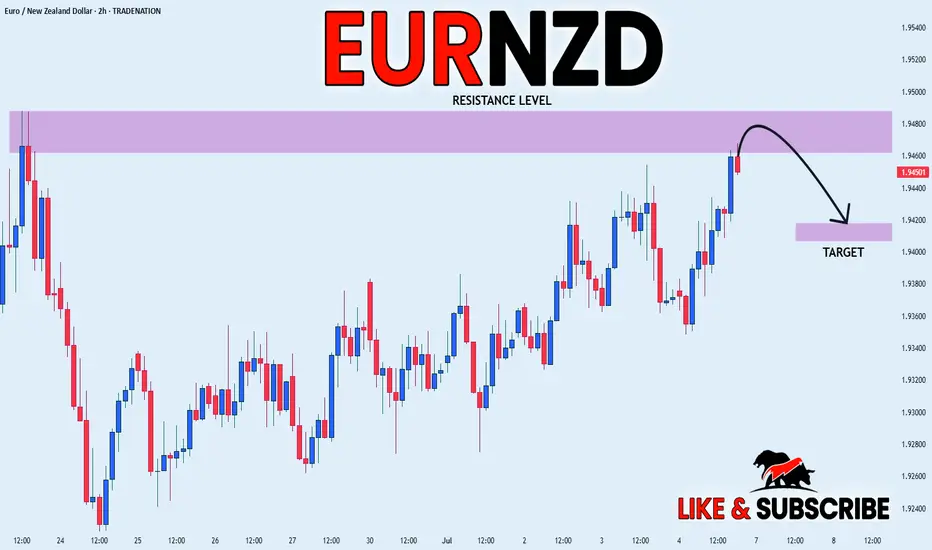
EUR_NZD LOCAL SHORT|
✅EUR_NZD is set to retest a
Strong resistance level above at 1.9488
After trading in a local uptrend for some time
Which makes a bearish pullback a likely scenario
With the target being a local support below at 1.9420
SHORT🔥
✅Like and subscribe to never miss a new idea!✅
Disclosure: I am part of Trade Nation's Influencer program and receive a monthly fee for using their TradingView charts in my analysis.
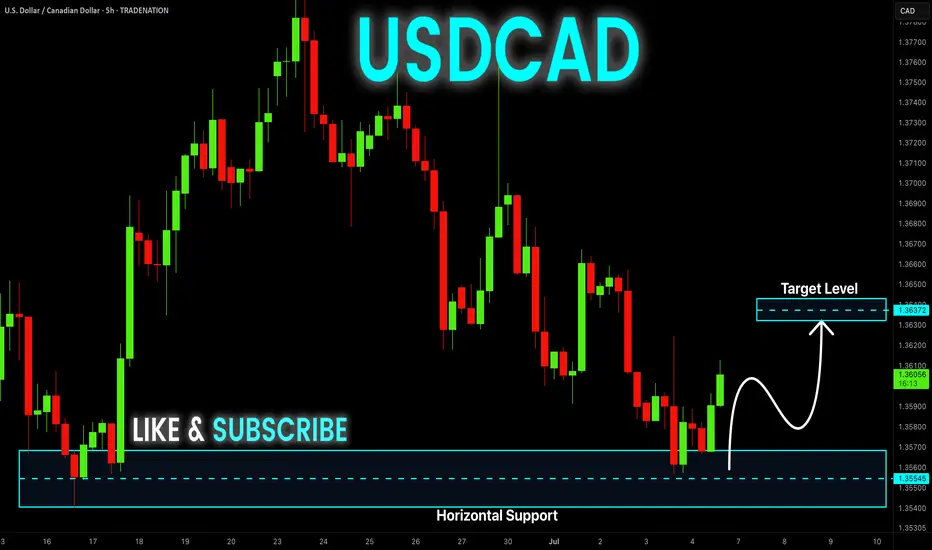
USD-CAD Local Rebound! Buy!
Hello,Traders!
USD-CAD is trading in a
Strong downtrend but
The pair made a retest
Of the horizontal support
Level of 1.3540 from where
We are already seeing a
Bullish rebound and we
Will be expecting a
Further move up
Buy!
Comment and subscribe to help us grow!
Check out other forecasts below too!
Disclosure: I am part of Trade Nation's Influencer program and receive a monthly fee for using their TradingView charts in my analysis.
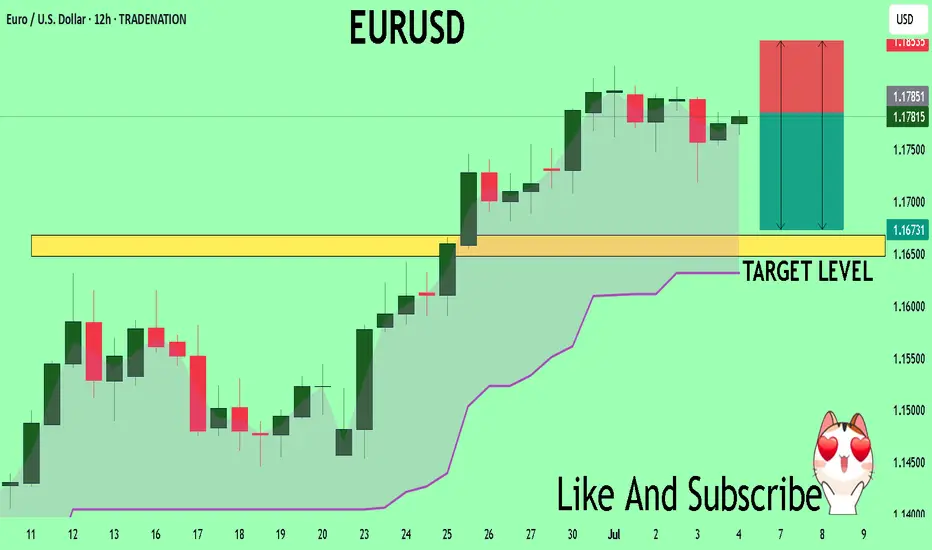
EURUSD A Fall Expected! SELL!
My dear subscribers,
My technical analysis for EURUSD is below:
The price is coiling around a solid key level - 1.1784
Bias - Bearish
Technical Indicators: Pivot Points High anticipates a potential price reversal.
Super trend shows a clear sell, giving a perfect indicators' convergence.
Goal - 1.1667
My Stop Loss - 1.1853
About Used Indicators:
By the very nature of the supertrend indicator, it offers firm support and resistance levels for traders to enter and exit trades. Additionally, it also provides signals for setting stop losses
Disclosure: I am part of Trade Nation's Influencer program and receive a monthly fee for using their TradingView charts in my analysis.
———————————
WISH YOU ALL LUCK
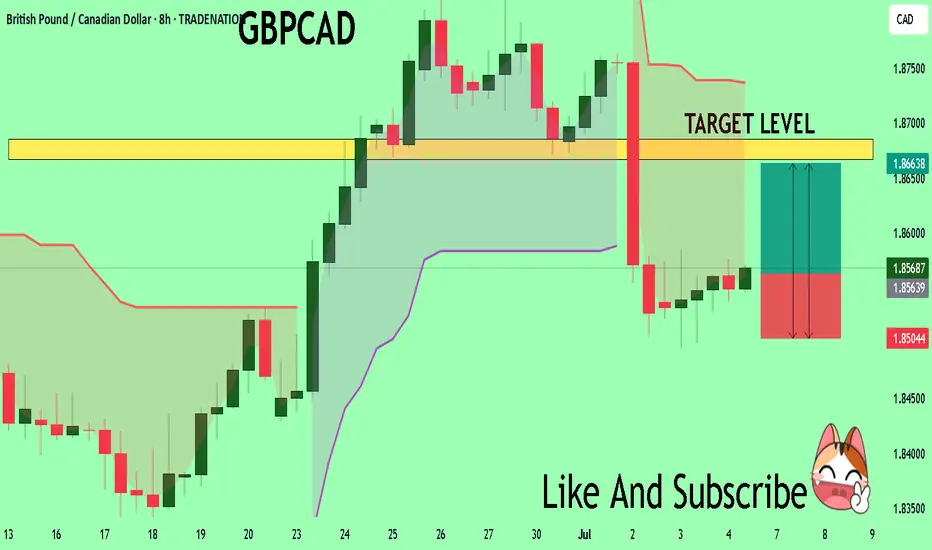
GBPCAD Will Explode! BUY!
My dear followers,
I analysed this chart on GBPCAD and concluded the following:
The market is trading on 1.8563 pivot level.
Bias - Bullish
Technical Indicators: Both Super Trend & Pivot HL indicate a highly probable Bullish continuation.
Target - 1.8667
Safe Stop Loss - 1.8504
About Used Indicators:
A super-trend indicator is plotted on either above or below the closing price to signal a buy or sell. The indicator changes color, based on whether or not you should be buying. If the super-trend indicator moves below the closing price, the indicator turns green, and it signals an entry point or points to buy.
Disclosure: I am part of Trade Nation's Influencer program and receive a monthly fee for using their TradingView charts in my analysis.
———————————
WISH YOU ALL LUCK
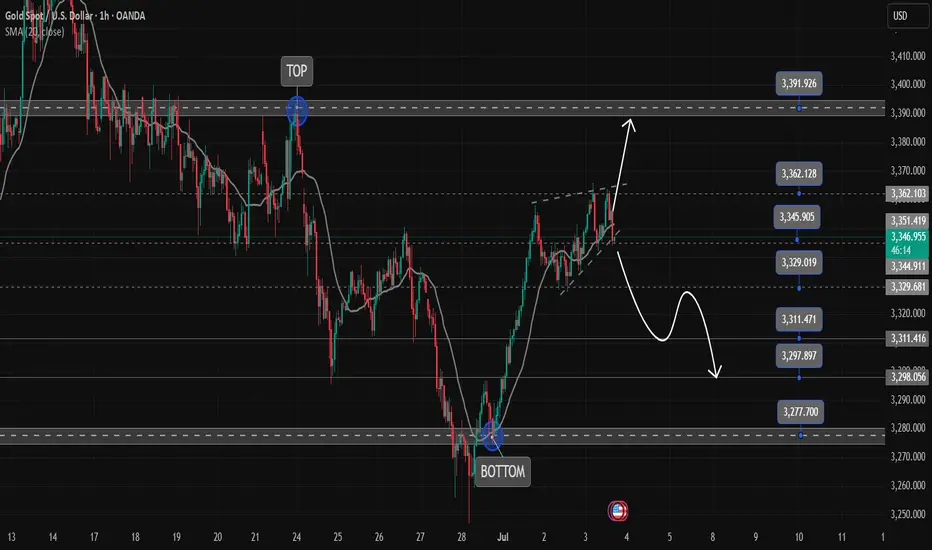
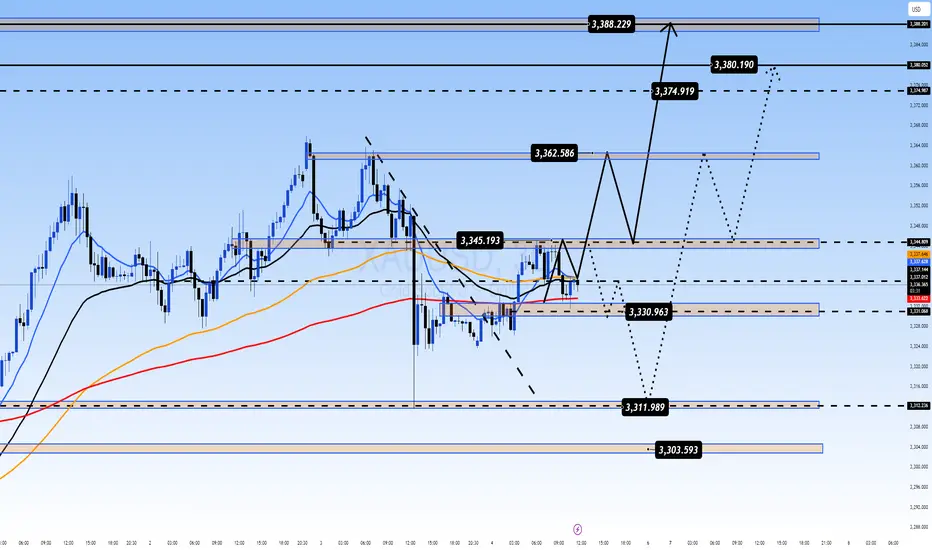
Gold Trading Strategy July 3✏️D1 candle continues to increase towards the price gap zone. At the beginning of the European session, sellers accept to enter the market at this resistance price zone around 3365. The accumulation pattern of gold price is forming a triangle pattern.
The lower boundary is broken, it will lead to the breakout point of the lower boundary and vice versa, if the upper boundary of the triangle is broken, the price will move towards the next resistance.
📉 Key Levels
Resistance: 3388-3363
Support: 3330-3311-3297-3277
Buy trigger: breakout above 3363
Sell trigger: breakout below 3330
If this idea resonates with you or you have other ideas, please comment. I look forward to reading your thoughts!
Best regards, VHT Traders!
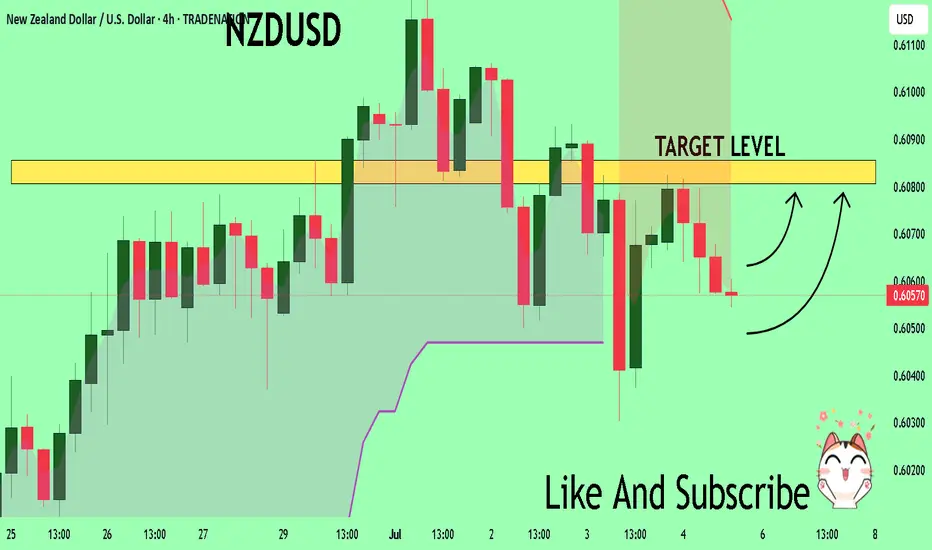
NZDUSD The Target Is UP! BUY!
My dear subscribers,
This is my opinion on the NZDUSD next move:
The instrument tests an important psychological level 0.6056
Bias - Bullish
Technical Indicators: Supper Trend gives a precise Bullish signal, while Pivot Point HL predicts price changes and potential reversals in the market.
Target - 0.6080
About Used Indicators:
On the subsequent day, trading above the pivot point is thought to indicate ongoing bullish sentiment, while trading below the pivot point indicates bearish sentiment.
Disclosure: I am part of Trade Nation's Influencer program and receive a monthly fee for using their TradingView charts in my analysis.
———————————
WISH YOU ALL LUCK
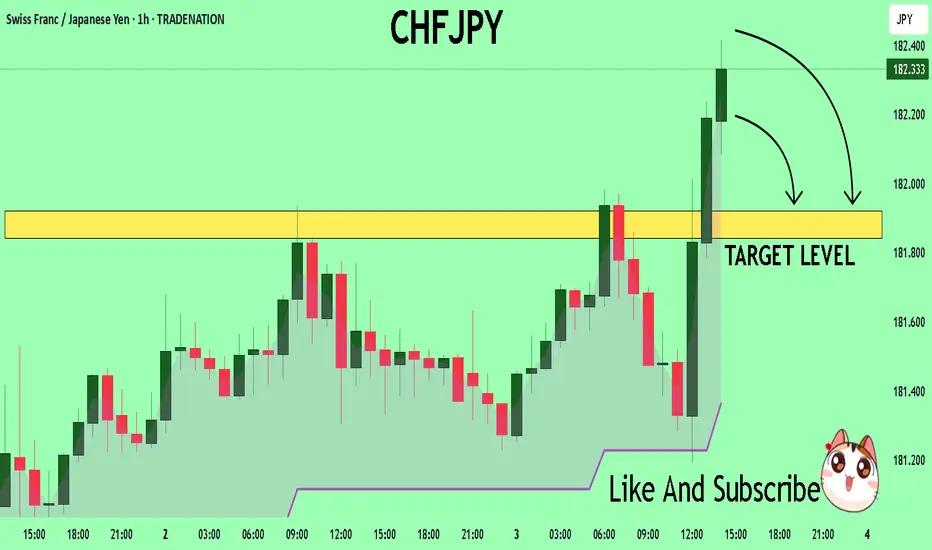
CHFJPY Set To Fall! SELL!
My dear subscribers,
CHFJPY looks like it will make a good move, and here are the details:
The market is trading on 182.35 pivot level.
Bias - Bearish
Technical Indicators: Both Super Trend & Pivot HL indicate a highly probable Bearish continuation.
Target - 181.92
About Used Indicators:
The average true range (ATR) plays an important role in 'Supertrend' as the indicator uses ATR to calculate its value. The ATR indicator signals the degree of price volatility.
Disclosure: I am part of Trade Nation's Influencer program and receive a monthly fee for using their TradingView charts in my analysis.
———————————
WISH YOU ALL LUCK
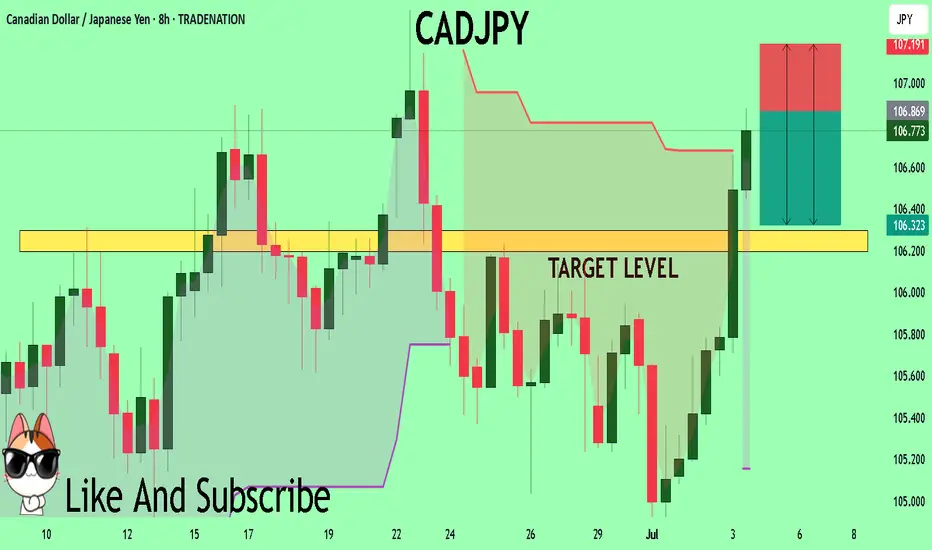
CADJPY Trading Opportunity! SELL!
My dear friends,
CADJPY looks like it will make a good move, and here are the details:
The market is trading on 106.86 pivot level.
Bias - Bearish
Technical Indicators: Supper Trend generates a clear short signal while Pivot Point HL is currently determining the overall Bearish trend of the market.
Goal - 106.29
Recommended Stop Loss - 107.19
About Used Indicators:
Pivot points are a great way to identify areas of support and resistance, but they work best when combined with other kinds of technical analysis
Disclosure: I am part of Trade Nation's Influencer program and receive a monthly fee for using their TradingView charts in my analysis.
———————————
WISH YOU ALL LUCK
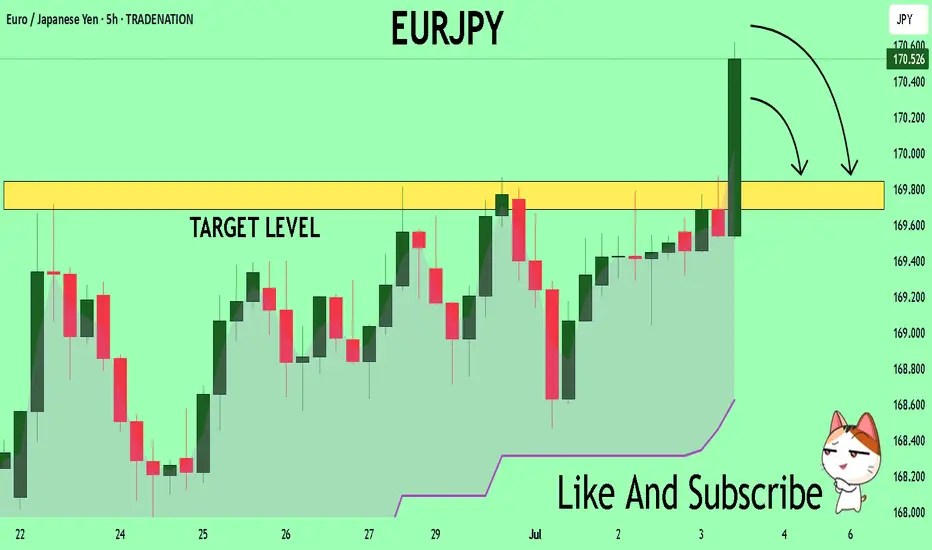
EURJPY What Next? SELL!
My dear friends,
My technical analysis for EURJPY is below:
The market is trading on 170.54 pivot level.
Bias - Bearish
Technical Indicators: Both Super Trend & Pivot HL indicate a highly probable Bearish continuation.
Target - 169.84
About Used Indicators:
A pivot point is a technical analysis indicator, or calculations, used to determine the overall trend of the market over different time frames.
Disclosure: I am part of Trade Nation's Influencer program and receive a monthly fee for using their TradingView charts in my analysis.
———————————
WISH YOU ALL LUCK
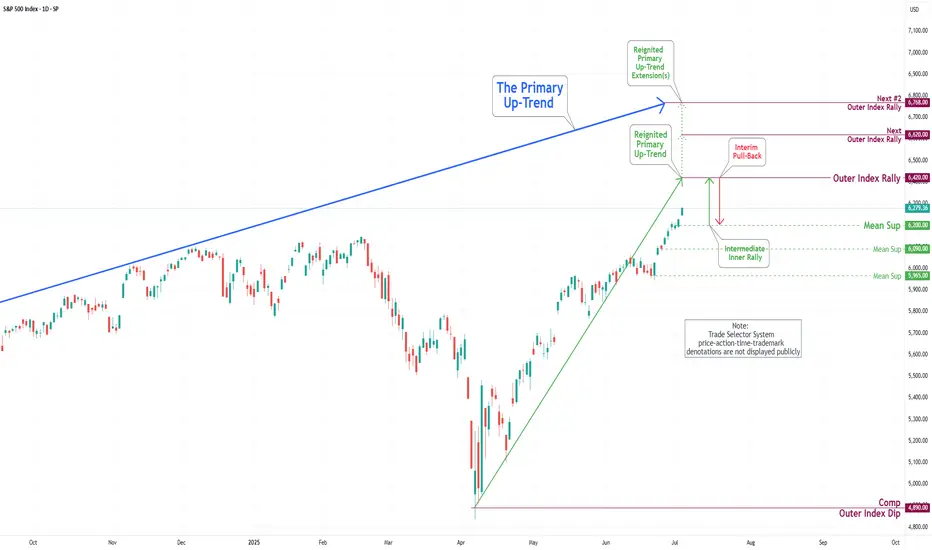
S&P 500 Daily Chart Analysis For Week of July 3, 2025Technical Analysis and Outlook:
During this abbreviated trading week, the S&P 500 Index has primarily shown an upward course, hitting and surpassing our target for the Outer Index Rally of 6235. Currently, the index demonstrates a consistent bullish trend, with the following objective for the Outer Index Rally set at 6420, followed by forthcoming targets of 6620 and 6768. Nevertheless, it is crucial to acknowledge the current price action may cause prices to retrace from their current fluctuation to test the Mean Support at 6200 before resuming their upward movement.
Gold Consolidating Ahead of Next Move Gold Consolidating Ahead of Next Move – Is 3390 the Bull Target or a False Breakout Trap?
🧭 Fundamental Outlook
Gold has entered a tight consolidation phase following a wave of high-impact macroeconomic events:
The US House of Representatives has passed Trump's “Super Bill”, raising expectations of increased fiscal spending and long-term inflationary pressures. In theory, this is supportive of gold prices.
However, strong NFP and Unemployment Rate figures released recently have reinforced dollar strength in the short term, suggesting the Fed may delay rate cuts → a temporary headwind for gold.
With Independence Day in the US, liquidity across global markets is expected to drop, increasing the risk of false moves or stop-hunt volatility.
🟡 The lack of immediate upside doesn’t mean bullish momentum has disappeared. Price may simply be building energy before its next leg.
📉 Technical Overview – XAU/USD
Gold has broken out of a minor descending trendline and is now testing a key supply zone around 3344–3345, which could determine the intraday trajectory.
🔍 Key Levels
Resistance Zones: 3345 – 3362 – 3374 – 3388 – 3390
Support Zones: 3330 – 3312 – 3304 – 3302 – 3298
🟢 Bullish Scenarios (Buy Setups)
📍 Intraday Buy Zone:
3313 – 3311
Stop Loss: 3307
Take Profit: 3316 – 3320 – 3325 – 3330 – 3335 – 3340 – 3345 – 3350
📍 Deep Pullback Buy Zone:
3304 – 3302
Stop Loss: 3298
Take Profit: 3308 – 3312 – 3316 – 3320 – 3330 – 3340
These zones are ideal for trend-continuation entries, especially if supported by bullish candles or price action on lower timeframes.
🔴 Bearish Scenarios (Short-Term Only)
📍 Intraday Sell Zone:
3362 – 3364
Stop Loss: 3368
Take Profit: 3358 – 3354 – 3350 – 3346 – 3340 – 3335 – 3330
📍 High-Risk Sell Zone:
3388 – 3390
Stop Loss: 3394
Take Profit: 3384 – 3380 – 3376 – 3370 – 3365 – 3360
Bearish positions should be reserved for signs of exhaustion or rejection patterns at resistance levels.
🧠 Trading Bias for Today
With limited liquidity due to the US holiday, price may remain trapped in a sideways range between 3320 and 3340. Traders should stay nimble and avoid overexposure.
✅ Primary bias: Buy dips near major support
⚠️ Alternative view: Only short if price confirms reversal at resistance
💬 What’s Your Take on Gold Today?
Will gold break through the 3390 barrier this week?
Or are we looking at one more dip before a true bullish continuation?
👇 Share your thoughts and trading ideas in the comments!
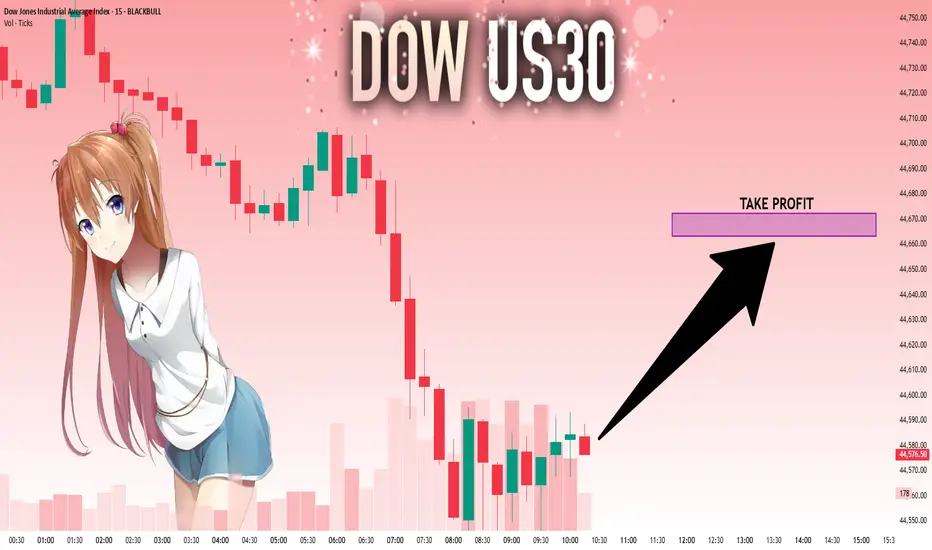
US30: Will Go Up! Long!
My dear friends,
Today we will analyse US30 together☺️
The market is at an inflection zone and price has now reached an area around 44,585.50 where previous reversals or breakouts have occurred.And a price reaction that we are seeing on multiple timeframes here could signal the next move up so we can enter on confirmation, and target the next key level of 44,663.28.Stop-loss is recommended beyond the inflection zone.
❤️Sending you lots of Love and Hugs❤️
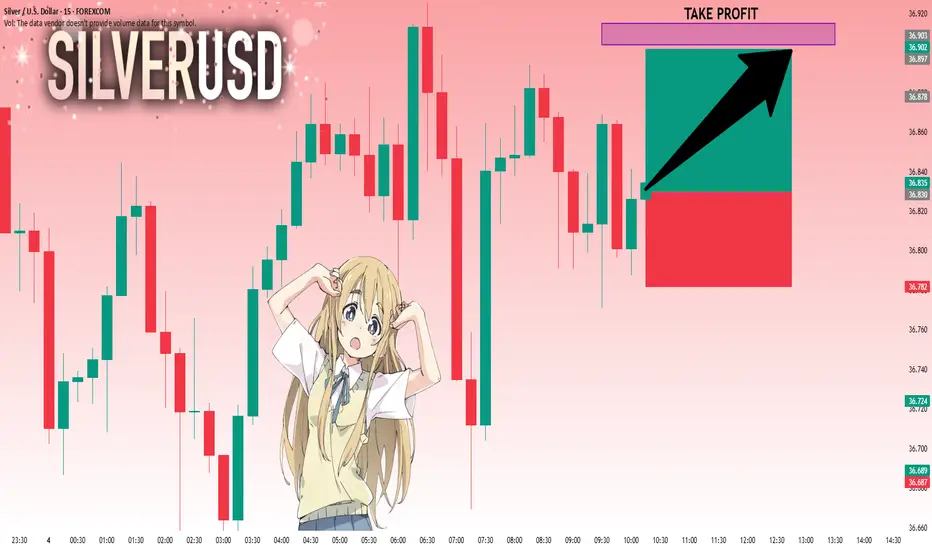
SILVER: The Market Is Looking Up! Long!
My dear friends,
Today we will analyse SILVER together☺️
The price is near a wide key level
and the pair is approaching a significant decision level of 36.830 Therefore, a strong bullish reaction here could determine the next move up.We will watch for a confirmation candle, and then target the next key level 36.903.Recommend Stop-loss is beyond the current level.
❤️Sending you lots of Love and Hugs❤️
EURUSD: Strong Bearish Sentiment! Short!
My dear friends,
Today we will analyse EURUSD together☺️
The recent price action suggests a shift in mid-term momentum. A break below the current local range around 1.17775 will confirm the new direction downwards with the target being the next key level of 1.17696.and a reconvened placement of a stop-loss beyond the range.
❤️Sending you lots of Love and Hugs❤️

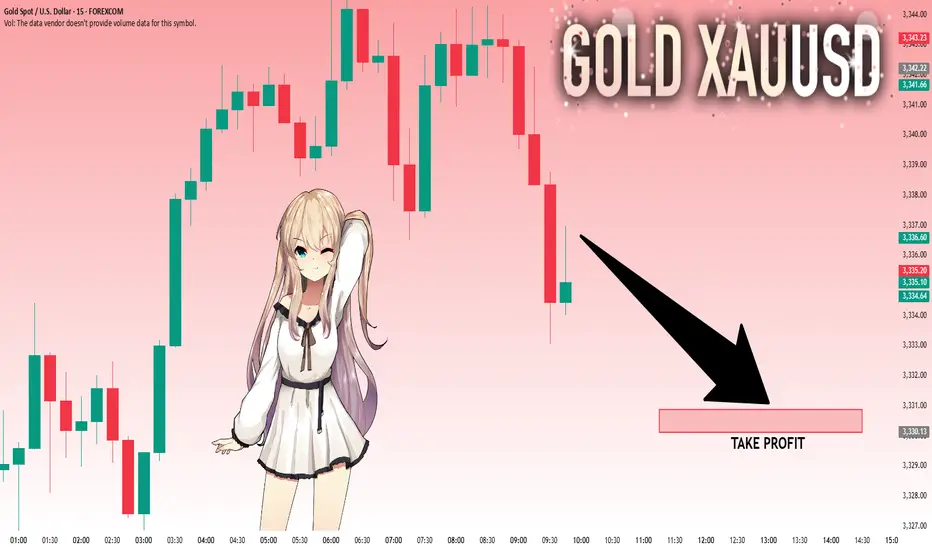
GOLD: Bears Are Winning! Short!
My dear friends,
Today we will analyse GOLD together☺️
The in-trend continuation seems likely as the current long-term trend appears to be strong, and price is holding below a key level of 3,336.61 So a bearish continuation seems plausible, targeting the next low. We should enter on confirmation, and place a stop-loss beyond the recent swing level.
❤️Sending you lots of Love and Hugs❤️
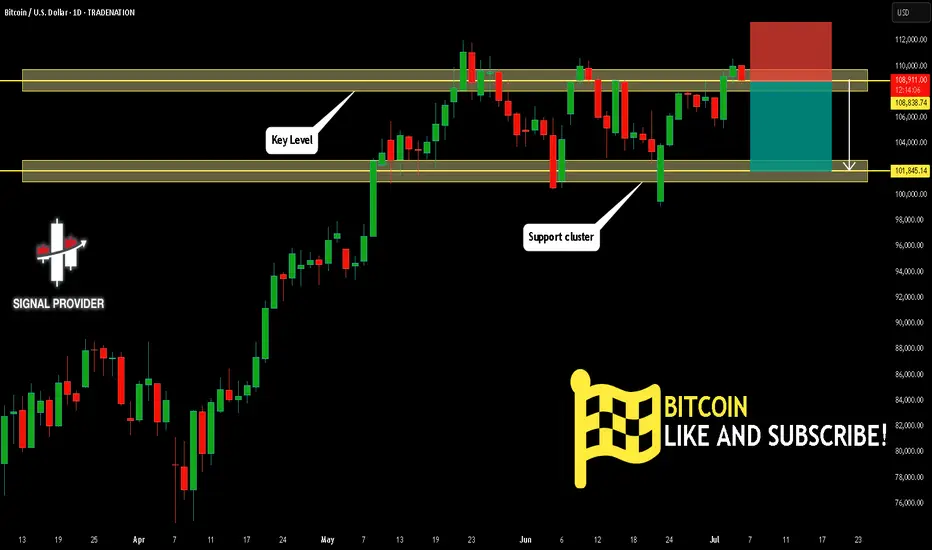
BITCOIN Will Fall! Sell!
Please, check our technical outlook for BITCOIN.
Time Frame: 1D
Current Trend: Bearish
Sentiment: Overbought (based on 7-period RSI)
Forecast: Bearish
The price is testing a key resistance 108,838.74.
Taking into consideration the current market trend & overbought RSI, chances will be high to see a bearish movement to the downside at least to 101,845.14 level.
P.S
The term oversold refers to a condition where an asset has traded lower in price and has the potential for a price bounce.
Overbought refers to market scenarios where the instrument is traded considerably higher than its fair value. Overvaluation is caused by market sentiments when there is positive news.
Disclosure: I am part of Trade Nation's Influencer program and receive a monthly fee for using their TradingView charts in my analysis.
Like and subscribe and comment my ideas if you enjoy them!