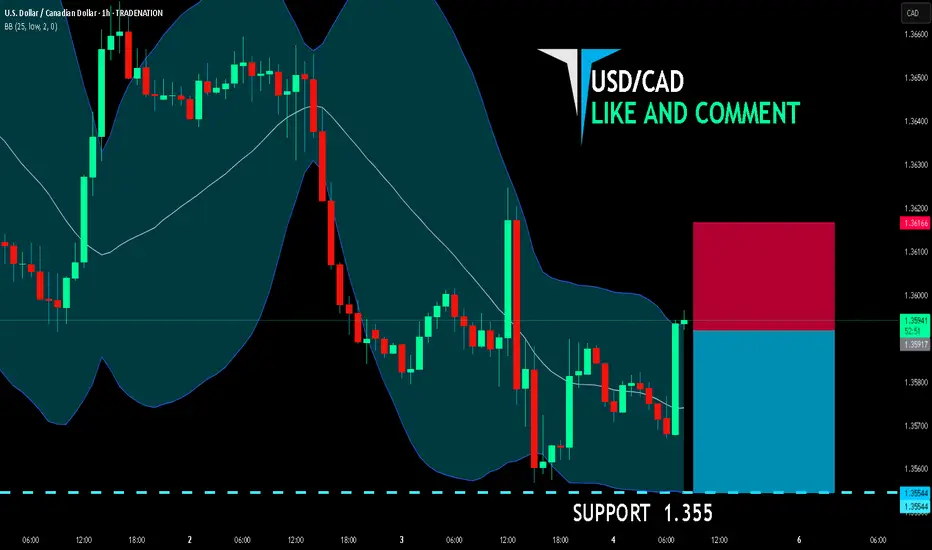
USD/CAD SHORT FROM RESISTANCE
USD/CAD SIGNAL
Trade Direction: short
Entry Level: 1.359
Target Level: 1.355
Stop Loss: 1.361
RISK PROFILE
Risk level: medium
Suggested risk: 1%
Timeframe: 1h
Disclosure: I am part of Trade Nation's Influencer program and receive a monthly fee for using their TradingView charts in my analysis.
✅LIKE AND COMMENT MY IDEAS✅
Trading
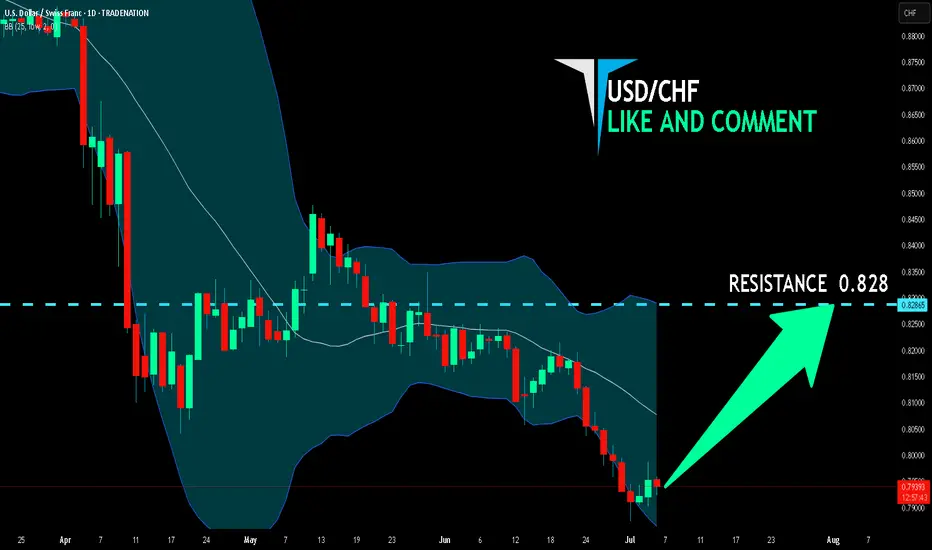
USD/CHF BULLS WILL DOMINATE THE MARKET|LONG
Hello, Friends!
Bullish trend on USD/CHF, defined by the green colour of the last week candle combined with the fact the pair is oversold based on the BB lower band proximity, makes me expect a bullish rebound from the support line below and a retest of the local target above at 0.828.
Disclosure: I am part of Trade Nation's Influencer program and receive a monthly fee for using their TradingView charts in my analysis.
✅LIKE AND COMMENT MY IDEAS✅
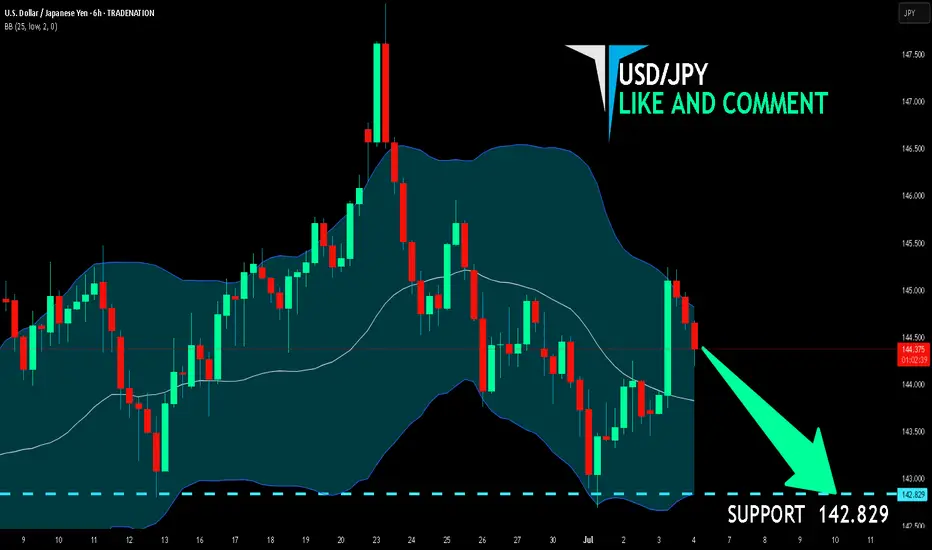
USD/JPY SENDS CLEAR BEARISH SIGNALS|SHORT
Hello, Friends!
USD-JPY uptrend evident from the last 1W green candle makes short trades more risky, but the current set-up targeting 142.829 area still presents a good opportunity for us to sell the pair because the resistance line is nearby and the BB upper band is close which indicates the overbought state of the USD/JPY pair.
Disclosure: I am part of Trade Nation's Influencer program and receive a monthly fee for using their TradingView charts in my analysis.
✅LIKE AND COMMENT MY IDEAS✅
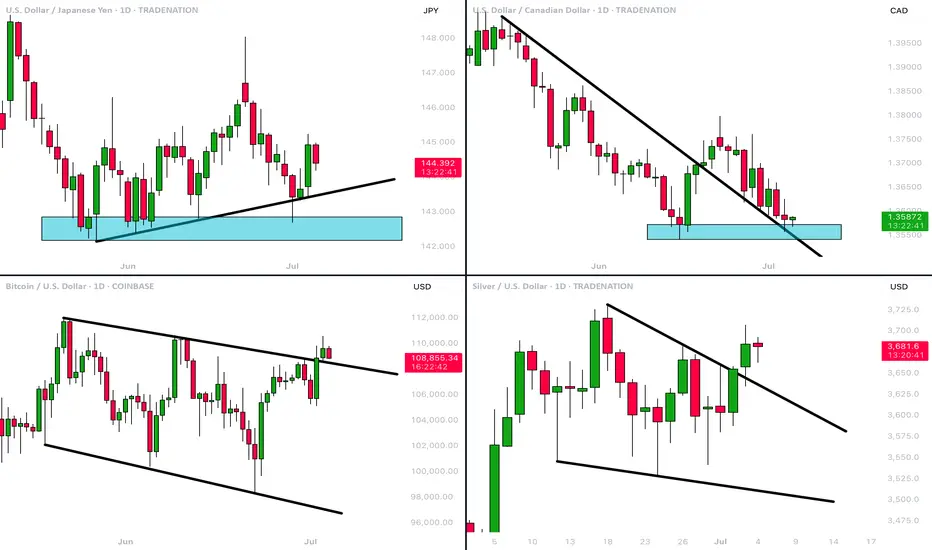
MarketBreakdown | USDJPY, USDCAD, BITCOIN, SILVER
Here are the updates & outlook for multiple instruments in my watch list.
1️⃣ #USDJPY daily time frame 🇺🇸🇯🇵
The market nicely respected a rising trend line
and bounced from that, forming a high momentum bullish candle.
I think that the pair will continue rising and reach 145.8 level soon.
2️⃣ #USDCAD daily time frame 🇺🇸🇨🇦
The price is currently approaching an important confluence
zone based on a falling trend line and a horizontal support.
I will expect a pullback from that.
3️⃣ #BITCOIN #BTCUSD daily time frame
The price successfully violated a resistance line of a bullish
flag pattern and closed above that.
It is a critical bullish signal. I believe that the price will test
a current high then and will violate that with a high probability.
4️⃣ #SILVER #XAGUSD daily time frame 🪙
The market broke a resistance line of a bullish flag.
Uptrend is going to continue, and the price is going to reach 37,14 level soon.
Do you agree with my market breakdown?
❤️Please, support my work with like, thank you!❤️
I am part of Trade Nation's Influencer program and receive a monthly fee for using their TradingView charts in my analysis.
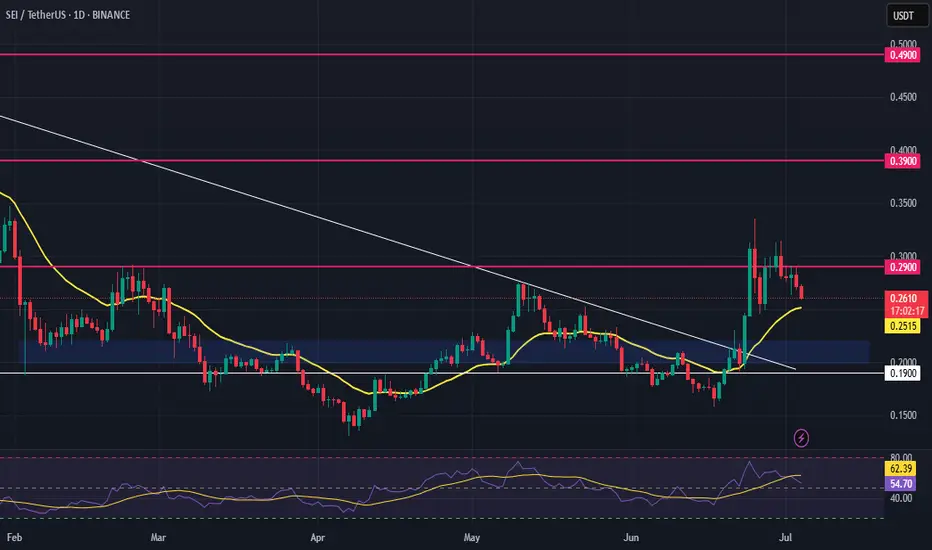
SEI Long – Breakout with Relative Strength & Trend ContinuationSEI is showing strong relative strength and has just broken out of recent structure. We’re watching for a higher low to form above the $0.22 zone, confirming trend continuation and unlocking upside liquidity.
📌 Trade Setup:
• Entry Zone: Around $0.22
• Take Profit Targets:
o 🥇 $0.29
o 🥈 $0.39
o 🥉 $0.49
• Stop Loss: Daily close below $0.19
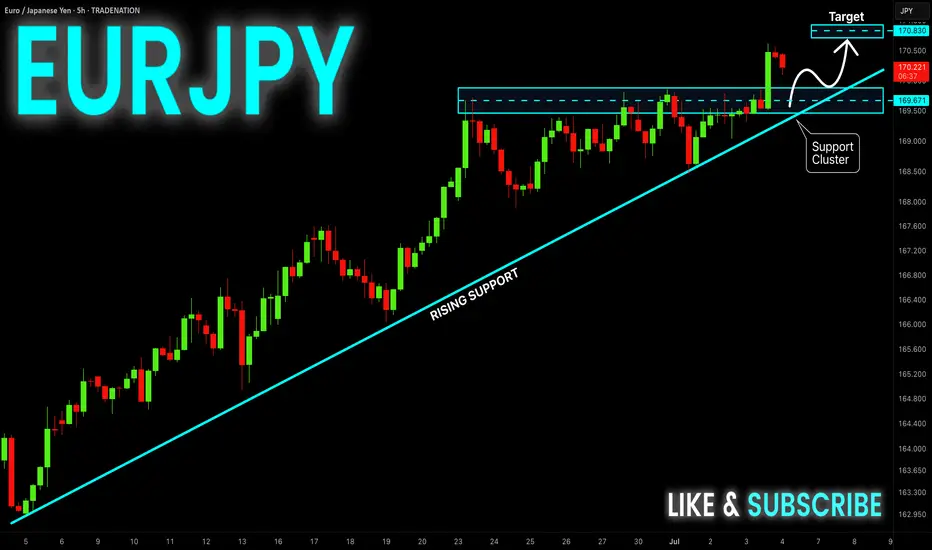
EUR-JPY Will Keep Growing! Buy!
Hello,Traders!
EUR-JPY is trading in an
Uptrend and the pair broke
The key horizontal level
Of 169.814 and the breakout
Is confirmed so after a potential
Retest of the support cluster
Of the rising and horizontal
Support lines below we will
Be expecting a bullish continuation
Buy!
Comment and subscribe to help us grow!
Check out other forecasts below too!
Disclosure: I am part of Trade Nation's Influencer program and receive a monthly fee for using their TradingView charts in my analysis.
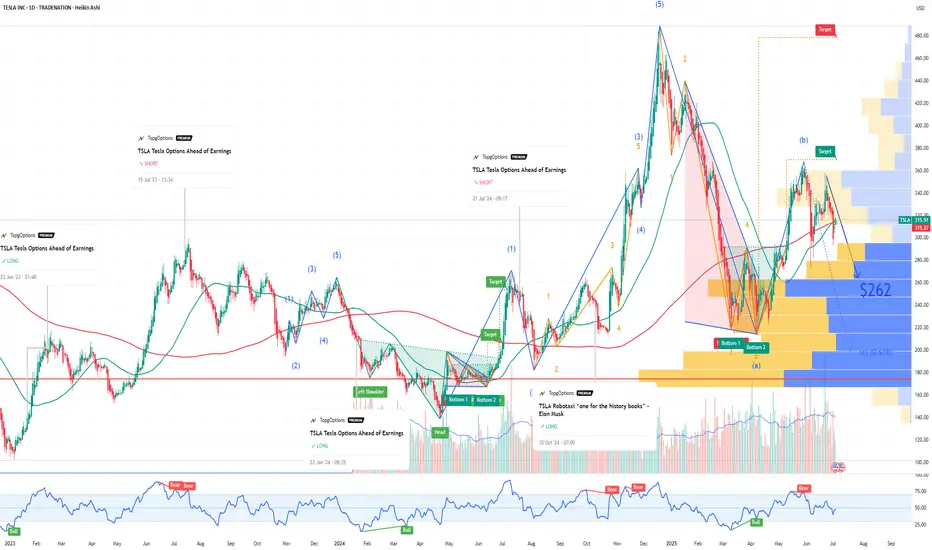
TSLA bearish: Musk vs Trump! Subsidy Spotlight & Sentiment RisksIf you haven`t bought TSLA before the recent breakout:
Now you need to know that Tesla (TSLA) is sitting around $315, but the vibe is getting shakier. Elon Musk’s feud with Donald Trump — complete with jokes about “putting the DOGE on him” if deported — might feel like another meme moment, but it spotlights Tesla’s huge dependency on federal and state support.
Estimates show Tesla could face up to $48 billion in lost government contracts and incentives over the next decade if the political tide turns. With Trump’s base calling out “green subsidies” as wasteful, Tesla’s funding pipeline could get squeezed — just as competition ramps up and margins get tighter.
Key Bearish Points
1) Political Risk Is Real
Musk’s public fight with Trump is a double-edged sword: he risks losing goodwill on both sides of the aisle. If the next administration decides to gut EV credits, Tesla could take a huge hit — far more than its rivals who rely less on U.S. incentives.
2) Subsidy Dependence
Tesla’s success is partly built on a foundation of tax credits, carbon credits, and favorable policies. $48B in potential lost value is nothing to shrug off — especially when competitors like BYD are gaining ground.
3) Bearish Technical Setup
TSLA’s chart is rolling over inside a bearish channel. It recently failed to hold the $330 level and now sits around $315. A clean breakdown below $300 could open the door to your target zone at $262 — a major support area from earlier this year.
Catalysts:
Any new comments from Trump’s camp about EV subsidies
Weak delivery/margin numbers from Tesla
Broader tech/equity pullback
Musk’s crypto distractions no longer propping up sentiment
Disclosure: I am part of Trade Nation's Influencer program and receive a monthly fee for using their TradingView charts in my analysis.
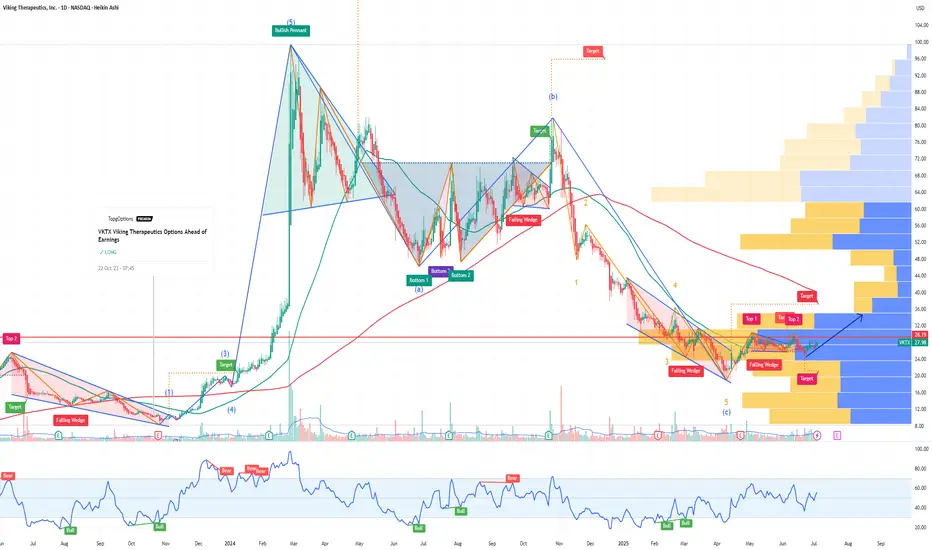
VKTX: Unusual Options Flow & a Breakthrough Weight-Loss DrugIf you haven`t bought CKTX before the recent rally:
Now you need to know that Viking Therapeutics (VKTX) is a speculative biotech stock in the GLP-1/GIP agonist space, aiming to challenge market leaders like Eli Lilly and Novo Nordisk. Recently, I noticed unusual options flow — specifically, Jan 16, 2026 $60 strike calls
Key Bullish Points
1) Riding the Obesity Drug Boom
VK2735 is Viking’s dual agonist candidate showing promising early weight-loss efficacy, with potential overlap benefits in NASH (liver disease). The obesity treatment space is expected to exceed $100B by 2030—huge upside if their trials continue positively.
2) Options Flow Tells a Story
Those Jan 2026 $60 calls caught my attention precisely because the stock currently trades in the mid-$60s. These aren’t cheap lottery plays—they’re strategically timed wrt trial readouts, partnerships, or acquisition interest. Essentially, someone anticipates meaningful upside in the near future.
3) Descending Wedge — Chart Looks Bullish
VKTX peaked near $100, then pulled back into a well-defined descending wedge. If it breaks out above $70–$72 with volume, that could kick off a classic reversal trade.
Smart Money Options Flow — Near-Term Bet:
Recently, I spotted unusual open interest in $60 strike calls expiring Jan 16, 2026 — that’s only about 7 months away.
This means someone is positioning for a big upside move relatively soon, likely betting on positive Phase 2b/3 data, a partnership deal, or even buyout chatter within the next few quarters.
Short-dated, out-of-the-money call flow like this often hints at near-term news — not just a long-dated hedge.
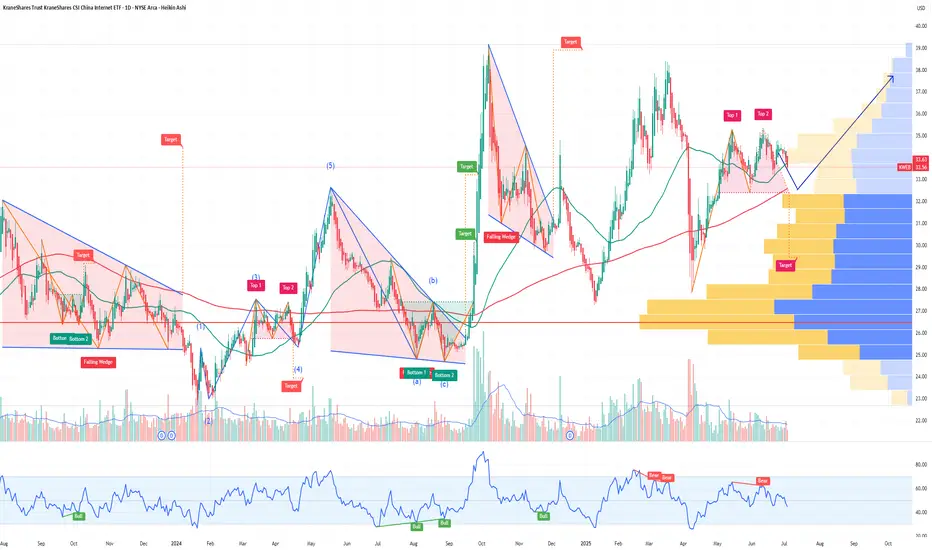
KWEB: China’s Internet Sector - AI Catch-Up and Cheap ValuationsChina’s internet and tech stocks have been hammered for years — regulatory crackdowns, slowing growth fears, and geopolitical tension have crushed sentiment. But as investors know, the best opportunities often hide in what everyone hates.
Enter KWEB, the KraneShares CSI China Internet ETF.
It’s a diversified, liquid way to play a bounce in major names like Alibaba, Tencent, JD .com, Baidu, Meituan and PDD.
Here’s why I think the risk/reward looks compelling now — especially if you believe in AI closing the gap.
Key Bullish Points:
1) Valuations at Rock-Bottom
Many big China internet stocks are still trading at single-digit P/E ratios, even as their cash flows recover. Compared to U.S. big tech trading at 30–50x, this is a huge valuation gap.
Regulatory fears seem largely priced in — Beijing wants growth, not stagnation, and some policies are easing.
2) China’s AI Push — Just “Months Behind”
Jansen Whang recently argued that China’s generative AI development is only “months behind” the U.S. Players like Baidu, Alibaba Cloud, Tencent, and SenseTime are all racing to launch new LLMs and integrated AI tools.
If you believe the gap closes, Chinese platforms could see a major earnings rebound as they roll out AI upgrades across search, cloud, e-commerce and social media.
3) Sentiment So Bad, It’s Good
When the headlines scream “China is uninvestable,” that’s often when big mean reversion trades set up. Even a small policy pivot, stimulus plan, or positive AI news cycle can spark a sharp rally.
KWEB is one of the cleanest ways to express this view because it holds a diversified basket — you don’t have to pick a single winner.
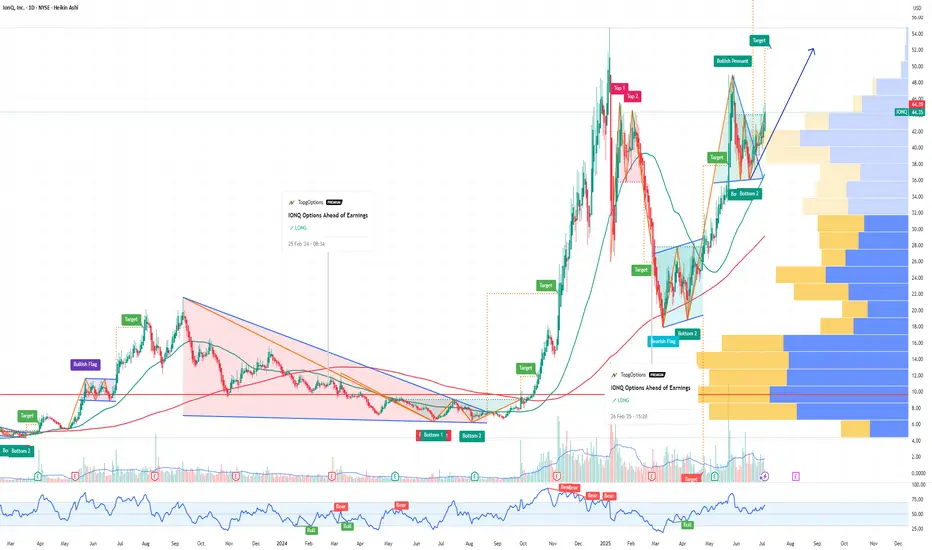
Why IonQ (IONQ) Could Be the NVDA of Quantum ComputingIf you haven`t bought IONQ before the rally:
Now you need to know that IonQ isn’t just another speculative quantum stock — The company is building a robust ecosystem around its best‑in‑class trapped‑ion architecture and targeting fault‑tolerant, networked quantum systems. With record bookings, major acquisitions, and a strong balance sheet, IonQ could emerge as the NVIDIA equivalent for quantum infrastructure.
Key Bullish Arguments
1) Superior Quantum Tech – Trapped‑Ion Advantage
IonQ’s trapped-ion processors boast 99.9% two-qubit fidelity, demonstrating higher accuracy and scalability than superconducting alternatives
These systems also operate at room temperature, meaning simpler deployment and lower costs
2) Ecosystem Strategy & Acquisitions
The $1.08B acquisition of Oxford Ionics (expected close in 2025) expands IonQ’s qubit control tech, pushing toward planned 80,000 logical‑qubit systems by decade’s end
Combined with ID Quantique and Lightsynq, IonQ is building a full-stack quantum and networking offering
3) Strong Revenue Growth & Cash Runway
Revenue soared from $22M in 2023 to $43.1M in 2024, with bookings of $95.6M
. Q1 2025 saw $7.6M revenue and EPS –$0.14, beating expectations; cash reserves near $697M provide years of runway
4) Real Commercial Deployments
IonQ sold its Forte Enterprise quantum system to EPB ($22M deal) for hybrid compute and networking, marking real-world commercial applications
5) AI & Quantum Synergy
Involvement in NVIDIA’s Quantum Day and hybrid quantum‑classical AI demos (e.g., blood pump simulation with Ansys, ~12 % faster) indicates strategic synergy and positions IonQ as a critical piece in the future AI stack
Recent Catalysts:
Texas Quantum Initiative passes – positions IonQ at forefront of U.S. state-backed innovation
Oxford Ionics acquisition pending – major expansion in qubit scale & tech
Barron’s analyst buys – industry analysts see long-term potential; IonQ among top quantum picks
Broader quantum optimism – McKinsey & Morgan Stanley forecasts highlight synergy between quantum and AI, benefiting IonQ
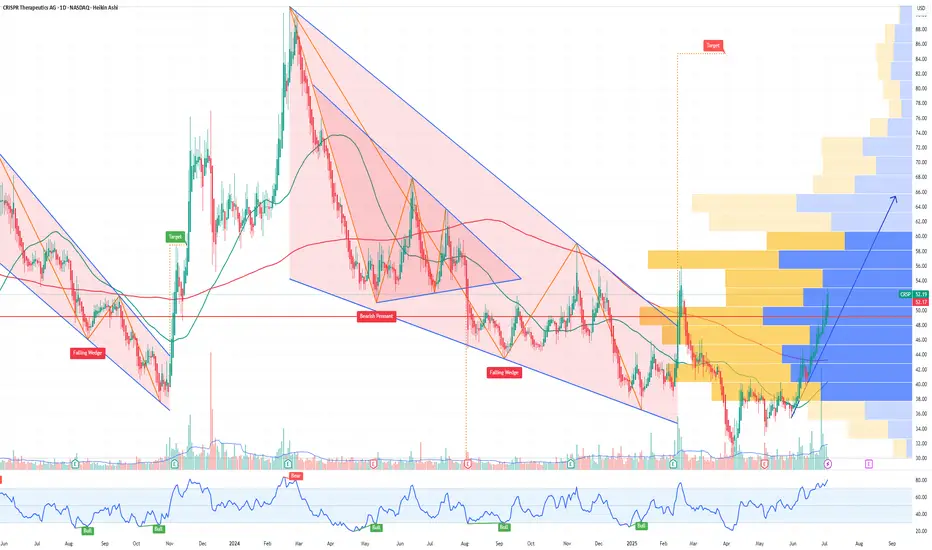
CRSP Could Crack the Holy Grails of Medicine: Cancer & AlzheimerWhen Tesla (TSLA) started, few believed a scrappy EV startup could transform the entire auto industry and ignite a green energy revolution. But it did.
Today, CRISPR Therapeutics (NASDAQ: CRSP) is quietly doing something similar for medicine — and if you squint, its upside might be even bigger than Tesla’s.
Gene Editing: The Next Industrial Revolution — For Your Cells
CRISPR/Cas9 gene editing is like biological software. It gives scientists the power to cut, delete, or rewrite genes — the source code of life — with surgical precision.
CRISPR Therapeutics was co-founded by Dr. Emmanuelle Charpentier, a Nobel Prize winner who helped pioneer this breakthrough. The company’s lead therapy, exa-cel — just FDA approved in the U.S. — is the first-ever CRISPR-based gene-editing treatment to hit the market.
First up: curing devastating blood disorders like sickle cell disease and beta-thalassemia — a $10 billion+ opportunity. But that’s only the start.
Aging: The Ultimate Disease
What if we treated aging itself as a disease?
Many scientists now argue that growing old is the result of accumulated genetic errors, cellular damage, and mutations — processes that can be slowed or even reversed.
Gene editing holds the promise to repair DNA damage, reprogram cells, and treat the root causes of age-related decline. If successful, it could extend healthy human lifespan by decades.
Think about that: Tesla made cars last longer and burn cleaner. CRSP could make you last longer and live healthier.
The Two Holy Grails: Cancer and Alzheimer’s
Beyond blood disorders, CRISPR Therapeutics is working on a pipeline targeting solid tumors, diabetes, and more. But the real game-changers are cancer and Alzheimer’s disease — the twin mountains every biotech company dreams of conquering.
With gene editing, we could one day rewrite the genetic mutations that fuel cancer growth or remove the faulty proteins that clog the brain in Alzheimer’s. These are trillion-dollar problems — and the company that cracks them will reshape human history.
Built for Scale — Like Tesla
CRSP isn’t going at it alone. Partnerships with Vertex, Bayer, and ViaCyte help spread risk and amplify impact. With over $2 billion in cash, it has the runway to execute — just as Tesla used capital to build factories and charging networks at scale.
The market still underestimates that this is a platform company — not a single-drug biotech. If Tesla went from cars to batteries, solar, and AI, CRSP could go from blood disorders to rewriting the code for life itself.
Bottom Line
Aging. Cancer. Alzheimer’s. These are the holy grails of medicine.
If you missed Tesla at $20 a share, CRISPR Therapeutics could be your second chance — the TSLA of Gene Editing.
Because the greatest disruption of all is not electric cars. It’s the chance that, one day, growing old will be optional.
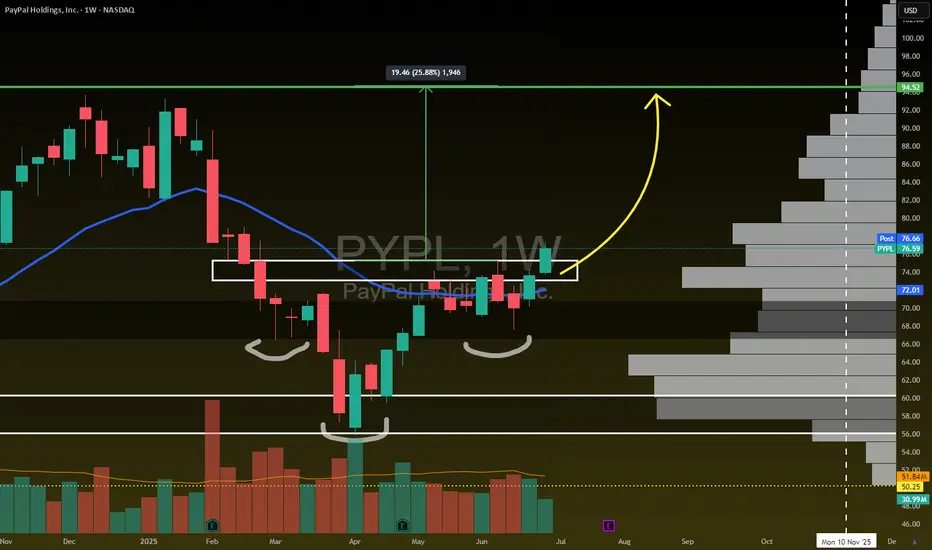
$PYPL - The time has come!NASDAQ:PYPL - The time has come! 🚀
Undervalued and breaking out.
Measured Move is $94 before November 🎯
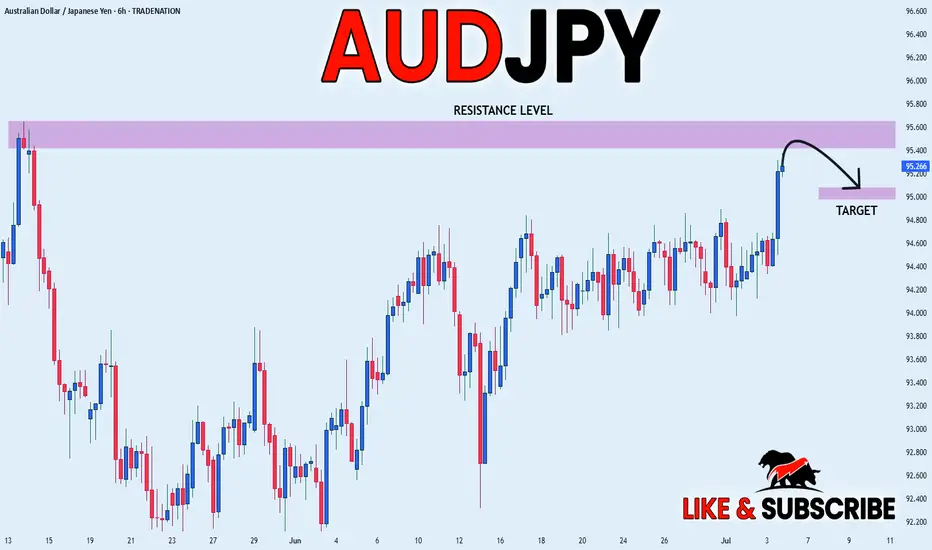
AUD_JPY RISKY SHORT|
✅AUD_JPY is set to retest a
Strong resistance level above at 95.600
After trading in a local uptrend for some time
Which makes a bearish pullback a likely scenario
With the target being a local support below at 95.081
SHORT🔥
✅Like and subscribe to never miss a new idea!✅
Disclosure: I am part of Trade Nation's Influencer program and receive a monthly fee for using their TradingView charts in my analysis.
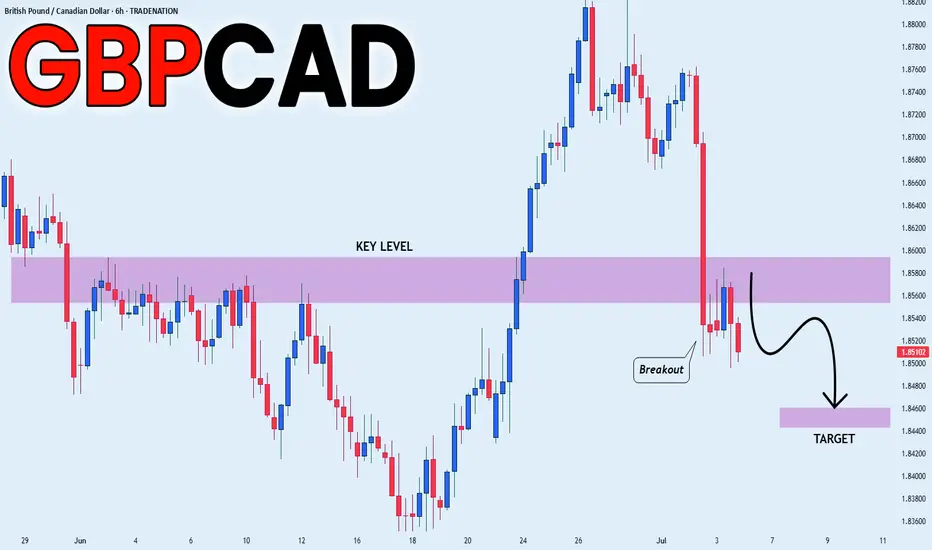
GBP_CAD BEARISH BREAKOUT|SHORT|
✅GBP_CAD broke the key structure level of 1.8580
While trading in an local downtrend
Which makes me bearish
And as the retest of the level is complete
Bearish continuation will follow
SHORT🔥
✅Like and subscribe to never miss a new idea!✅
Disclosure: I am part of Trade Nation's Influencer program and receive a monthly fee for using their TradingView charts in my analysis.
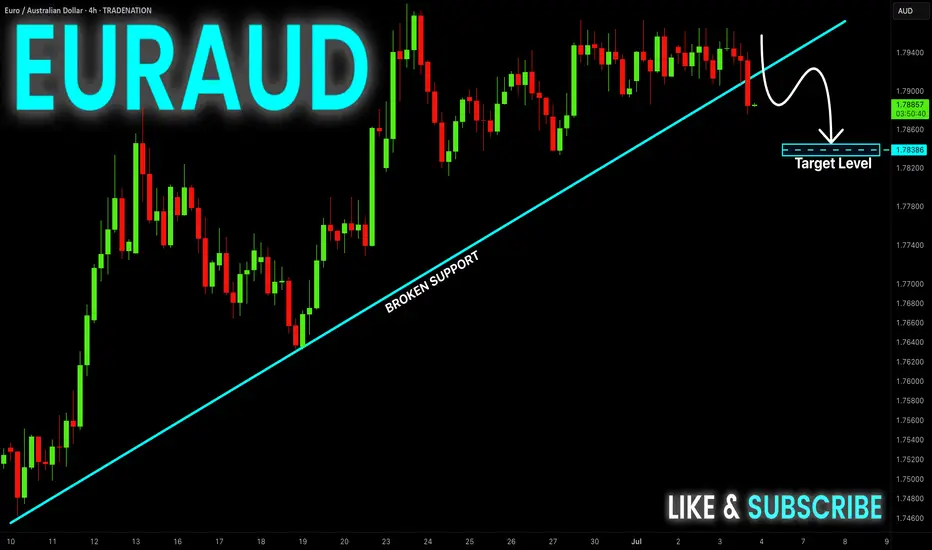
EUR-AUD Bearish Breakout! Sell!
Hello,Traders!
EUR-AUD was trading along
The rising support line but
Now we are seeing a bearish
Breakout so we are bearish
Biased and we will be expecting
A further bearish move down
Sell!
Comment and subscribe to help us grow!
Check out other forecasts below too!
Disclosure: I am part of Trade Nation's Influencer program and receive a monthly fee for using their TradingView charts in my analysis.
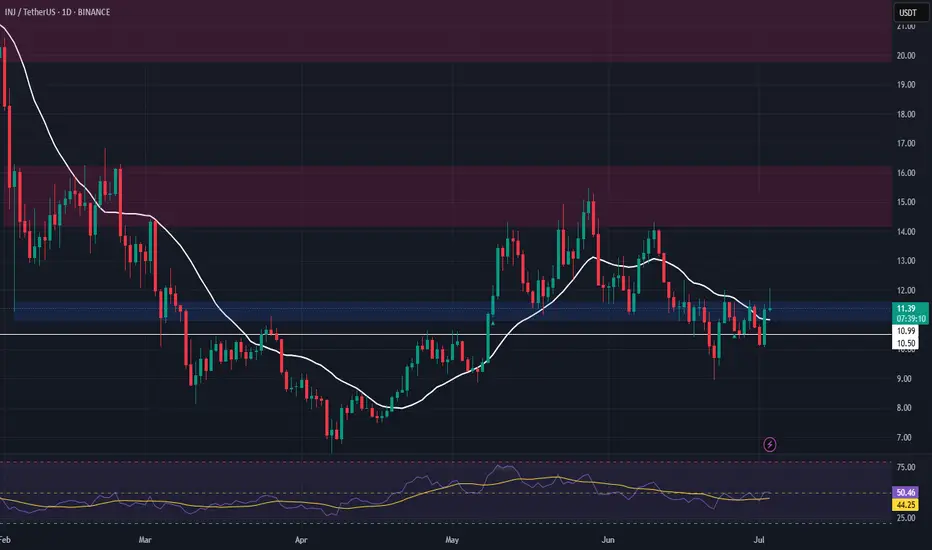
INJ Long Swing Setup – Structural Recovery with SMA ReclaimINJ has retraced to a key support zone and is showing early signs of recovery, reclaiming its 20-day SMA. With structural strength returning, the $11.00–$11.60 range offers a solid swing entry—contingent on BTC holding key levels.
📌 Trade Setup:
• Entry Zone: $11.00 – $11.60
• Take Profit Targets:
o 🥇 $14.00 – $16.00
o 🥈 $19.80 – $23.00
• Stop Loss: Daily close below $9.50 (Exit early if BTC breaks major support)
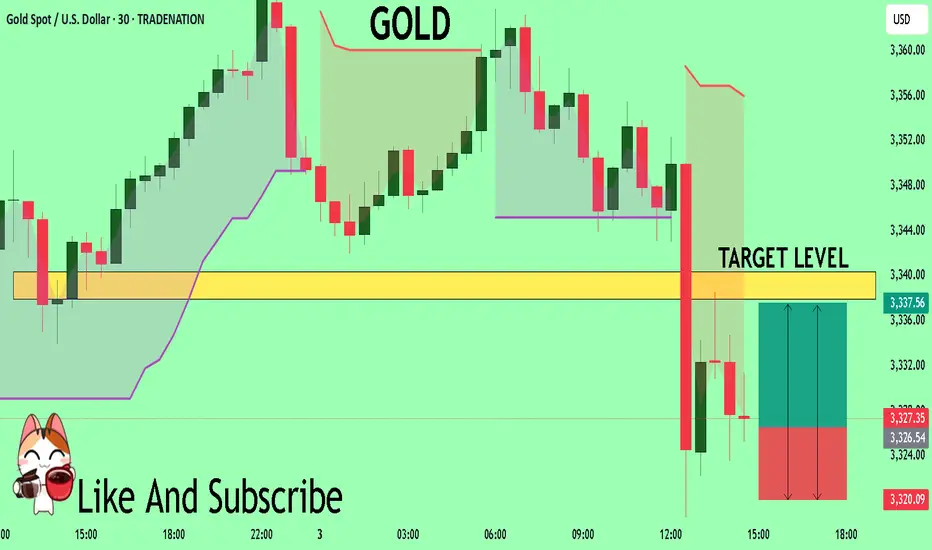
GOLD Massive Long! BUY!
My dear subscribers,
This is my opinion on the GOLD next move:
The instrument tests an important psychological level 3326.7
Bias - Bullish
Technical Indicators: Supper Trend gives a precise Bullish signal, while Pivot Point HL predicts price changes and potential reversals in the market.
Target - 3337.9
My Stop Loss - 3320.0
About Used Indicators:
On the subsequent day, trading above the pivot point is thought to indicate ongoing bullish sentiment, while trading below the pivot point indicates bearish sentiment.
Disclosure: I am part of Trade Nation's Influencer program and receive a monthly fee for using their TradingView charts in my analysis.
———————————
WISH YOU ALL LUCK
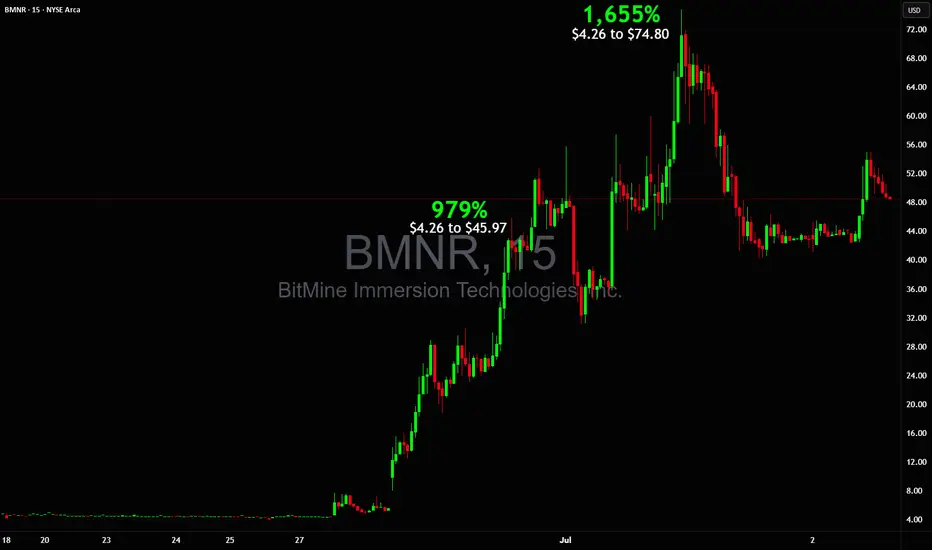
WOW $4 to $74 Big 1,655% in just 2 daysGet ready for new power runners to emerge from this AMEX:BMNR move
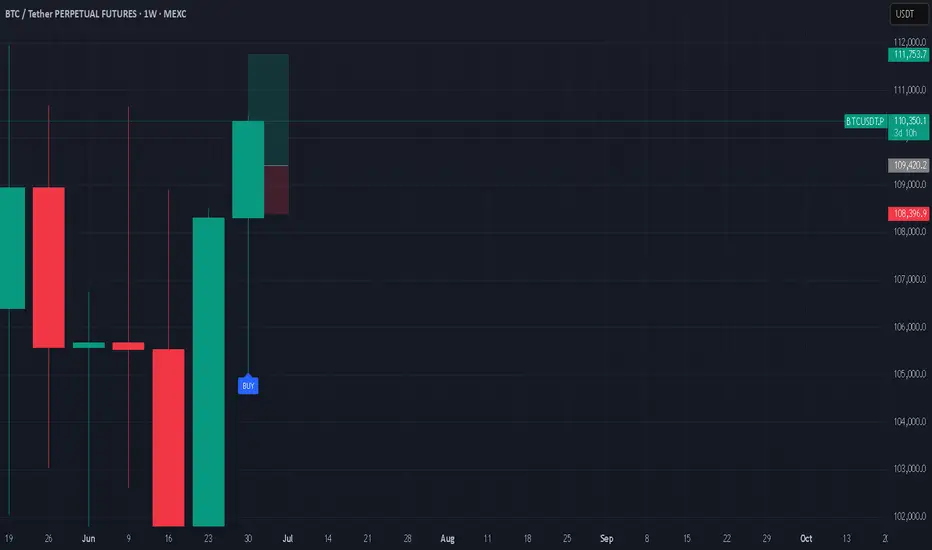
BTC: Long Position1W buy signal at $109K. Entered Long Position & currently 10 per cent in profit. BTC is going for a new ATH in the next days.
#crypto #bitcoin #trading #buysellsignals #algorithm #bot
Gold Ready to Explode Ahead of NFP and Trump’s “Super Bill”?Gold Ready to Explode Ahead of NFP and Trump’s “Super Bill”? | Global Macro Focus
🌍 MACRO UPDATE – What the World is Watching:
Gold continues its bullish trajectory as the USD weakens sharply following last night’s disappointing ADP jobs report (-33K vs expected +99K). This soft labour data has fueled further speculation that the Fed could begin rate cuts as early as September, with a 90% probability now being priced in.
In the political arena, Donald Trump’s recent statement that House Republicans are aligned to push forward a so-called “Super Bill” has triggered fresh uncertainty around US fiscal policy. This could elevate safe-haven demand for gold, especially if it leads to increased tensions over debt ceilings or government spending.
With the US Non-Farm Payrolls (NFP) due later today and the UK and US markets heading into a long weekend, traders should brace for heightened volatility and liquidity gaps.
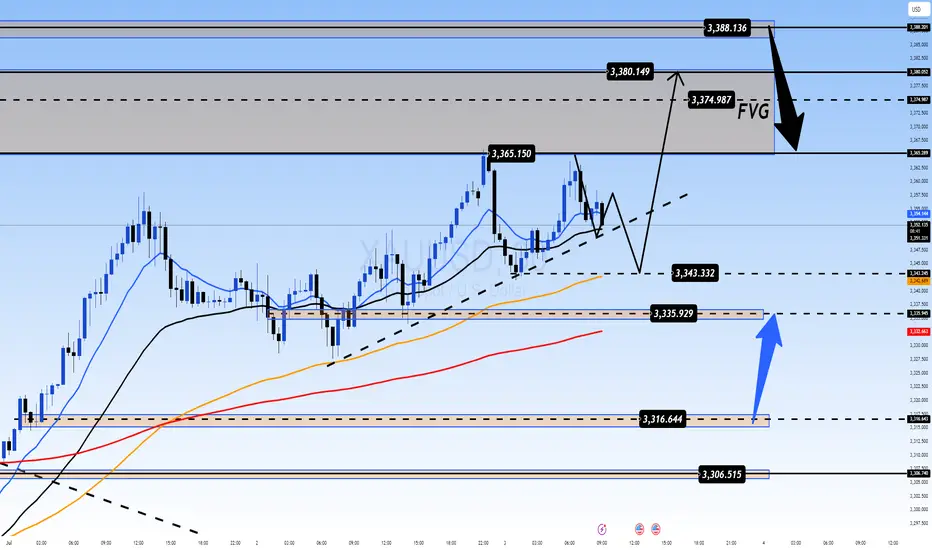
📈 TECHNICAL OUTLOOK – What the Charts Are Saying:
Overall Trend: Bullish structure remains intact as gold breaks and holds above 3365.
EMA Setup: Price trades above EMA 13/34/89/200 – signaling strong upside momentum.
Fair Value Gap (FVG): 3374 – 3388 area remains an unfilled FVG zone; possible magnet for short-term price action.
Key Resistance Levels: 3365, 3374, 3380, 3388, 3393
Key Support Levels: 3343, 3335, 3325, 3316, 3304
Trendline & Structure: The ascending trendline from 3316 remains unbroken, providing a potential bounce point if price corrects.
🎯 TRADE SETUPS – Strategic Zones to Watch:
🔵 Buy (Short-Term Scalp):
Entry: 3335 – 3333
SL: 3329
TP: 3340 → 3350 → 3360 → 3370
🟢 Buy Zone (Swing Perspective):
Entry: 3316 – 3314
SL: 3310
TP: 3320 → 3336 → 3350 → 3360
🔴 Sell Scalp (Reversal Zone)
Entry: 3374 – 3376
SL: 3380
TP: 3370 → 3360 → 3350
⚠️ Sell Zone (High-Risk Rejection):
Entry: 3388 – 3390
SL: 3394
TP: 3380 → 3370 → 3360
🔎 NOTE FOR GLOBAL TRADERS:
With UK markets partially closed and US session shortened ahead of the Independence Day holiday, liquidity may be thin and volatility could spike unexpectedly. Always place stop-loss and avoid emotional entries near key resistance.
💬 Do you believe gold can break and close above the FVG zone (3388) before the weekend volatility hits full throttle? Let’s discuss.
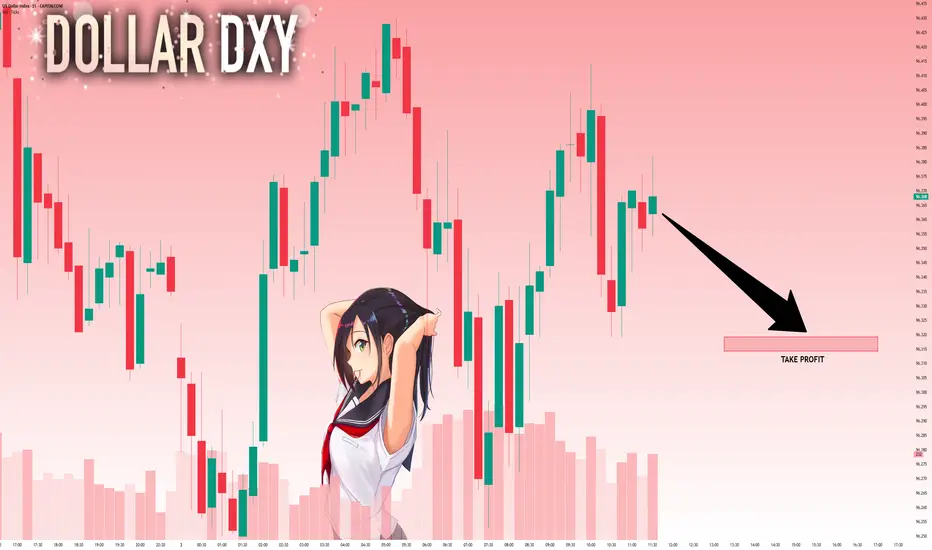
DXY: Next Move Is Down! Short!
My dear friends,
Today we will analyse DXY together☺️
The market is at an inflection zone and price has now reached an area around 96.362 where previous reversals or breakouts have occurred.And a price reaction that we are seeing on multiple timeframes here could signal the next move down so we can enter on confirmation, and target the next key level of 96.319..Stop-loss is recommended beyond the inflection zone.
❤️Sending you lots of Love and Hugs❤️
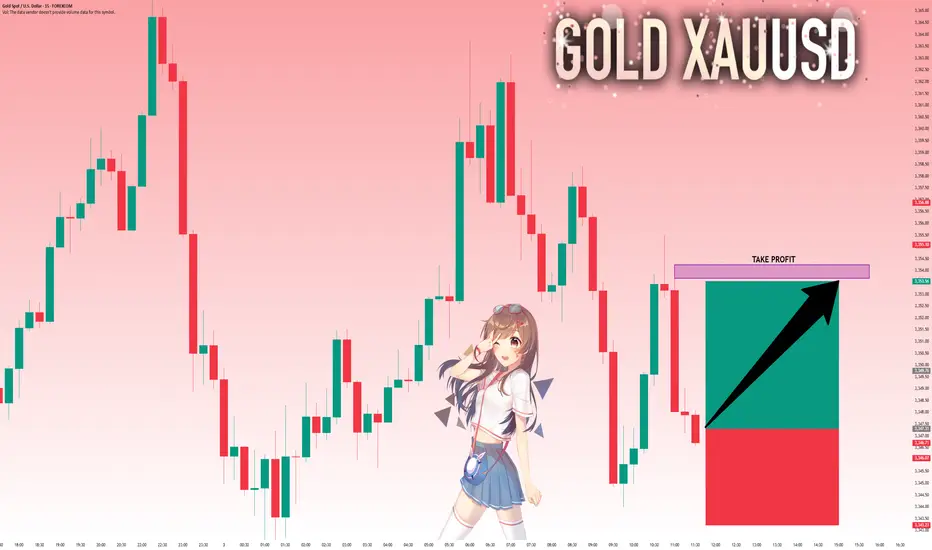
GOLD: Target Is Up! Long!
My dear friends,
Today we will analyse GOLD together☺️
The price is near a wide key level
and the pair is approaching a significant decision level of 3,347.31 Therefore, a strong bullish reaction here could determine the next move up.We will watch for a confirmation candle, and then target the next key level of 3,353,67.Recommend Stop-loss is beyond the current level.
❤️Sending you lots of Love and Hugs❤️
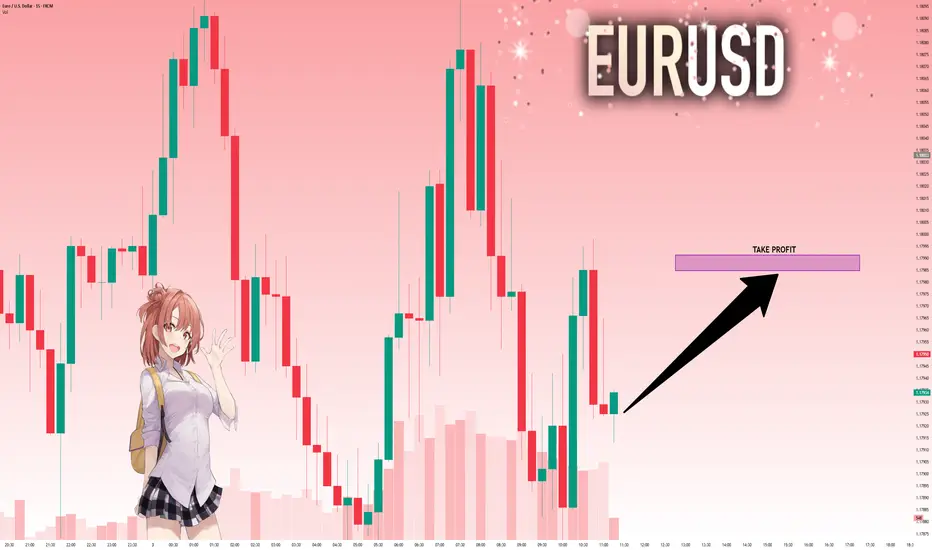
EURUSD: Move Up Expected! Long!
My dear friends,
Today we will analyse EURUSD together☺️
The recent price action suggests a shift in mid-term momentum. A break above the current local range around 1.17930v will confirm the new direction upwards with the target being the next key level of 1.17985 and a reconvened placement of a stop-loss beyond the range.
❤️Sending you lots of Love and Hugs❤️