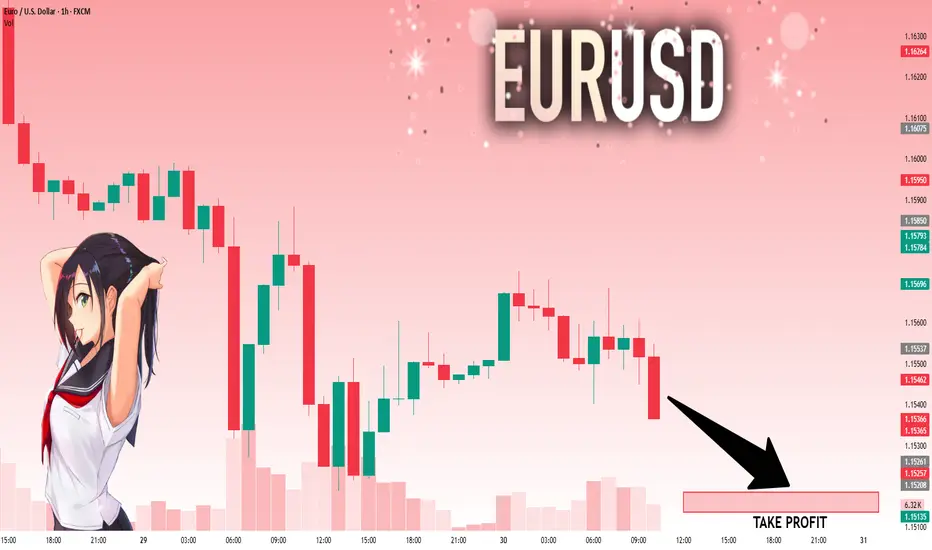
EURUSD: Target Is Down! Short!
My dear friends,
Today we will analyse EURUSD together☺️
The price is near a wide key level
and the pair is approaching a significant decision level of 1.15428 Therefore, a strong bearish reaction here could determine the next move down.We will watch for a confirmation candle, and then target the next key level of 115186..Recommend Stop-loss is beyond the current level.
❤️Sending you lots of Love and Hugs❤️
Trading
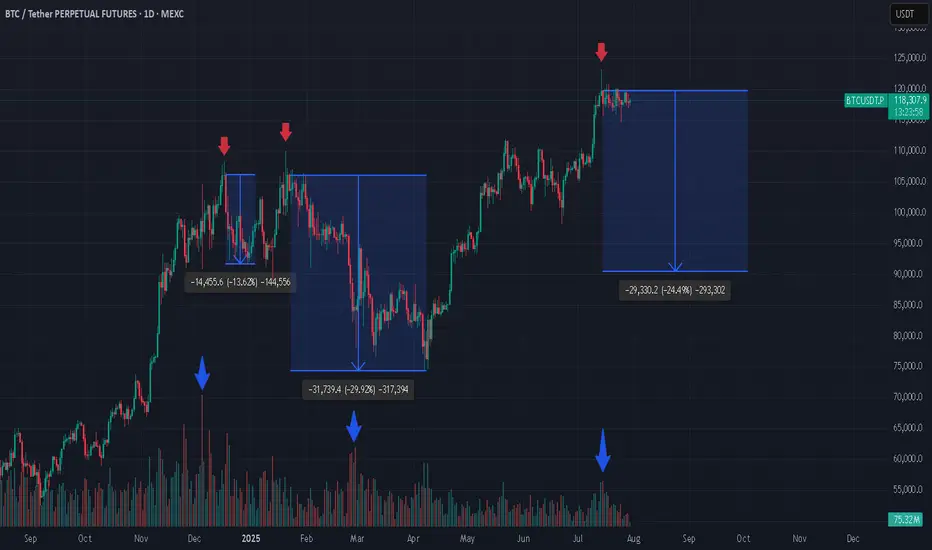
3 Bitcoin Tops, Weak Green Candles, and What’s Next? If you're closely monitoring the Bitcoin (BTC) market, patterns often begin to reveal themselves in surprising ways. In the attached chart, I’ve highlighted three major local tops that Bitcoin has made, each marked by a weak green daily candle. What’s even more striking is what comes next: a dramatic increase in trading volume, followed by steep corrections.
Spotting the Pattern: Weak Green, Heavy Volume
At each pointed top (see red arrows), BTC formed an all-time high (ATH) with a relatively weak green candle, hardly the sign of euphoric buying strength.
Look closely at the volume bars below (blue arrows). Each time, as price struggled to push higher, volume surged after the top, often a signal of major sellers stepping in or longs closing en masse.
What followed? Significant corrections: -13.6%, -29.2%, and, now it might be shaping up for another potential drop (-24.1%) if history rhymes.
Why Does This Matter?
From a technical analysis perspective, volume is the fuel behind price moves. When a new high is reached with limp buying (weak green candles) but is swiftly met with rising volume on the way down, it’s a classic sign of distribution, a strong hand selling into retail euphoria.
Is Another Drop Coming?
Given the consistency in behavior, it’s not unreasonable to ask: are we about to witness another similar correction now that BTC has again hit a top with a weak green candle and volume is ticking up? The historical evidence certainly makes it plausible.
Long-Term Perspective: Still Bullish
Despite these corrections, my long-term outlook remains bullish. Every cycle has corrections, they’re opportunities for healthy consolidation, allowing strong hands to accumulate and the market to reset for its next leg higher.
*not investment advice
#crypto #btc #bitcoin #finance #trading
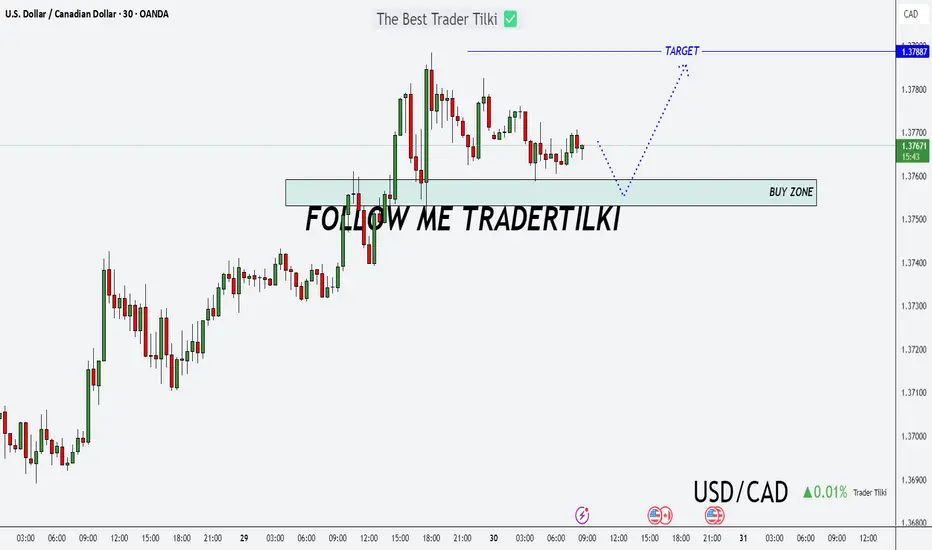
A New Day, A New Opportunity: USDCAD Buy StrategyGood morning Traders,
USDCAD has reached a key support zone between 1.37531 and 1.37592.
I'm opening a buy position from this level, aiming for the 1.37887 target.
Feel free to adjust your stop-loss based on your own margin and risk tolerance.
Your likes are my biggest source of motivation when sharing analysis. Thanks to everyone who supports with a simple like!
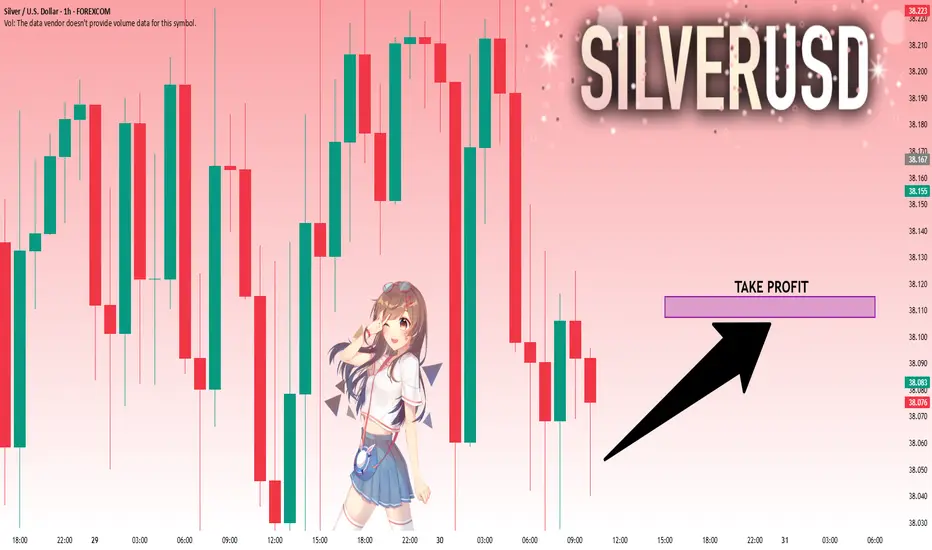
SILVER: Move Up Expected! Long!
My dear friends,
Today we will analyse SILVER together☺️
The recent price action suggests a shift in mid-term momentum. A break above the current local range around 38.054 will confirm the new direction upwards with the target being the next key level of 38.107 and a reconvened placement of a stop-loss beyond the range.
❤️Sending you lots of Love and Hugs❤️
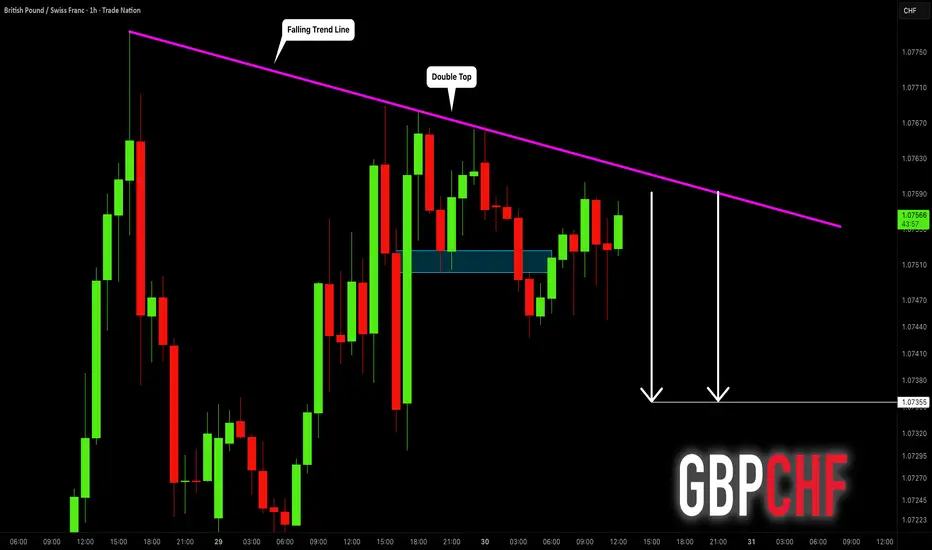
GBPCHF: Another Bearish Signal?! 🇬🇧🇨🇭
Quick update for GBPCHF.
We discussed a strong bearish confirmation yesterday.
Today, we have one more.
The price formed a double top after a test of a strong intraday
falling trend line.
Its neckline was broken this morning.
I expect a retracement to 1.0735
❤️Please, support my work with like, thank you!❤️
I am part of Trade Nation's Influencer program and receive a monthly fee for using their TradingView charts in my analysis.
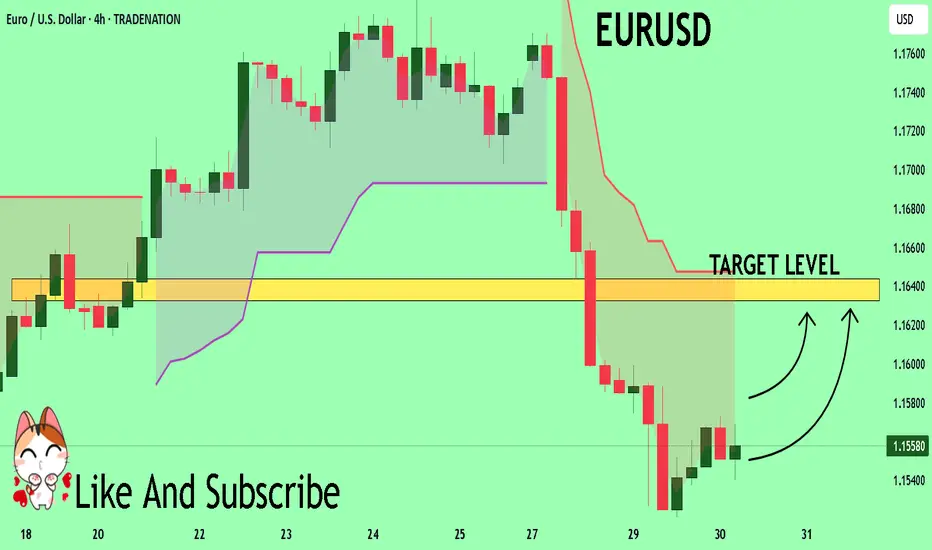
EURUSD Set To Grow! BUY!
My dear followers,
This is my opinion on the EURUSD next move:
The asset is approaching an important pivot point 1.1557
Bias - Bullish
Technical Indicators: Supper Trend generates a clear long signal while Pivot Point HL is currently determining the overall Bullish trend of the market.
Goal - 1.1632
About Used Indicators:
For more efficient signals, super-trend is used in combination with other indicators like Pivot Points.
Disclosure: I am part of Trade Nation's Influencer program and receive a monthly fee for using their TradingView charts in my analysis.
———————————
WISH YOU ALL LUCK
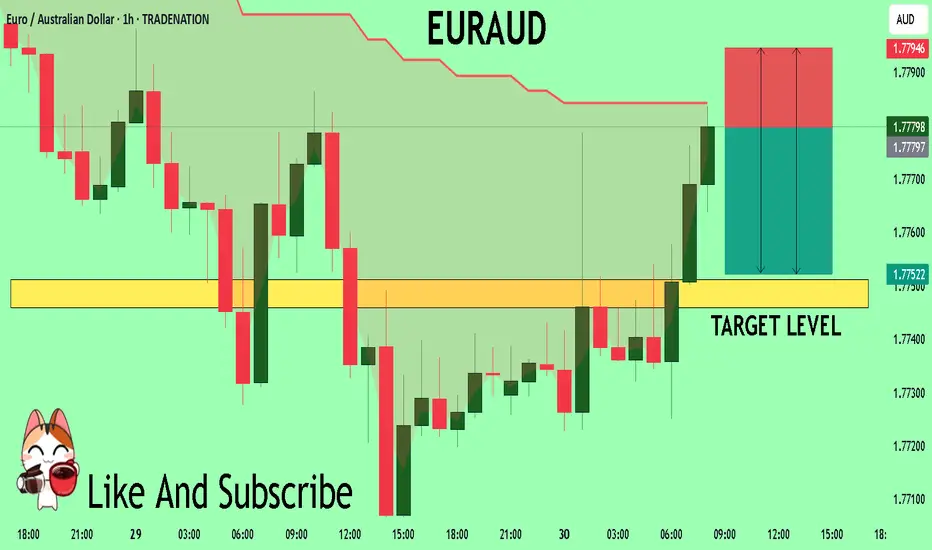
EURAUD Under Pressure! SELL!
My dear followers,
I analysed this chart on EURAUD and concluded the following:
The market is trading on 1.7780 pivot level.
Bias - Bearish
Technical Indicators: Both Super Trend & Pivot HL indicate a highly probable Bearish continuation.
Target - 1.7751
Safe Stop Loss - 1.7794
About Used Indicators:
A super-trend indicator is plotted on either above or below the closing price to signal a buy or sell. The indicator changes color, based on whether or not you should be buying. If the super-trend indicator moves below the closing price, the indicator turns green, and it signals an entry point or points to buy.
Disclosure: I am part of Trade Nation's Influencer program and receive a monthly fee for using their TradingView charts in my analysis.
———————————
WISH YOU ALL LUCK
#AN022: Geopolitical Tensions and Forex Pressure
Hello, I'm Forex Trader Andrea Russo, and today I want to talk to you about this week's latest geopolitical tensions.
1. The Russian ruble in crisis, weakening against the USD and CNY
The ruble fell 1.5% against the dollar and 0.8% against the yuan, following a US ultimatum to Moscow for an immediate truce in Ukraine.
FX Impact: The ruble remains vulnerable, fueling demand for safe-haven currencies such as the USD, EUR, and CHF. Crosses against the RUB show potential technical short reversals.
2. Oil Rises: First Impacts on Energy Costs
Brent prices rose 3.5% to $72.50 a barrel following the announcement of possible US sanctions on buyers of Russian oil.
FX Impact: Oil-related currencies such as the CAD and NOK benefit; USD risks weakness if importing countries experience inflationary pressures.
3. Euro falls monthly for the first time, dollar strengthens
The euro is in the red on a monthly basis for the first time in 2025, while the dollar benefits from cautious Fed rate expectations and the EU-US trade deal perceived as biased toward Washington.
Forex Impact: EUR/USD is under structural pressure. Euro-commodity correlates (EUR/CAD, EUR/AUD) are showing signs of weakness.
4. IMF warns of US tariffs and rising global inflation
In its latest report, the IMF emphasized that US tariffs are slowing global growth and fueling persistent inflationary pressures.
FX Impact: Increased uncertainty favors the USD and CHF. Emerging economies and commodity-linked economies (MXN, ZAR, BRL) could weaken further.
5. India Strengthens: Growing Exports and Solid Reserves
India recorded a 7.2% increase in merchandise exports and maintains stable foreign exchange reserves, demonstrating macroeconomic resilience and the resilience of the rupee.
Forex Impact: The INR could strengthen or consolidate at robust levels, while USD/INR pairs signal potential support.
6. Global Digital Projects and Fragmentation of Payment Systems
The adoption of alternative systems to SWIFT such as mBridge or Project Agorá reflects a push toward global financial independence.
Forex Impact: The euro and dollar remain dominant, but the RMB is gaining ground in Asia-Pacific countries. RMB crosses (USD/CNH, EUR/CNH) require attention, especially from a long-term perspective.

Gold Price Analysis July 30Gold (XAUUSD) Consolidating in a Triangle Pattern – Preparing for a Big Breakout
Currently, gold is moving within a triangle consolidation pattern, reflecting the market’s indecision as investors await a series of important economic data from the US this week. This hesitation suggests that a breakout from the triangle pattern could trigger a strong FOMO effect, creating a significant price movement in either direction.
The current price action is similar to a “bull flag” or “pennant” pattern, where a breakout could lead to a clearer and more decisive trend. If the support zone in the pattern fails to hold, the possibility of a sell-off is high.
Trading scenario:
🔻 Activate SELL order:
When price breaks the triangle bottom around 3324
Downside target: 3285, further is the strong support zone at 3250
🔺 Activate BUY order:
When price breaks and holds above the resistance zone 3333
Or: when there is a bearish rejection signal and candle confirmation at the area 3385

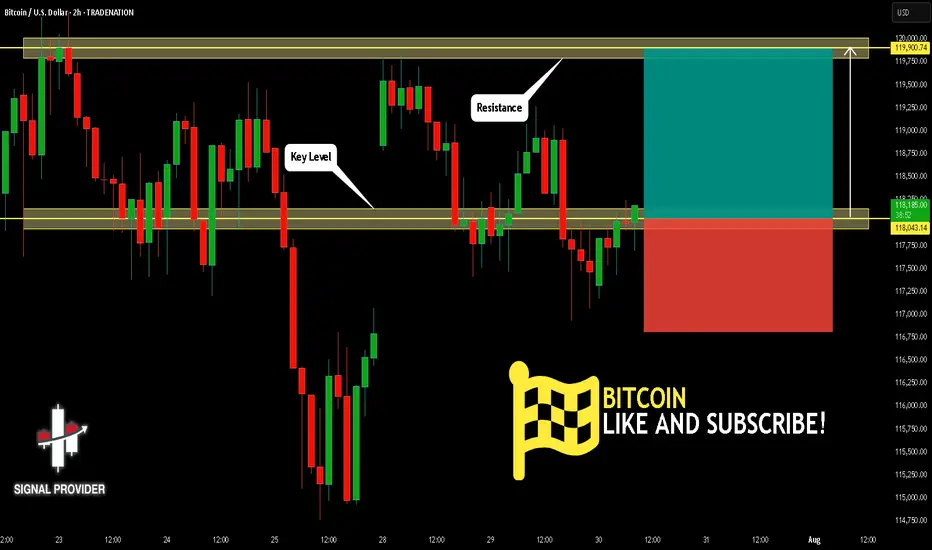
BITCOIN Will Move Higher! Long!
Take a look at our analysis for BITCOIN.
Time Frame: 2h
Current Trend: Bullish
Sentiment: Oversold (based on 7-period RSI)
Forecast: Bullish
The price is testing a key support 118,043.14.
Current market trend & oversold RSI makes me think that buyers will push the price. I will anticipate a bullish movement at least to 119,900.74 level.
P.S
The term oversold refers to a condition where an asset has traded lower in price and has the potential for a price bounce.
Overbought refers to market scenarios where the instrument is traded considerably higher than its fair value. Overvaluation is caused by market sentiments when there is positive news.
Disclosure: I am part of Trade Nation's Influencer program and receive a monthly fee for using their TradingView charts in my analysis.
Like and subscribe and comment my ideas if you enjoy them!
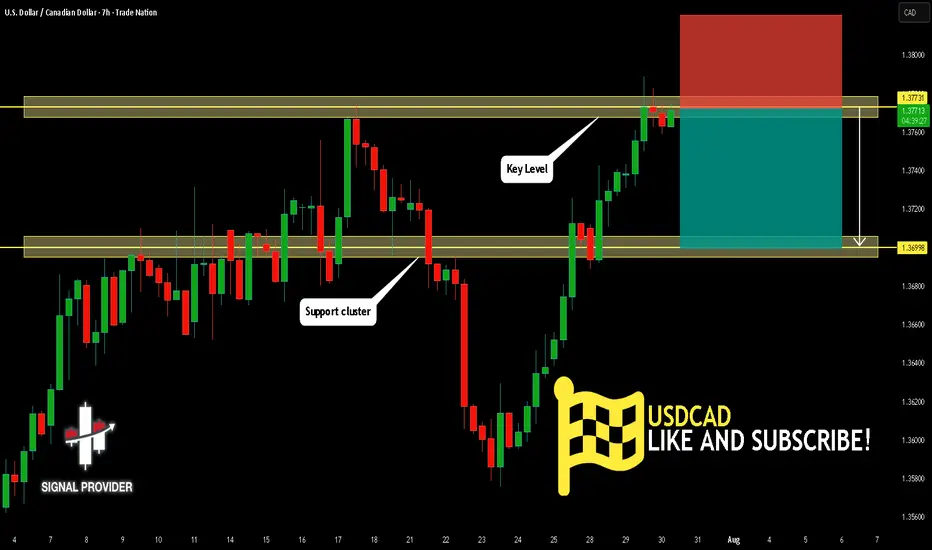
USDCAD Is Bearish! Sell!
Please, check our technical outlook for USDCAD.
Time Frame: 7h
Current Trend: Bearish
Sentiment: Overbought (based on 7-period RSI)
Forecast: Bearish
The market is trading around a solid horizontal structure 1.377.
The above observations make me that the market will inevitably achieve 1.369 level.
P.S
We determine oversold/overbought condition with RSI indicator.
When it drops below 30 - the market is considered to be oversold.
When it bounces above 70 - the market is considered to be overbought.
Disclosure: I am part of Trade Nation's Influencer program and receive a monthly fee for using their TradingView charts in my analysis.
Like and subscribe and comment my ideas if you enjoy them!
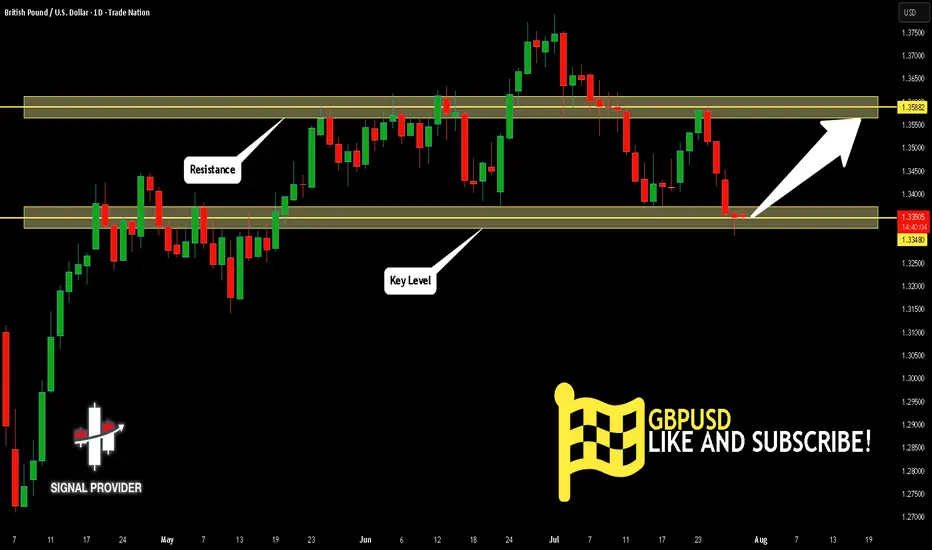
GBPUSD Is Very Bullish! Buy!
Here is our detailed technical review for GBPUSD.
Time Frame: 1D
Current Trend: Bullish
Sentiment: Oversold (based on 7-period RSI)
Forecast: Bullish
The market is testing a major horizontal structure 1.334.
Taking into consideration the structure & trend analysis, I believe that the market will reach 1.358 level soon.
P.S
Overbought describes a period of time where there has been a significant and consistent upward move in price over a period of time without much pullback.
Disclosure: I am part of Trade Nation's Influencer program and receive a monthly fee for using their TradingView charts in my analysis.
Like and subscribe and comment my ideas if you enjoy them!
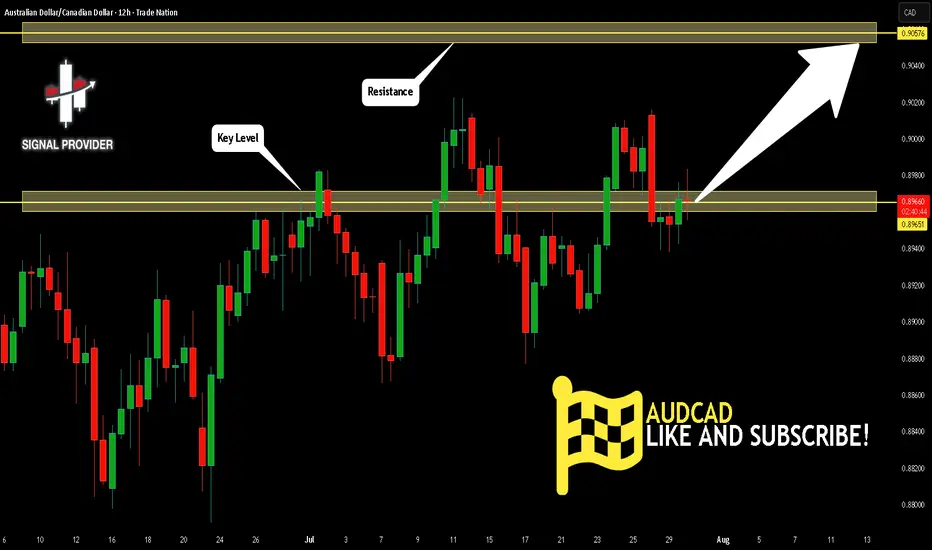
AUDCAD Is Going Up! Long!
Take a look at our analysis for AUDCAD.
Time Frame: 12h
Current Trend: Bullish
Sentiment: Oversold (based on 7-period RSI)
Forecast: Bullish
The market is approaching a key horizontal level 0.896.
Considering the today's price action, probabilities will be high to see a movement to 0.905.
P.S
Please, note that an oversold/overbought condition can last for a long time, and therefore being oversold/overbought doesn't mean a price rally will come soon, or at all.
Disclosure: I am part of Trade Nation's Influencer program and receive a monthly fee for using their TradingView charts in my analysis.
Like and subscribe and comment my ideas if you enjoy them!
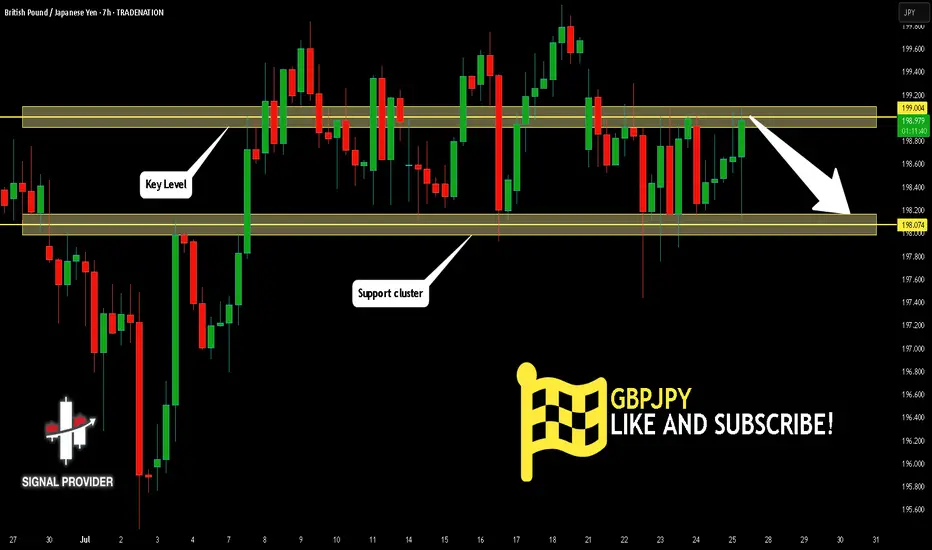
GBPJPY Is Very Bearish! Sell!
Please, check our technical outlook for GBPJPY.
Time Frame: 7h
Current Trend: Bearish
Sentiment: Overbought (based on 7-period RSI)
Forecast: Bearish
The market is trading around a solid horizontal structure 199.004.
The above observations make me that the market will inevitably achieve 198.074 level.
P.S
Please, note that an oversold/overbought condition can last for a long time, and therefore being oversold/overbought doesn't mean a price rally will come soon, or at all.
Disclosure: I am part of Trade Nation's Influencer program and receive a monthly fee for using their TradingView charts in my analysis.
Like and subscribe and comment my ideas if you enjoy them!
VRA/USDT THE RETURN TO KEY LEVELVra has good chance to return to the key level, since the last data shows a growth in the volume.

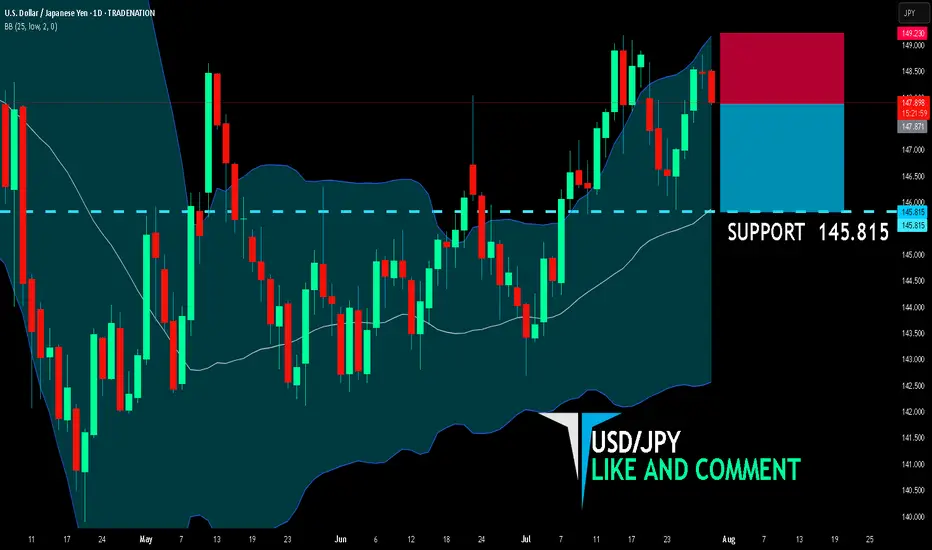
USD/JPY BEARS ARE GAINING STRENGTH|SHORT
USD/JPY SIGNAL
Trade Direction: short
Entry Level: 147.871
Target Level: 145.815
Stop Loss: 149.230
RISK PROFILE
Risk level: medium
Suggested risk: 1%
Timeframe: 1D
Disclosure: I am part of Trade Nation's Influencer program and receive a monthly fee for using their TradingView charts in my analysis.
✅LIKE AND COMMENT MY IDEAS✅
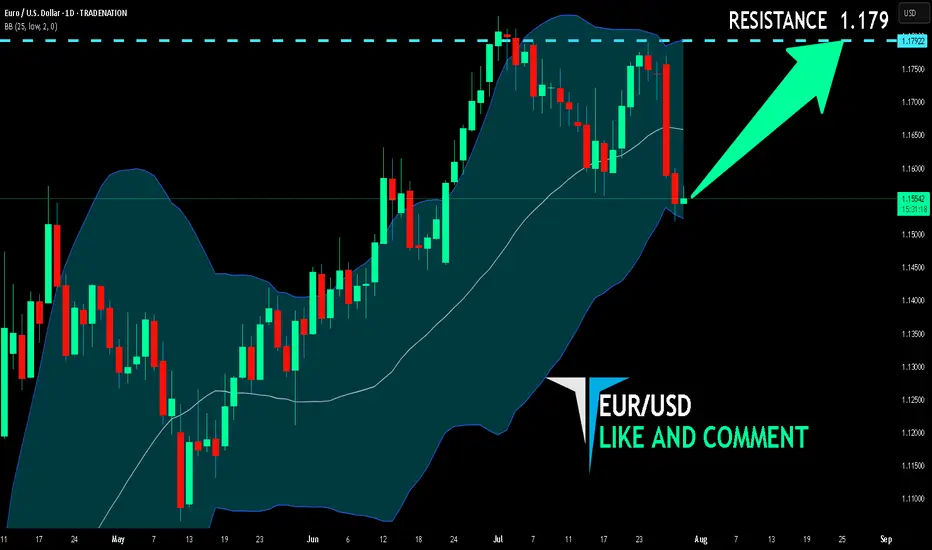
EUR/USD BULLISH BIAS RIGHT NOW| LONG
Hello, Friends!
EUR/USD pair is in the uptrend because previous week’s candle is green, while the price is obviously falling on the 1D timeframe. And after the retest of the support line below I believe we will see a move up towards the target above at 1.179 because the pair is oversold due to its proximity to the lower BB band and a bullish correction is likely.
Disclosure: I am part of Trade Nation's Influencer program and receive a monthly fee for using their TradingView charts in my analysis.
✅LIKE AND COMMENT MY IDEAS✅
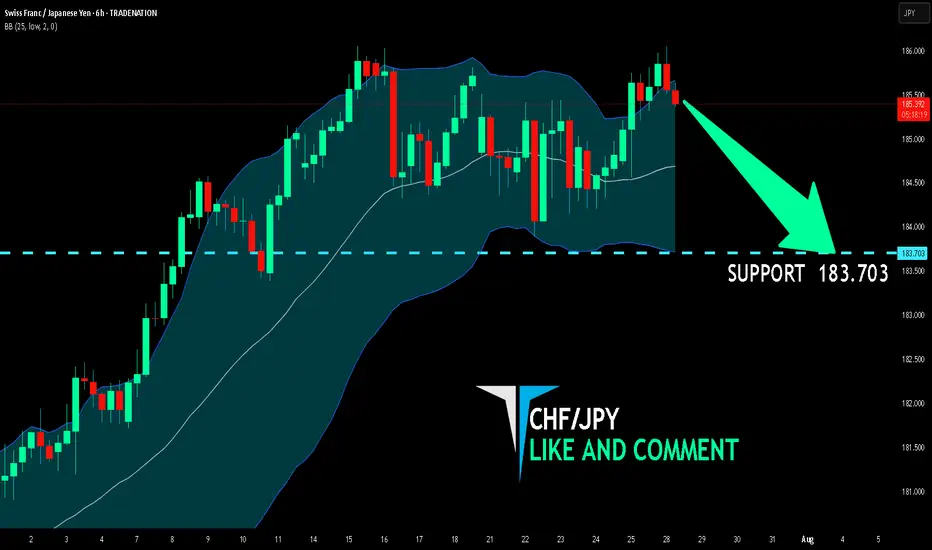
CHF/JPY BEARISH BIAS RIGHT NOW| SHORT
Hello, Friends!
The BB upper band is nearby so CHF-JPY is in the overbought territory. Thus, despite the uptrend on the 1W timeframe I think that we will see a bearish reaction from the resistance line above and a move down towards the target at around 183.703.
Disclosure: I am part of Trade Nation's Influencer program and receive a monthly fee for using their TradingView charts in my analysis.
✅LIKE AND COMMENT MY IDEAS✅
Are you ready for the BUY BTCUSD signal?✏️ The pennant pattern is forming. After BTCUSD reached a new peak, the past 1 week, BTC price has been accumulating to form a bullish pennant pattern. This is a bullish continuation pattern that signals when breaking the upper boundary of the flag pattern.
📉 Key Levels
BUY Trigger: Break and trade above 199000
Target 128000
Leave your comments on the idea. I am happy to read your views.

Nightly $SPY / $SPX Scenarios for July 30, 2025🔮 Nightly AMEX:SPY / SP:SPX Scenarios for July 30, 2025 🔮
🌍 Market‑Moving News 🌍
🧭 Fed Holds Steady Amid Uncertainty
As the FOMC enters its July 29–30 meeting, the Fed is expected to keep rates unchanged at 4.25%–4.50%, even as one or two governors may dissent in favor of rate cuts amid mixed economic data. Recent strength in consumer spending contrasts with weakness in housing and construction.
🌐 U.S.–China Trade Talks Resumed in Stockholm
Talks are under way aimed at extending the tariff truce before the August 12 deadline. Both sides described progress as constructive, though analysts remain cautious on the timeline and potential outcomes.
🛢️ Oil Up / Dollar Firmer, But Risks Remain
Brent crude hit ~$72.50/barrel (+3.5%) while WTI rose to ~$69.20 on a mix of geopolitical tension (possible new Russia tariffs) and trade optimism. The U.S. dollar edged higher following the U.S.–EU trade agreement.
📈 IMF Revises Up Global Growth—but Flags Tariff Risks
The IMF raised its 2025 growth forecast to 3.0% and maintained 3.1% for 2026, citing pre-emptive consumer demand—but warned that ongoing U.S. tariffs and policy inconsistency could dampen momentum.
📊 Key Data Releases & Events 📊
📅 Wednesday, July 30:
FOMC Rate Decision & Powell Press Conference
The Fed is expected to hold interest rates steady. Powell’s remarks will be closely watched for signals on the timing of future cuts and views on inflation and labor markets.
Advance Q2 U.S. GDP Estimate
The first look at Q2 growth is expected around +1.9% YoY, potentially validating a rebound after Q1’s contraction.
June PCE & Core PCE (Personal Consumption Expenditures Index)
The Fed's preferred inflation gauge. Markets will monitor if core inflation remains elevated, which may reinforce policy caution.
⚠️ Disclaimer:
This summary is for educational and informational purposes only—it is not financial advice. Always consult a licensed financial advisor before making investment decisions.
📌 #trading #stockmarket #economy #Fed #GDP #inflation #trade #tariffs #markets

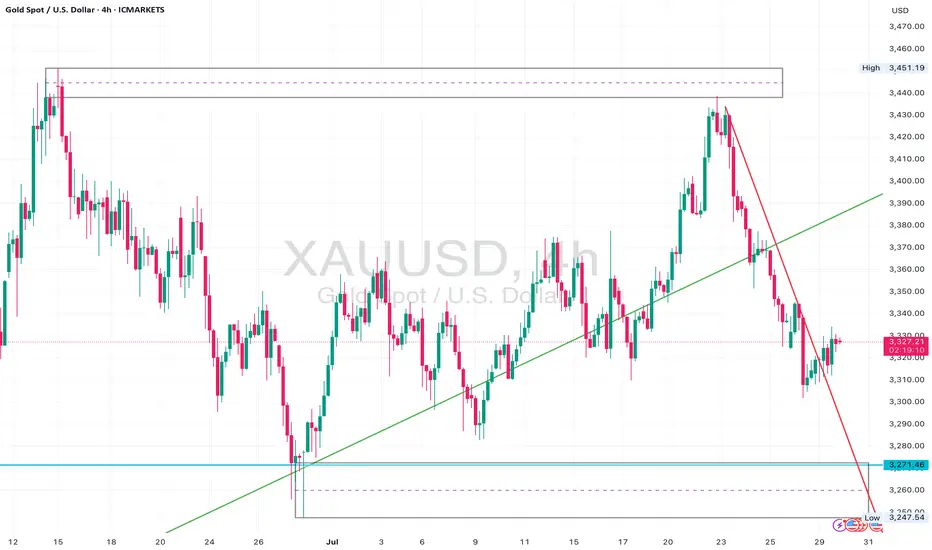
Gold Bear Flag Forming After Trendline Break – Short Setup BelowGold (XAUUSD) recently broke a major ascending trendline that had held since late June, leading to an aggressive sell-off from the $3,440s down to the $3,270 zone.
Following that, price is now consolidating just beneath the previous support trendline, forming what appears to be a bear flag or rising channel inside a corrective structure.
The $3,330–$3,340 zone is now acting as resistance, and price is struggling to close above this level.
The current structure suggests continuation to the downside, with clean space to revisit the $3,271 liquidity pool and potentially even sweep that low.
Watch for bearish confirmation below the current flag – especially if price prints a rejection wick or engulfing candle at the upper edge of the box.
⸻
Key Levels:
• Resistance: $3,330 – $3,340 (flag top + previous support turned resistance)
• Support: $3,271 zone, followed by $3,248 sweep potential
⸻
Trigger Criteria:
• Bearish rejection inside the flag (e.g. pin bar or engulfing)
• Break and retest of the flag bottom or horizontal support
⸻
Risk Note:
A clean break back above $3,350 and reclaim of the previous trendline would invalidate this idea short term and shift bias back to neutral/bullish.
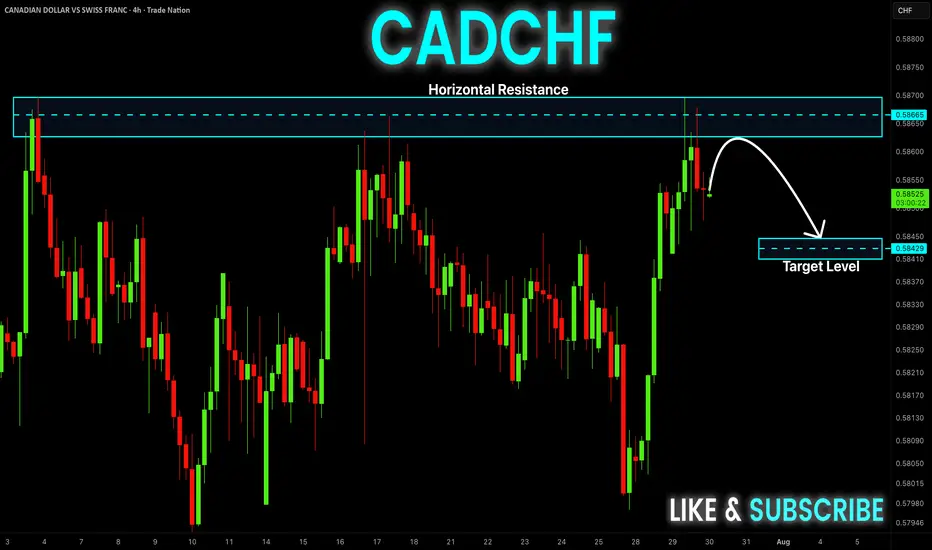
CAD-CHF Local Short! Sell!
Hello,Traders!
CAD-CHF went up and
Made a retest of the
Horizontal resistance
Around 0.5870 and we
Are already seeing a bearish
Pullback so we will be
Expecting a further
Bearish correction
Sell!
Comment and subscribe to help us grow!
Check out other forecasts below too!
Disclosure: I am part of Trade Nation's Influencer program and receive a monthly fee for using their TradingView charts in my analysis.
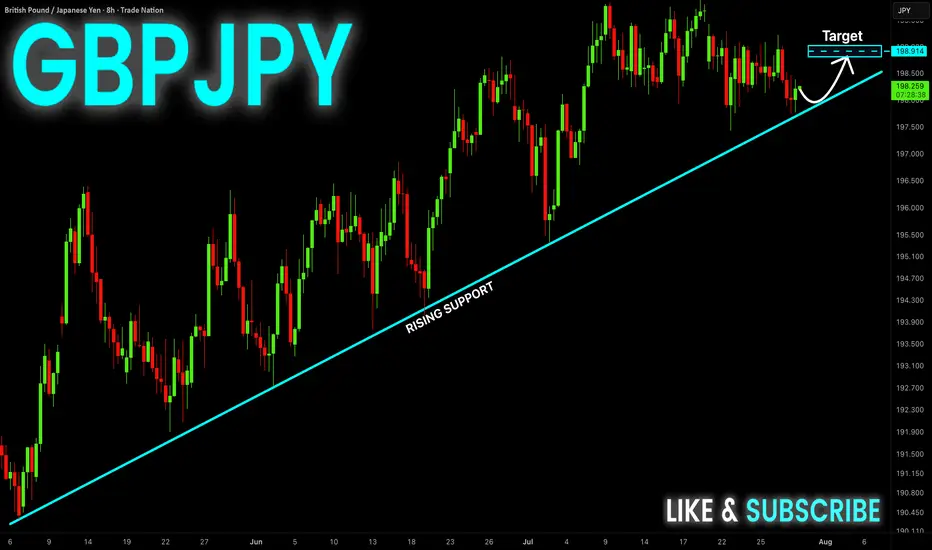
GBP-JPY Rising Support! Buy!
Hello,Traders!
GBP-JPY is trading in an
Uptrend and the pair made
A retest of the rising support
And we are seeing a local
Bullish rebound and we will
Be expecting a further
Local move up
Buy!
Comment and subscribe to help us grow!
Check out other forecasts below too!
Disclosure: I am part of Trade Nation's Influencer program and receive a monthly fee for using their TradingView charts in my analysis.