Ethereum Eyes $8K After Bullish BreakoutEthereum (ETH) is setting up for a powerful move. After hitting a multi-month high last week, ETH pulled back into a higher-low formation—strengthening the newly established bullish trend.
Money flow is shifting: with recent crypto legislation, Ethereum is now benefiting even more than Bitcoin, marking a notable change in market dynamics.
📈 Technical Highlights:
✅ Short-term target: $4,800–$5,000 (new all-time highs)
✅ Long-term potential: $7,000–$8,000
🛡️ Key support: $2,800–$3,000 (bullish as long as this holds)
📣 Takeaway:
Ethereum’s trend is firmly bullish. As long as support holds, pullbacks could offer strong entry opportunities for both swing traders and long-term investors.
#Ethereum #ETHUSD #Crypto #Trading #TechnicalAnalysis #CryptoTrading #EthereumPrice #Altcoins #Bullish #Breakout
Trading

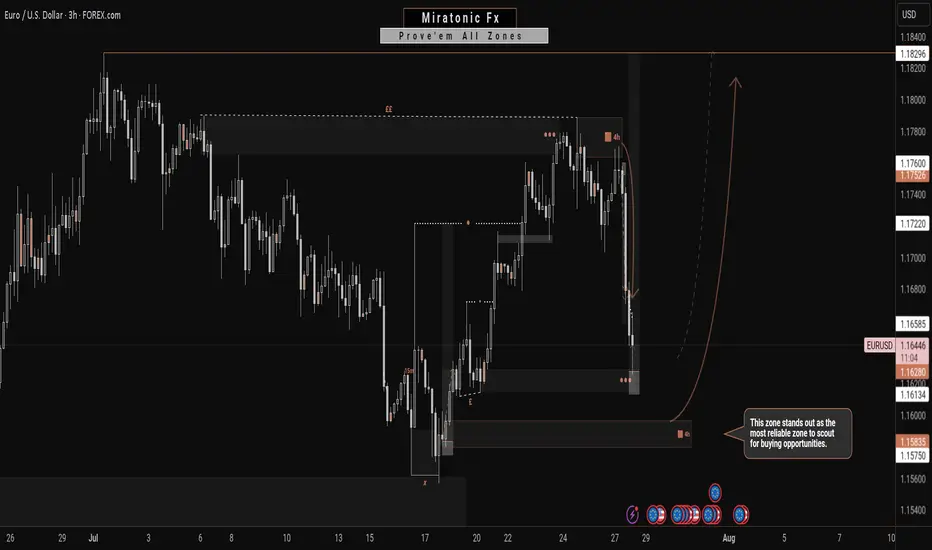
Potentially, A Safer Way To Long The EURUSDIn contrast to my previous outlook, the current price action suggests an increased probability of a deeper bearish move—potentially invalidating the buy zone marked out in the previous analysis. This sudden change is largely driven by the prospect of untapped liquidity residing beneath that zone, reinforcing the well-known market principle that price seeks out liquidity before committing to directional moves.
Given this development, the newly identified zone on the chart emerges as a more technically sound and reliable area from which to anticipate bullish interest. It aligns better with the broader liquidity profile and offers a stronger base for accumulation. Traders may opt to wait for confirmations within this zone or, depending on their risk appetite, consider executing buy positions upon price entry.
As always, patience and clarity are key as we allow price to reveal its intention.
Fingers crossed 🤞
Wishing you all a focused and profitable trading week.
Catch you on the next one. 🫡
EURJPY Sellers In Panic! BUY!
My dear friends,
Please, find my technical outlook for EURJPY below:
The price is coiling around a solid key level - 172.51
Bias - Bullish
Technical Indicators: Pivot Points Low anticipates a potential price reversal.
Super trend shows a clear buy, giving a perfect indicators' convergence.
Goal - 173.00
Safe Stop Loss - 172.29
About Used Indicators:
The pivot point itself is simply the average of the high, low and closing prices from the previous trading day.
Disclosure: I am part of Trade Nation's Influencer program and receive a monthly fee for using their TradingView charts in my analysis.
———————————
WISH YOU ALL LUCK

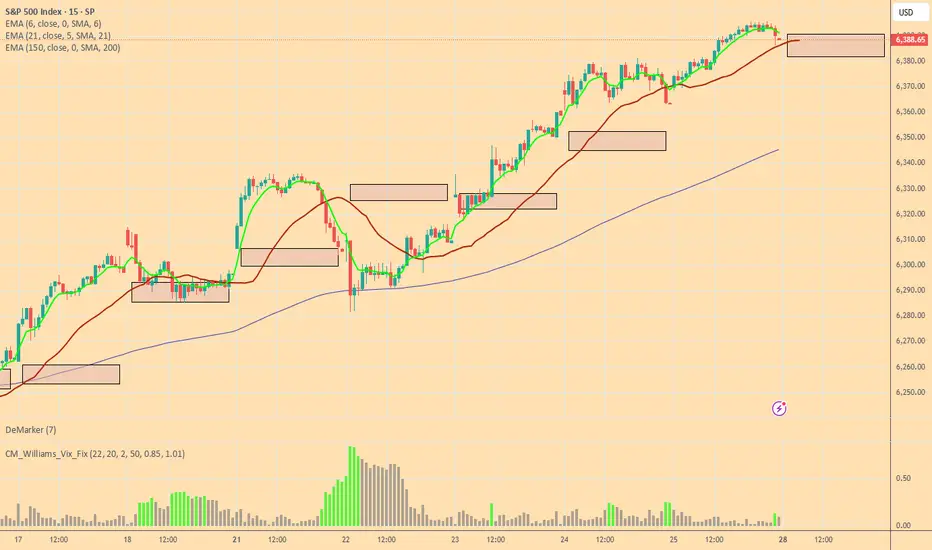
Bulls and Bears zone for 07-28-2025Last week 4 out of 5 sessions S&P 500 made new ATH. However they were all trading within a tight range.
Level to watch: 6434---6436
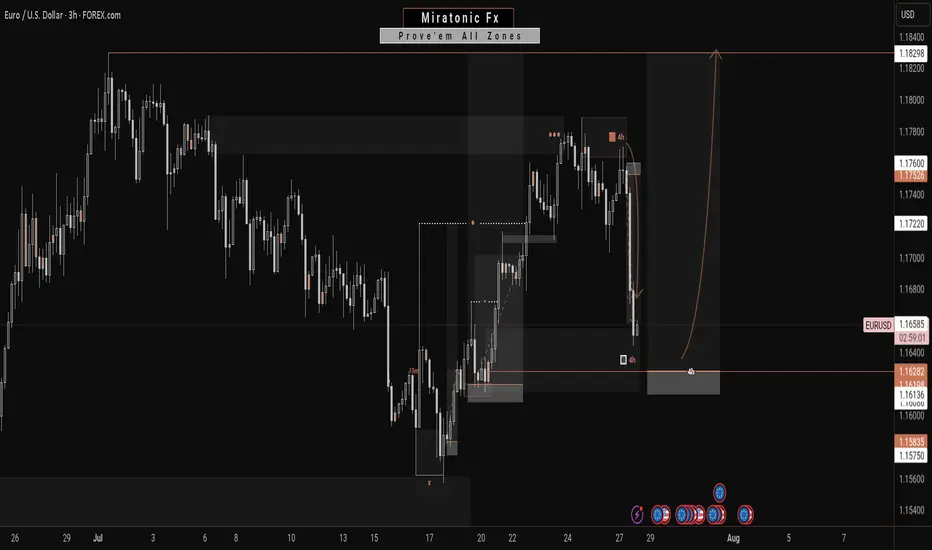
Next Move On EURUSD: A Bullish ContinuationWith this 4H bearish impulsive move, it’s easy to assume a reversal is underway to break the previous daily swing low. However, this appears more like a liquidity grab—fueling the next leg to the upside.
Price has retraced into a key zone that previously performed a strong liquidation. With significant liquidity already swept and clean inducements now resting above, this level becomes crucial.
This zone is the last stand: a break downward may target the daily swing low, while a hold and reaction could propel price toward the swing high.
Fingers crossed 🤞 as we watch price play out.
Have a great trading week, traders.
Catch you in the next one. 🫡
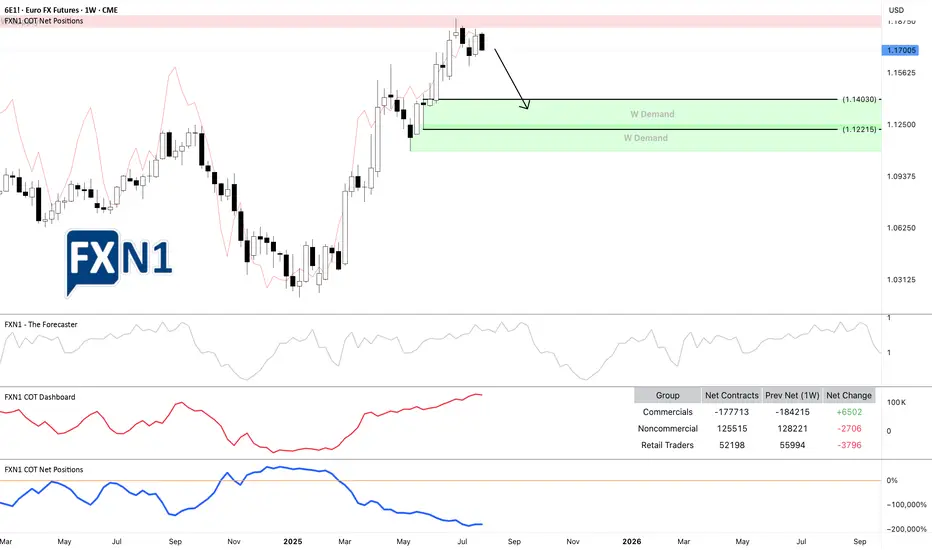
6E1!: Rebound at Weekly Supply Sparks Potential ReversalThe EURUSD (6E1! futures) experienced a rebound from a weekly supply zone * and now appears to be approaching a potential reversal toward a demand area. The overall picture is clear: we already capitalized on the rebound off the previous weekly supply zone, and at this point, we're simply observing the price as it approaches another key area of interest. It may be too late to initiate new short positions at this stage, but traders still holding shorts could potentially benefit from a continued move downward.
From a fundamental perspective, our Friday analysis of the DXY ** indicated the possibility of a bullish impulse, and today the US Dollar opened the session with a 0.58% gain. Currently, both commercial and non-commercial traders are aligned with the prevailing scenario. The most optimistic outlook suggests the price could decline to around 1.14030 over the coming weeks.
*
Previous analysis on EURUSD 6E1!
**
DXY Analysis
✅ Please share your thoughts about 6E1! in the comments section below and HIT LIKE if you appreciate my analysis. Don't forget to FOLLOW ME; you will help us a lot with this small contribution.
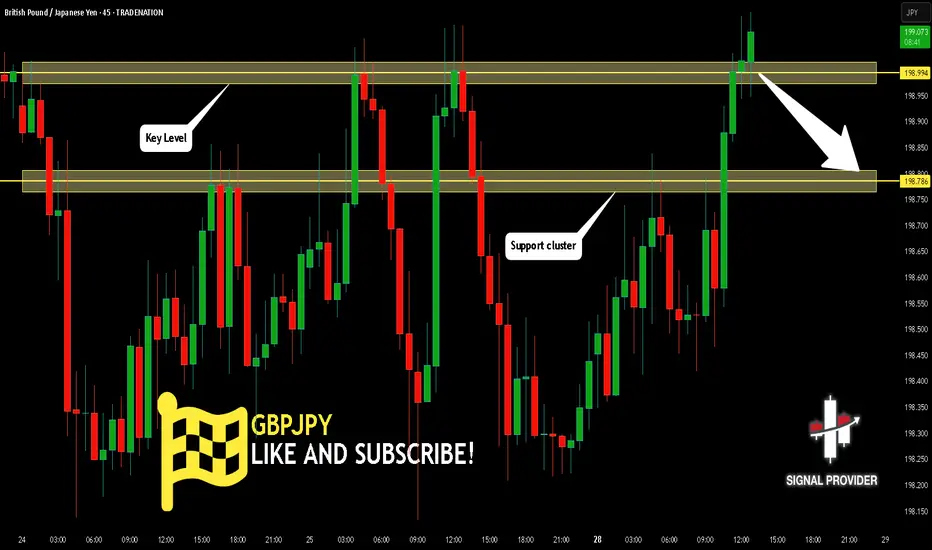
GBPJPY Is Very Bearish! Sell!
Please, check our technical outlook for GBPJPY.
Time Frame: 45m
Current Trend: Bearish
Sentiment: Overbought (based on 7-period RSI)
Forecast: Bearish
The market is approaching a significant resistance area 198.994.
Due to the fact that we see a positive bearish reaction from the underlined area, I strongly believe that sellers will manage to push the price all the way down to 198.786 level.
P.S
Overbought describes a period of time where there has been a significant and consistent upward move in price over a period of time without much pullback.
Disclosure: I am part of Trade Nation's Influencer program and receive a monthly fee for using their TradingView charts in my analysis.
Like and subscribe and comment my ideas if you enjoy them!
GBPAUD Is Going Up! Long!
Here is our detailed technical review for GBPAUD.
Time Frame: 6h
Current Trend: Bullish
Sentiment: Oversold (based on 7-period RSI)
Forecast: Bullish
The market is on a crucial zone of demand 2.055.
The oversold market condition in a combination with key structure gives us a relatively strong bullish signal with goal 2.070 level.
P.S
Please, note that an oversold/overbought condition can last for a long time, and therefore being oversold/overbought doesn't mean a price rally will come soon, or at all.
Disclosure: I am part of Trade Nation's Influencer program and receive a monthly fee for using their TradingView charts in my analysis.
Like and subscribe and comment my ideas if you enjoy them!

EURUSD Massive Long! BUY!
My dear friends,
EURUSD looks like it will make a good move, and here are the details:
The market is trading on 1.1665 pivot level.
Bias - Bullish
Technical Indicators: Supper Trend generates a clear long signal while Pivot Point HL is currently determining the overall Bullish trend of the market.
Goal - 1.1728
About Used Indicators:
Pivot points are a great way to identify areas of support and resistance, but they work best when combined with other kinds of technical analysis
Disclosure: I am part of Trade Nation's Influencer program and receive a monthly fee for using their TradingView charts in my analysis.
———————————
WISH YOU ALL LUCK

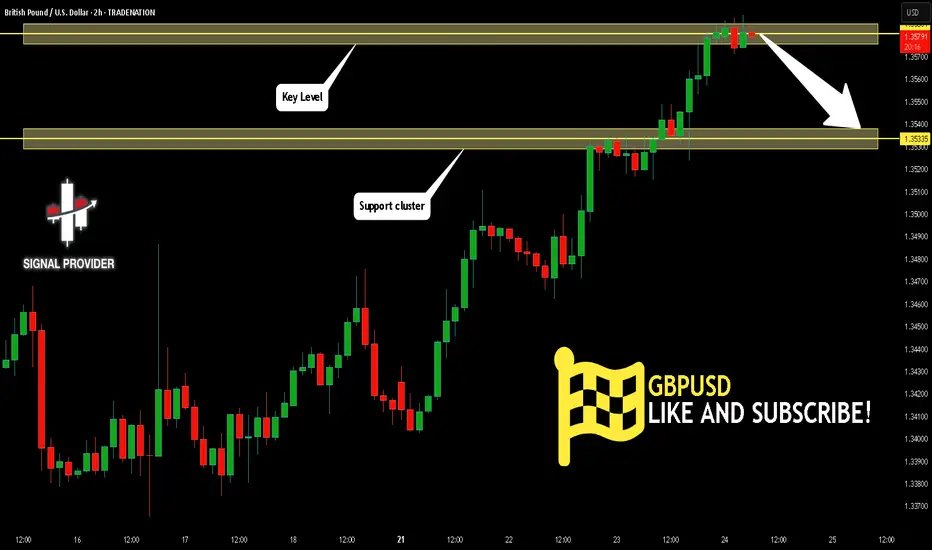
GBPUSD Will Go Lower! Short!
Take a look at our analysis for GBPUSD.
Time Frame: 2h
Current Trend: Bearish
Sentiment: Overbought (based on 7-period RSI)
Forecast: Bearish
The price is testing a key resistance 1.358.
Taking into consideration the current market trend & overbought RSI, chances will be high to see a bearish movement to the downside at least to 1.353 level.
P.S
The term oversold refers to a condition where an asset has traded lower in price and has the potential for a price bounce.
Overbought refers to market scenarios where the instrument is traded considerably higher than its fair value. Overvaluation is caused by market sentiments when there is positive news.
Disclosure: I am part of Trade Nation's Influencer program and receive a monthly fee for using their TradingView charts in my analysis.
Like and subscribe and comment my ideas if you enjoy them!
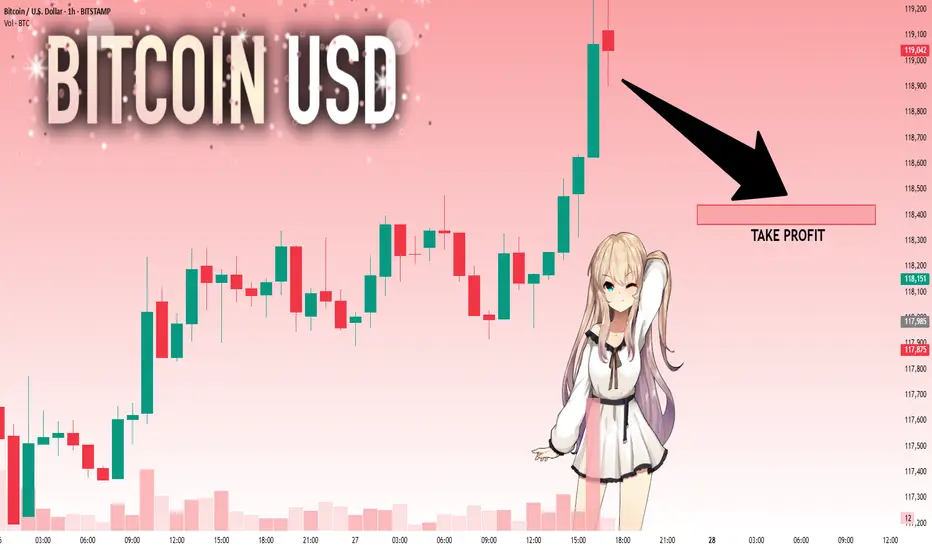
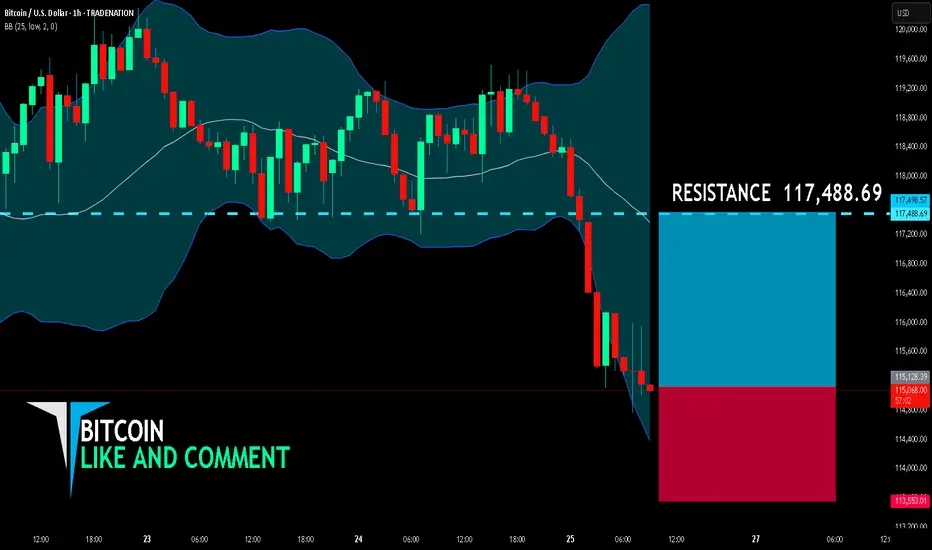
BITCOIN BULLS ARE GAINING STRENGTH|LONG
BITCOIN SIGNAL
Trade Direction: long
Entry Level: 115,128.39
Target Level: 117,488.69
Stop Loss: 113,553.01
RISK PROFILE
Risk level: medium
Suggested risk: 1%
Timeframe: 1h
Disclosure: I am part of Trade Nation's Influencer program and receive a monthly fee for using their TradingView charts in my analysis.
✅LIKE AND COMMENT MY IDEAS✅
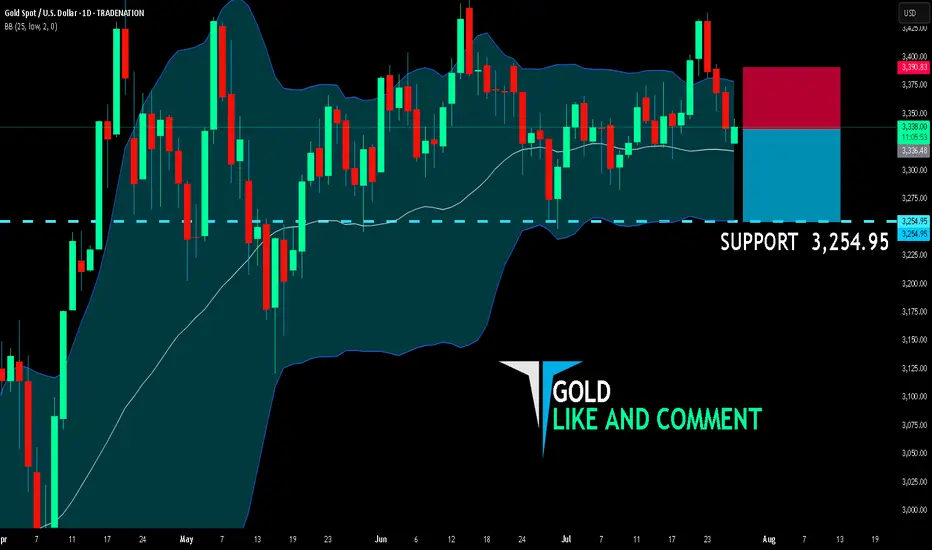
GOLD SENDS CLEAR BEARISH SIGNALS|SHORT
GOLD SIGNAL
Trade Direction: short
Entry Level: 3,336.48
Target Level: 3,254.95
Stop Loss: 3,390.83
RISK PROFILE
Risk level: medium
Suggested risk: 1%
Timeframe: 1D
Disclosure: I am part of Trade Nation's Influencer program and receive a monthly fee for using their TradingView charts in my analysis.
✅LIKE AND COMMENT MY IDEAS✅
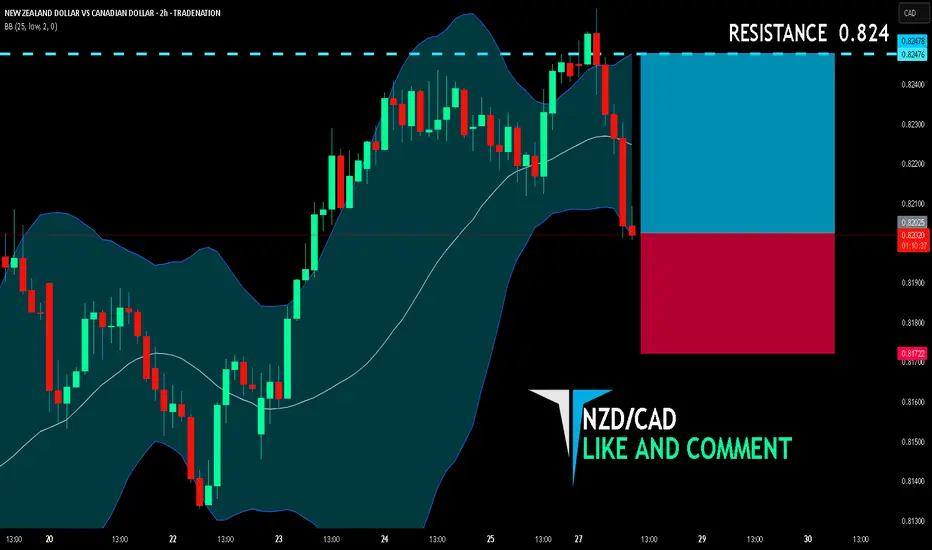
NZD/CAD BULLS ARE GAINING STRENGTH|LONG
NZD/CAD SIGNAL
Trade Direction: long
Entry Level: 0.820
Target Level: 0.824
Stop Loss: 0.817
RISK PROFILE
Risk level: medium
Suggested risk: 1%
Timeframe: 2h
Disclosure: I am part of Trade Nation's Influencer program and receive a monthly fee for using their TradingView charts in my analysis.
✅LIKE AND COMMENT MY IDEAS✅
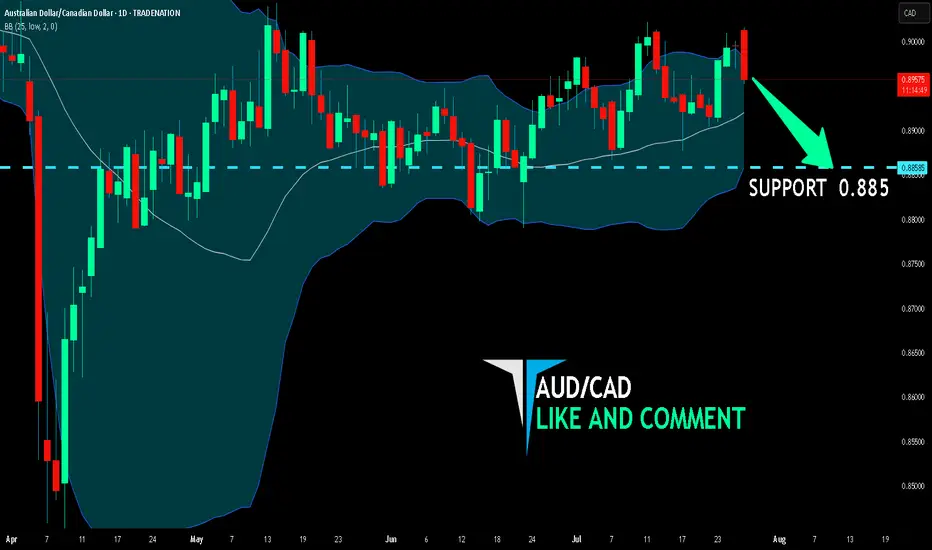
AUD/CAD SELLERS WILL DOMINATE THE MARKET|SHORT
Hello, Friends!
We are now examining the AUD/CAD pair and we can see that the pair is going up locally while also being in a uptrend on the 1W TF. But there is also a powerful signal from the BB upper band being nearby, indicating that the pair is overbought so we can go short from the resistance line above and a target at 0.885 level.
Disclosure: I am part of Trade Nation's Influencer program and receive a monthly fee for using their TradingView charts in my analysis.
✅LIKE AND COMMENT MY IDEAS✅
EURCHF: Classic Gap Trade 🇪🇺🇨🇭
There is a huge gap up opening on EURCHF.
The price tested a key intraday resistance with that and formed
a strong bearish imbalance candle then.
Probabilities will be high that the market will fill the gap today.
Goal - 0.9338
❤️Please, support my work with like, thank you!❤️

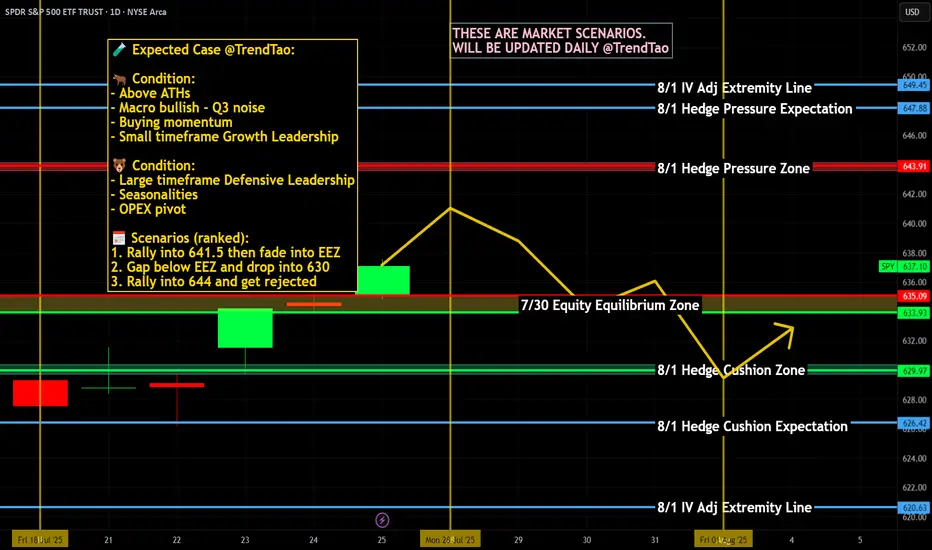
Weekly $SPY / $SPX Scenarios for July 28–August 1, 2025🔮 Weekly AMEX:SPY / SP:SPX Scenarios for July 28–August 1, 2025 🔮
🌍 Market‑Moving News 🌍
🏦 Fed Holds Steady, Faces Political Pressure
The Federal Reserve is expected to keep rates at 4.25%–4.50% during its FOMC meeting midweek. While rates are unchanged, political pressure from President Trump continues as calls intensify for rate cuts and questions arise over the Fed’s independence—including dissent from Governors Waller and Bowman.
📦 Trade Truce Extends & New Deal With EU
A new trade framework with the EU reduces tariffs to 15%, easing tensions. Meanwhile, U.S. and Chinese trade teams begin talks in Stockholm on Monday aiming to avoid an early-August tariff deadline.
💻 Tech and Mega-Cap Earnings Spotlight
This week features earnings from tech giants including Meta, Microsoft (Wednesday), followed by Amazon and Apple (Thursday). Markets will prioritize forward guidance around AI investments, capital expenditures, and sales trends.
📊 Key Data Releases & Events 📊
📅 Monday, July 28
No major releases
📅 Tuesday, July 29
Chicago PMI (July flash) – early indicator of regional manufacturing trends.
Global PMIs – flash readings for Europe and Asia gauge economic health.
📅 Wednesday, July 30
FOMC Rate Decision & Powell Press Conference – investors will scrutinize tone, forward guidance on rates, labor markets, and inflation.
Q2 U.S. GDP (Advance Estimate) – expected at ~1.9%, signaling rebound after Q1 contraction.
📅 Thursday, July 31
June PCE & Core PCE Indexes – Fed’s preferred inflation measure. Core PCE expected at ~2.7% YoY.
Consumer Confidence (July) – key for household spending trends.
Trade Balance (June) – provides data on U.S. import/export dynamics.
📅 Friday, August 1
July Nonfarm Payrolls, Unemployment & Wage Data – forecast for ~102,000 new jobs and ~4.2% unemployment; markets await for labor-market cooling signs.
Tariff Deadline – new tariffs loom unless trade agreements with EU, Canada, China etc. materialize by today’s cutoff.
⚠️ Disclaimer:
This summary is educational and informational only. It is not financial advice. Always consult a licensed financial advisor before making any investment decisions.
📌 #trading #stockmarket #economy #Fed #earnings #inflation #tariffs #GDP #PCE #jobs #technicalanalysis
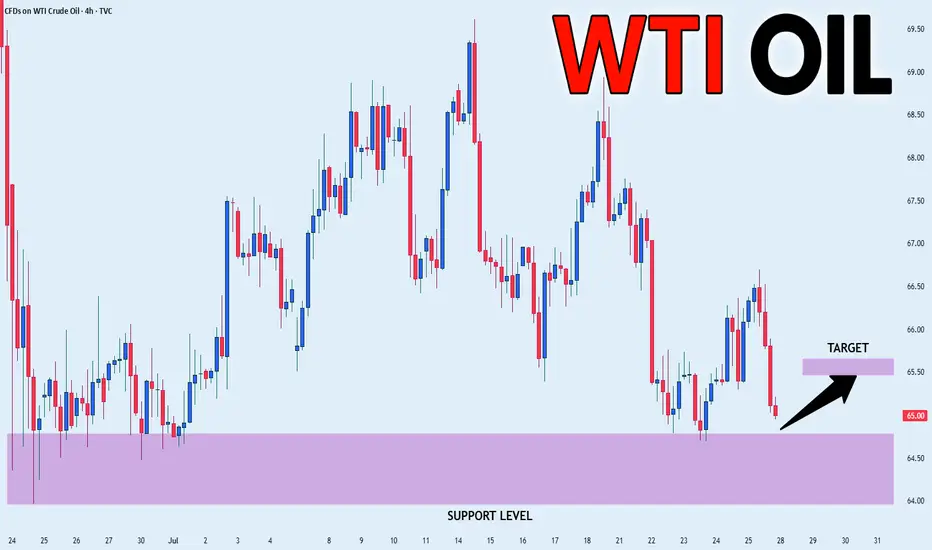
CRUDE OIL REBOUND AHEAD|LONG|
✅CRUDE OIL is going down now
But a strong support level is ahead at 64.69$
Thus I am expecting a rebound
And a move up towards the target of 65.50$
LONG🚀
✅Like and subscribe to never miss a new idea!✅
Disclosure: I am part of Trade Nation's Influencer program and receive a monthly fee for using their TradingView charts in my analysis.
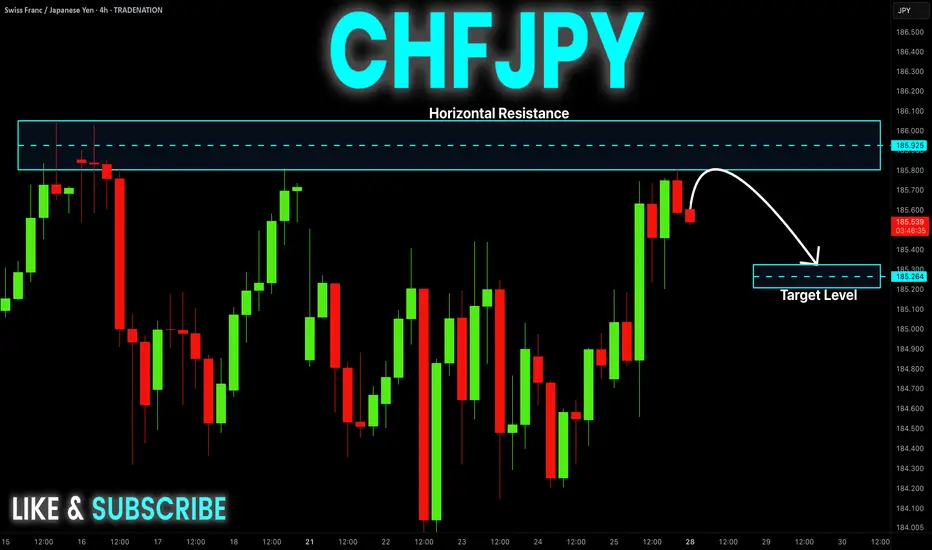
CHF-JPY Short From Resistance! Sell!
Hello,Traders!
CHF-JPY keeps trading in
An uptrend and the pair
Is locally overbought so after
The pair hits the horizontal
Resistance level of 186.000
We will be expecting a local
Bearish correction
Sell!
Comment and subscribe to help us grow!
Check out other forecasts below too!
Disclosure: I am part of Trade Nation's Influencer program and receive a monthly fee for using their TradingView charts in my analysis.
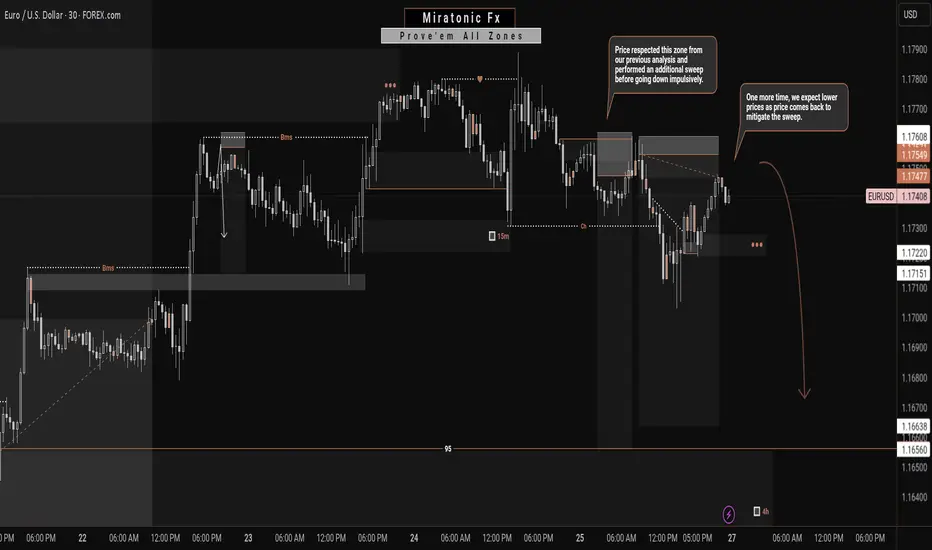
EURUSD: A Bearish Continuation?From my previous analysis, we anticipated a short-term decline on the EURUSD for a Daily bearish pullback. Price respected our zone and made a even stronger sweep before plummeting as forecasted.
Currently, price has returned to mitigate that liquidity sweep. Given the prior impulsive bearish move—which this current bullish correction stems from—we expect another drop, targeting the weak structure below for a potential liquidity grab or continuation.
We'll continue to monitor how price behaves around the current levels, but unless there's a significant shift in momentum, our bearish outlook remains valid. ✅
Follow us for more updates. 🔔
See you on the next one. 🫡
AUDUSD 4Hour TF - July 27th, 2025AUDUSD 7/27/2025
AUDUSD 4hour Bullish idea
Monthly - Bearish
Weekly - Bearish
Dailly - Bullish
4hour - Bullish
AUDUSD is holding steady in this weekly channel but has been showing signs of high volume ranging over the last month. Going into this week we’re looking mostly bullish but we have some minor zones that could slow price action down.
Here are two scenarios we are looking out for, for the week ahead:
Bullish Continuation - This is our ideal scenario as we want the trend to continue so we can have the best quality trade. For us to get comfortable going long AU we need to see structure above our 0.65800 zone. We want to see price action use this zone as support and establish structure (the next higher low).
If this happens we can look to target higher toward major resistance levels and key fib levels.
Bearish Reversal into range - If we fail to see bullish conviction at the current zone it’s possible price action will fall back into the range. This is a likely scenario as we have seen price action bounce between 0.65800 and 0.65000 multiple times over the last month.
I wouldn’t recommend trading this scenario as I don’t like trading ranges but we could see price action head lower to 0.65000.

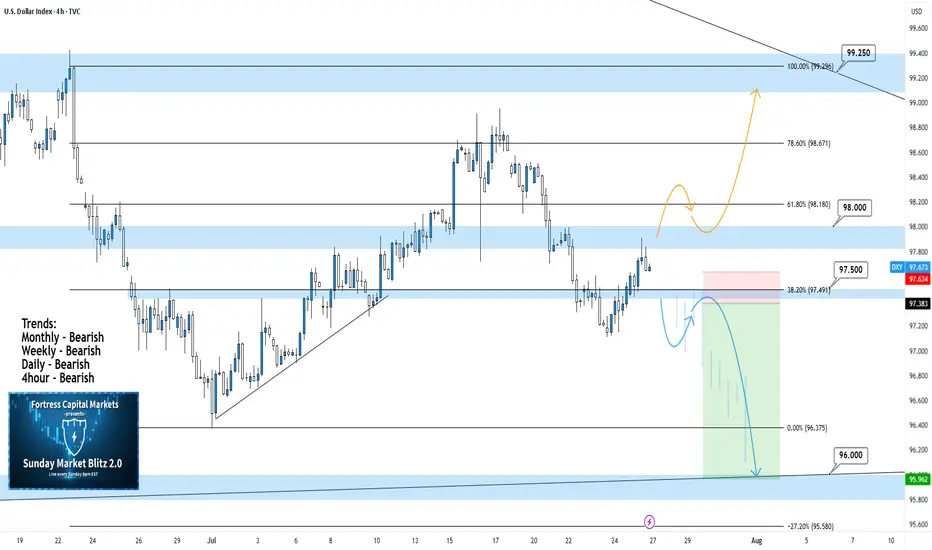
DXY 4Hour TF - July 27, 2025DXY 7/27/2025
DXY 4hour Bearish Idea
Monthly - Bearish
Weekly - Bearish
Dailly - Bearish
4hour - Bearish
**We analyze DXY as an indicator of USD strength on a week to week basis**
This week is looking like we can expect bearish momentum on USD but here are two scenarios breaking down the potential:
Bearish Continuation - USD pulled a strong bearish reversal all last week which pushed us below our major 98.000 support zone.
We are now testing that same 98.000 zone as resistance and are looking to see if it will hold. Ideally, we can confirm further bearish structure to gain confidence in a bearish USD for the week ahead.
Bullish Reversal- For us to consider DXY as bullish again we would need to see bullish structure above our 98.000 zone. This would include: A break back above 98.000 with an established HH and HL.
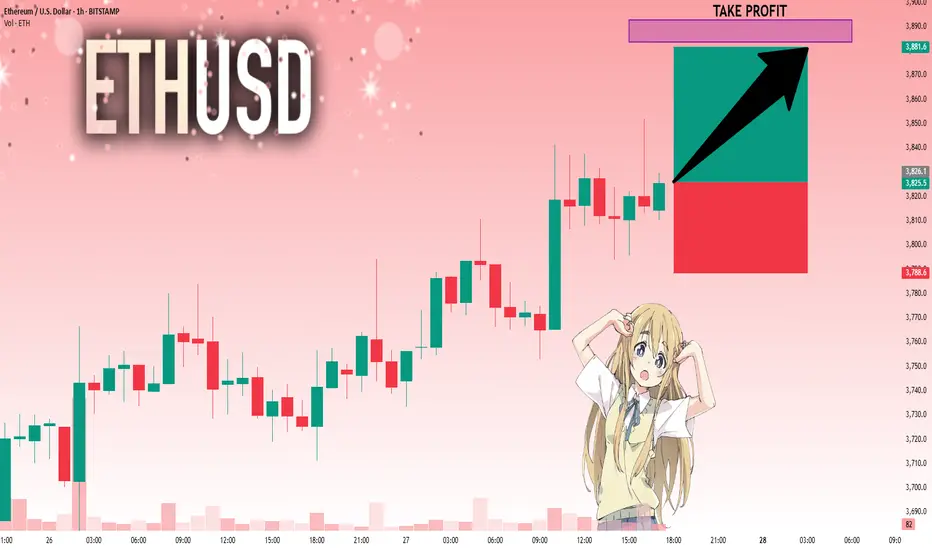
ETHUSD: Strong Bullish Sentiment! Long!
My dear friends,
Today we will analyse ETHUSD together☺️
The recent price action suggests a shift in mid-term momentum. A break above the current local range around 3,826.1 will confirm the new direction upwards with the target being the next key level of 3,883.6 and a reconvened placement of a stop-loss beyond the range.
❤️Sending you lots of Love and Hugs❤️
BTCUSD: Bears Are Winning! Short!
My dear friends,
Today we will analyse BTCUSD together☺️
The in-trend continuation seems likely as the current long-term trend appears to be strong, and price is holding below a key level of 118,973 So a bearish continuation seems plausible, targeting the next low. We should enter on confirmation, and place a stop-loss beyond the recent swing level.
❤️Sending you lots of Love and Hugs❤️