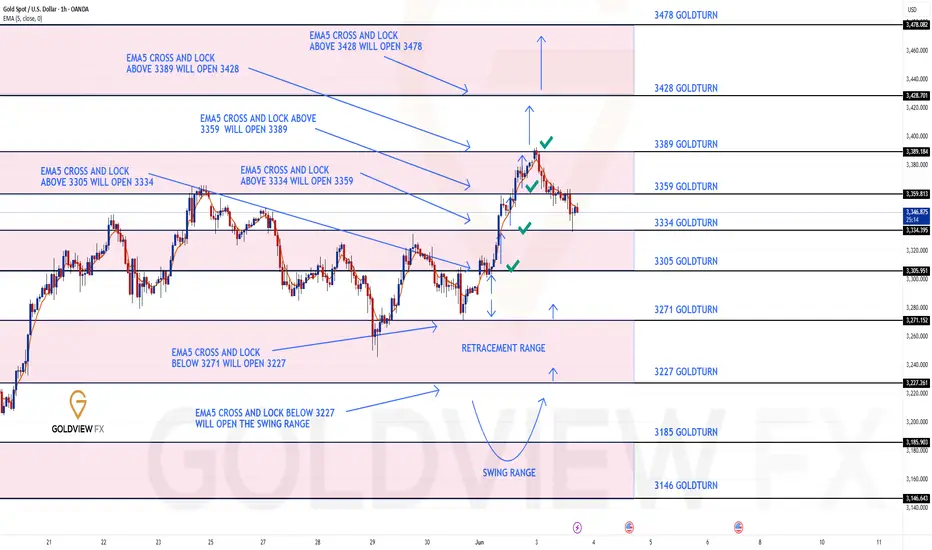
GOLD 1H CHART ROUTE MAP UPDATEHey Everyone,
As anticipated, the market structure continues to respect our key levels and EMA5 dynamics to the letter.
After the clean bounce from 3334 into 3359, price did indeed push back toward 3389 for the retest, just as outlined. Once again ema5 failed to cross and lock above 3389, confirming rejection again. It’s important to highlight that price did retest 3389 exactly as projected, completing the range once again.
Crucially, no further EMA5 cross and lock above 3389 was seen, reconfirming the rejection and driving price back into the lower Goldturns, which we will now look for support and bounce off these levels.
The structure continues to unfold with precision, showing once again how effective our level based framework is when paired with EMA5 confirmations. This setup keeps us well aligned with market momentum.
As always, we remain focused and continue to buy dips using our support levels, capturing those 20 to 40 pip opportunities. As we’ve proven time and again, each level gives enough of a bounce for a quality entry and exit.
We encourage everyone to backtest our levels, we’ve shared them weekly for the past 3 years , and the data speaks for itself. These levels continue to work brilliantly with both short/mid term trends and countertrends.
BULLISH TARGET 3305 – ✅ DONE
EMA5 CROSS AND LOCK ABOVE 3305 WILL OPEN THE FOLLOWING BULLISH TARGETS
3334 – ✅ DONE
3359 – ✅ DONE
3389 – ✅ DONE (retested as forecasted)
EMA5 CROSS AND LOCK ABOVE 3389 WILL OPEN THE FOLLOWING BULLISH TARGET
3428
EMA5 CROSS AND LOCK ABOVE 3428 WILL OPEN THE FOLLOWING BULLISH TARGET
3478
BEARISH TARGETS 3271
EMA5 CROSS AND LOCK BELOW 3271 WILL OPEN THE FOLLOWING BEARISH TARGET
3227
EMA5 CROSS AND LOCK BELOW 3227 WILL OPEN THE SWING RANGE
3185
3146
Stay sharp, manage risk, and trust the levels. We’ll continue providing updates as the structure develops further.
Thank you again for all your likes, comments, and continued support.
Mr Gold
GoldViewFX
Tradingideas
BEST XAUUSD M30 BUY AND SELL SUTUP FOR TODAY📊 Gold is currently showing bullish strength with a break above key structure levels and multiple CHoCH confirmations. Price is approaching a weak high near 3,392, which may act as a liquidity target before potential reversal. 🔄 After sweeping this high, a bearish move could unfold, aiming for the demand zones between 3,350–3,333 where buyers may step back in. 🧠 Traders should prepare for a liquidity grab scenario, with bullish continuation likely invalidated if price closes below the strong demand. ⚠️ Watch price action closely near the weak high and key imbalance zones. 🚀🔁📉

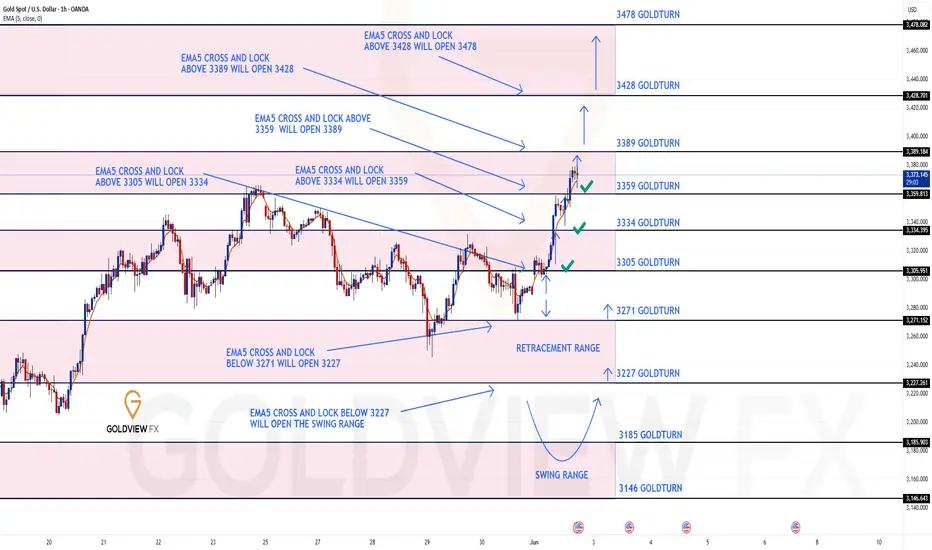
GOLD ROUTE MAP UPDATEHey Everyone,
Another powerful day in the markets with our chart idea unfolding exactly as anticipated.
In yesterday’s update, we highlighted that all our targets 3305, 3334, and 3359 were hit following the EMA5 cross and lock confirmation. We also pointed out the EMA5 lock above 3359, opening a clear gap to 3389, which was also hit perfectly. The absence of a further EMA5 lock above confirmed a precise rejection, sending price back down into the lower Goldturns for support, just as projected. We then had the bounce off the 3334 level, another clean reaction, just like we stated.
Now today, after testing and bouncing from 3334 into 3359, price is now charging back toward 3389 for a potential retest, as that level remains open once again.
The structure is playing out beautifully, we will stick to the plan, and manage risk wisely.
We will continue to buy dips using our support levels taking 20 to 40 pips and track the movement with ema5 lock or rejection. As stated before each of our level structures give 20 to 40 pip bounces, which is enough for a nice entry and exit. If you back test the levels we shared every week for the past 24 months, you can see how effectively they were used to trade with or against short/mid term swings and trends.
The swing range give bigger bounces then our weighted levels that's the difference between weighted levels and swing ranges.
BULLISH TARGET
3305 - DONE
EMA5 CROSS AND LOCK ABOVE 3305 WILL OPEN THE FOLLOWING BULLISH TARGETS
3334 - DONE
EMA5 CROSS AND LOCK ABOVE 3334 WILL OPEN THE FOLLOWING BULLISH TARGET
3359 - DONE
EMA5 CROSS AND LOCK ABOVE 3359 WILL OPEN THE FOLLOWING BULLISH TARGET
3389 - DONE
EMA5 CROSS AND LOCK ABOVE 3389 WILL OPEN THE FOLLOWING BULLISH TARGET
3428
EMA5 CROSS AND LOCK ABOVE 3428 WILL OPEN THE FOLLOWING BULLISH TARGET
3478
BEARISH TARGETS
3271
EMA5 CROSS AND LOCK BELOW 3271 WILL OPEN THE FOLLOWING BEARISH TARGET
3227
EMA5 CROSS AND LOCK BELOW 3227 WILL OPEN THE SWING RANGE
3185
3146
As always, we will keep you all updated with regular updates throughout the week and how we manage the active ideas and setups. Thank you all for your likes, comments and follows, we really appreciate it!
Mr Gold
GoldViewFX
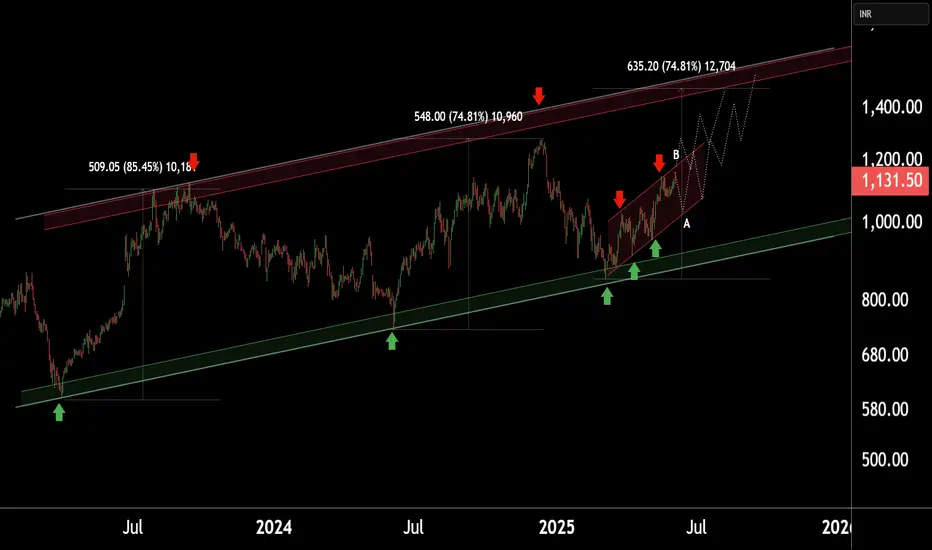
PIRAMAL ENTERPRISES LTDThis is the Weekly Chart of PEL !!
PEl is moving in an Ascending Channel pattern on the weekly chart.
PEL is following a HH–HL structure in the channel in Daily chart support at 1040-1050 range, confirming a bullish trend continuation.
Based on historical price behavior, the stock has
previously delivered a 74% return from its swing low, reaching the 1500–1520 range.
Thank You!!
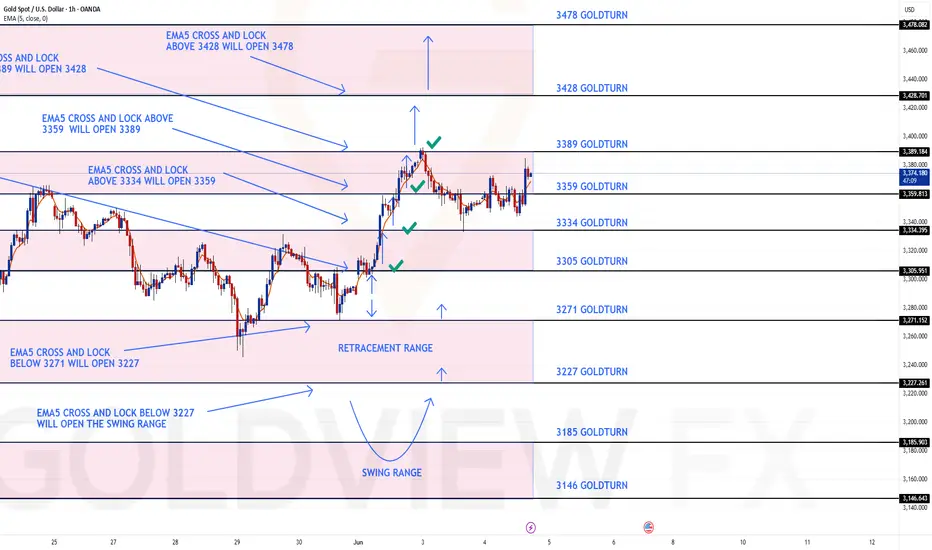
GOLD ROUTE MAP UPDATEHey Everyone,
Another powerful day in the markets with our chart idea unfolding exactly as anticipated.
In yesterday’s update, we highlighted that all our targets, 3305, 3334, and 3359 were hit following the EMA5 cross and lock confirmation. We also pointed out the EMA5 lock above 3359, now left 3389 open.
✅ Today, that 3389 level was hit to perfection.
The absence of a further EMA5 lock above confirmed a precise rejection, sending price back down into the lower Goldturns for support and bounce inline with our plans to buy dips.
We will continue to buy dips using our support levels taking 20 to 40 pips and track the movement with ema5 lock or rejection. As stated before each of our level structures give 20 to 40 pip bounces, which is enough for a nice entry and exit. If you back test the levels we shared every week for the past 24 months, you can see how effectively they were used to trade with or against short/mid term swings and trends.
The swing range give bigger bounces then our weighted levels that's the difference between weighted levels and swing ranges.
BULLISH TARGET
3305 - DONE
EMA5 CROSS AND LOCK ABOVE 3305 WILL OPEN THE FOLLOWING BULLISH TARGETS
3334 - DONE
EMA5 CROSS AND LOCK ABOVE 3334 WILL OPEN THE FOLLOWING BULLISH TARGET
3359 - DONE
EMA5 CROSS AND LOCK ABOVE 3359 WILL OPEN THE FOLLOWING BULLISH TARGET
3389 - DONE
EMA5 CROSS AND LOCK ABOVE 3389 WILL OPEN THE FOLLOWING BULLISH TARGET
3428
EMA5 CROSS AND LOCK ABOVE 3428 WILL OPEN THE FOLLOWING BULLISH TARGET
3478
BEARISH TARGETS
3271
EMA5 CROSS AND LOCK BELOW 3271 WILL OPEN THE FOLLOWING BEARISH TARGET
3227
EMA5 CROSS AND LOCK BELOW 3227 WILL OPEN THE SWING RANGE
3185
3146
As always, we will keep you all updated with regular updates throughout the week and how we manage the active ideas and setups. Thank you all for your likes, comments and follows, we really appreciate it!
Mr Gold
GoldViewFX
GOLD ROUTE MAP UPDATEHey Everyone,
Great start to the week with our chart idea playing out as analysed.
We started the day with our Bullish target hit at 3305 followed with ema5 cross and lock confirmation for 3334, which was hit perfectly with a further lock opening 3359 also completed.
We now have a cross and lock above 3359 opening 3389. We will continue to track the movement using cross and lock and any rejections on the levels will see price test the lower Goldturns for support and bounce.
We will keep the above in mind when taking buys from dips. Our updated levels and weighted levels will allow us to track the movement down and then catch bounces up.
We will continue to buy dips using our support levels taking 20 to 40 pips. As stated before each of our level structures give 20 to 40 pip bounces, which is enough for a nice entry and exit. If you back test the levels we shared every week for the past 24 months, you can see how effectively they were used to trade with or against short/mid term swings and trends.
The swing range give bigger bounces then our weighted levels that's the difference between weighted levels and swing ranges.
BULLISH TARGET
3305 - DONE
EMA5 CROSS AND LOCK ABOVE 3305 WILL OPEN THE FOLLOWING BULLISH TARGETS
3334 - DONE
EMA5 CROSS AND LOCK ABOVE 3334 WILL OPEN THE FOLLOWING BULLISH TARGET
3359 - DONE
EMA5 CROSS AND LOCK ABOVE 3359 WILL OPEN THE FOLLOWING BULLISH TARGET
3389
EMA5 CROSS AND LOCK ABOVE 3389 WILL OPEN THE FOLLOWING BULLISH TARGET
3428
EMA5 CROSS AND LOCK ABOVE 3428 WILL OPEN THE FOLLOWING BULLISH TARGET
3478
BEARISH TARGETS
3271
EMA5 CROSS AND LOCK BELOW 3271 WILL OPEN THE FOLLOWING BEARISH TARGET
3227
EMA5 CROSS AND LOCK BELOW 3227 WILL OPEN THE SWING RANGE
3185
3146
As always, we will keep you all updated with regular updates throughout the week and how we manage the active ideas and setups. Thank you all for your likes, comments and follows, we really appreciate it!
Mr Gold
GoldViewFX
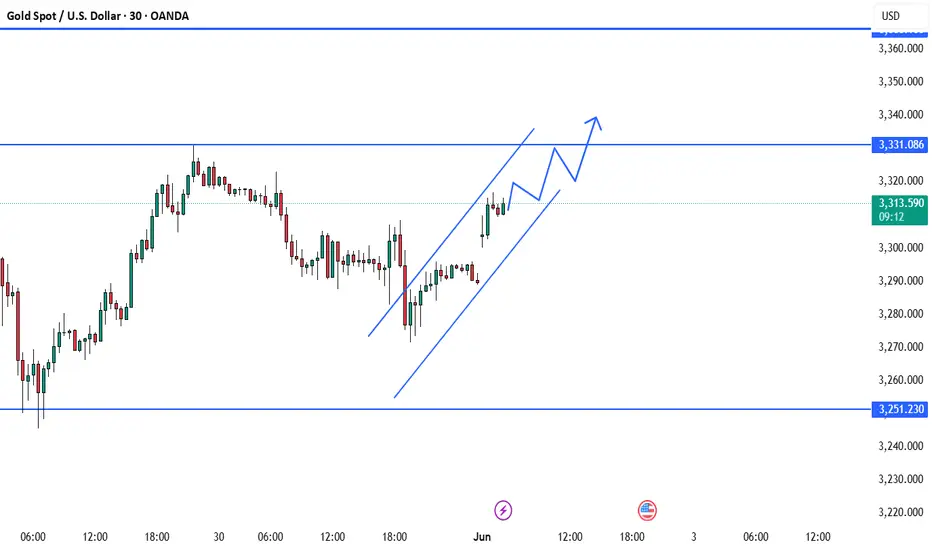
BEST XAUUSD M30 BUY SETUP FOR TODAY 📈 Gold (XAU/USD) is showing bullish momentum on the 30-min chart, trading within a rising parallel channel. Price has recently bounced from lower support and is aiming for the resistance zone near $3,331. 🔼 A breakout above this level could signal further upside, continuing the bullish wave structure. Traders should watch for pullbacks to the lower trendline as potential buying opportunities. 🧠💡 As long as price stays above the $3,251 support, the bullish bias remains intact. 📊✨
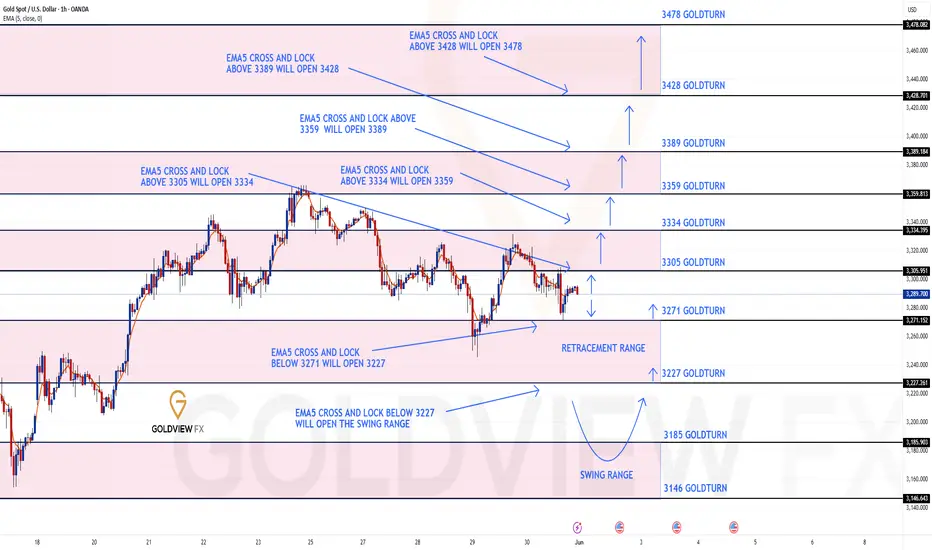
GOLD 1H CHART ROUTE MAP UPDATE & TRADING PLAN FOR THE WEEKHey Everyone,
Please see our updated 1h chart levels and targets for the coming week.
We are seeing price play between two weighted levels with a gap above at 3305 and a gap below at 3271. We will need to see ema5 cross and lock on either weighted level to determine the next range.
We will see levels tested side by side until one of the weighted levels break and lock to confirm direction for the next range.
We will keep the above in mind when taking buys from dips. Our updated levels and weighted levels will allow us to track the movement down and then catch bounces up.
We will continue to buy dips using our support levels taking 20 to 40 pips. As stated before each of our level structures give 20 to 40 pip bounces, which is enough for a nice entry and exit. If you back test the levels we shared every week for the past 24 months, you can see how effectively they were used to trade with or against short/mid term swings and trends.
The swing range give bigger bounces then our weighted levels that's the difference between weighted levels and swing ranges.
BULLISH TARGET
3305
EMA5 CROSS AND LOCK ABOVE 3305 WILL OPEN THE FOLLOWING BULLISH TARGETS
3334
EMA5 CROSS AND LOCK ABOVE 3334 WILL OPEN THE FOLLOWING BULLISH TARGET
3359
EMA5 CROSS AND LOCK ABOVE 3359 WILL OPEN THE FOLLOWING BULLISH TARGET
3389
EMA5 CROSS AND LOCK ABOVE 3389 WILL OPEN THE FOLLOWING BULLISH TARGET
3428
EMA5 CROSS AND LOCK ABOVE 3428 WILL OPEN THE FOLLOWING BULLISH TARGET
3478
BEARISH TARGETS
3271
EMA5 CROSS AND LOCK BELOW 3271 WILL OPEN THE FOLLOWING BEARISH TARGET
3227
EMA5 CROSS AND LOCK BELOW 3227 WILL OPEN THE SWING RANGE
3185
3146
As always, we will keep you all updated with regular updates throughout the week and how we manage the active ideas and setups. Thank you all for your likes, comments and follows, we really appreciate it!
Mr Gold
GoldViewFX
GOLD 4H CHART ROUTE MAP UPDATE & TRADING PLAN FOR THE WEEKHey Everyone,
Please see our updated 4h chart levels and targets for the coming week.
We are seeing price play between two weighted levels with a gap above at 3314 and a gap below at 3248. We will need to see ema5 cross and lock on either weighted level to determine the next range.
We will see levels tested side by side until one of the weighted levels break and lock to confirm direction for the next range.
We will keep the above in mind when taking buys from dips. Our updated levels and weighted levels will allow us to track the movement down and then catch bounces up.
We will continue to buy dips using our support levels taking 20 to 40 pips. As stated before each of our level structures give 20 to 40 pip bounces, which is enough for a nice entry and exit. If you back test the levels we shared every week for the past 24 months, you can see how effectively they were used to trade with or against short/mid term swings and trends.
The swing range give bigger bounces then our weighted levels that's the difference between weighted levels and swing ranges.
BULLISH TARGET
3314
EMA5 CROSS AND LOCK ABOVE 3314 WILL OPEN THE FOLLOWING BULLISH TARGETS
3363
EMA5 CROSS AND LOCK ABOVE 3363 WILL OPEN THE FOLLOWING BULLISH TARGET
3412
EMA5 CROSS AND LOCK ABOVE 3412 WILL OPEN THE FOLLOWING BULLISH TARGET
3468
BEARISH TARGETS
3248
EMA5 CROSS AND LOCK BELOW 3248 WILL OPEN THE FOLLOWING BEARISH TARGET
3194
EMA5 CROSS AND LOCK BELOW 3194 WILL OPEN THE SWING RANGE
3130
3077
EMA5 CROSS AND LOCK BELOW 3077 WILL OPEN THE SECONDARY SWING RANGE
3012
2988
As always, we will keep you all updated with regular updates throughout the week and how we manage the active ideas and setups. Thank you all for your likes, comments and follows, we really appreciate it!
Mr Gold
GoldViewFX

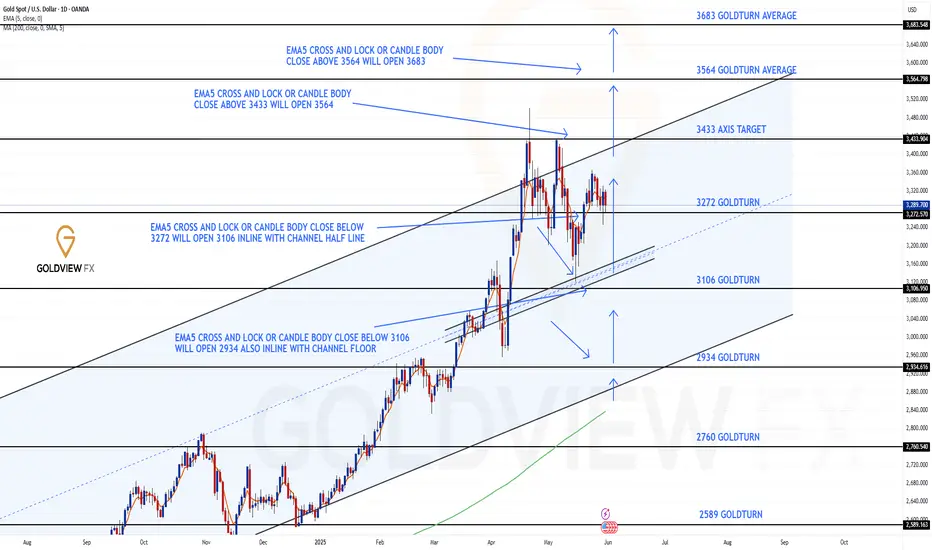
GOLD DAILY CHART ROUTE MAPHey Everyone,
Here's an update on the daily chart setup we've been tracking and trading successfully over the past few weeks.
As anticipated, price action rejected off the midline of the channel and produced a strong bounce, exactly as we had analysed. This move reached the 3272 Goldturn level and closed above it, opening the path for a potential test of the channel top near 3433. We captured a solid move of over 600 pips, aligning perfectly with our strategy of buying the dips for the ideal swing setup.
The channel half line continued to provide support and bounces, with a gap left above at 3433. Our channel top also falls in line with this level.
Please note that the gap remains open, but we are not looking to chase from the top. We'll continue to focus on buying pullbacks for better entries.
This is the beauty of our Goldturn channels, drawn using weighted averages instead of pure price action. This unique approach helps us clearly identify fake outs and real breakouts, cutting out much of the noise that usually confuses traders.
Moving forward, we’ll focus on smaller timeframes (1H and 4H) to buy dips off the weighted Goldturns, aiming for clean 30–40 pip moves. Ranging markets are perfect for this style, allowing us to capitalise on quick moves without getting caught in the chop of larger swings.
Thank you all again for your continued likes, comments, and follows, we truly appreciate your support!
Mr Gold
GoldViewFX
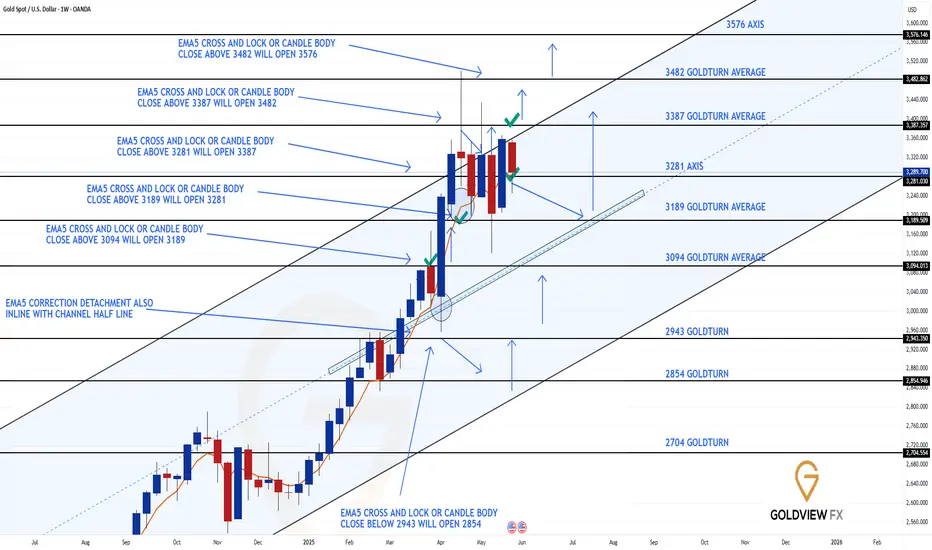
GOLD WEEKLY CHART MID/LONG TERM ROUTE MAPHey Everyone,
Here’s our latest weekly chart update. Once again, the Goldturn Channel continues to prove its reliability, with price action unfolding just as anticipated.
Last update on this chart, we noted multiple failed attempts to break above the channel top, each confirmed by the EMA5 being unable to close through resistance. This led to a pullback as low as 3189, nearly touching the 3094 level right near the channel's half line, a key support zone we've been closely monitoring.
This week, we saw the rejection from the channel top. The channel top gave the rejection into the lower 3281 axis level. Despite the drop, there was no close below 3281, which has provided continuous bounces on the smaller timeframes. Price action is now playing between the 3281 level and the channel top.
We’ll be watching closely for a decisive break on either side to determine the next directional move. The 3387 gap also remains open and in play.
As long as price remains above the channel half line and especially now above 3281, we will continue looking for dip buying opportunities on retracements, using our intraday levels for targeted 20 to 40 pip moves. If the price pulls back below these key levels, we’ll reassess for potential downside toward the lower boundary of the channel.
This is exactly why we stick with our Goldturn Channel methodology, our proprietary system based on weighted averages. It cuts through the market noise, distinguishes real breakouts from fake outs, and empowers us to trade with confidence and clarity.
Thanks again for your continued support, your likes, comments, and follows mean a lot.
MR GOLD
GOLDVIEWFX
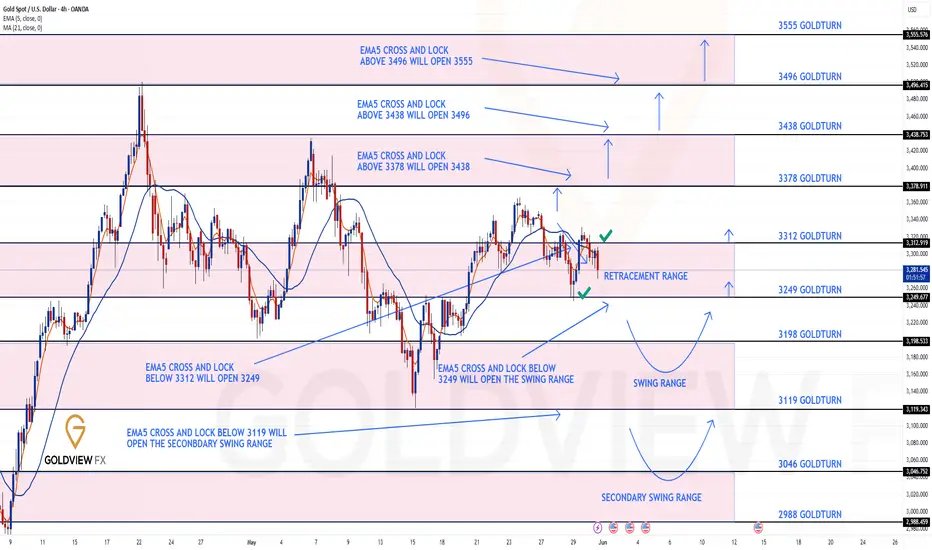
GOLD 4H CHART ROUTE MAP UPDATEHey Everyone,
Great way to wrap up the week! We saw quite a bit of sideways ranging movement between our levels, and our 1H chart idea played out nicely throughout the week, and now we end the week with our 4H chart update.
As anticipated, the 4H chart followed through perfectly with our bearish target at 3312 hit first, followed by EMA5 cross and lock, which opened the Retracement Range. This range was reached with precision, and the absence of any further cross and lock confirmed strong support, leading to a bounce back to 3312, just as we expected in our buy the dip strategy.
We’ll be back on Sunday with our multi-timeframe analysis and trading plans for the week ahead. Thanks again for all your likes, comments, and follows.
Wishing you all a fantastic weekend!!
MR GOLD
GOLD ROUTE MAP UPDATEHey Everyone,
Please see update on our 1H chart route map from yesterday.
Another great day on the charts with our analysis playing out like we said.
Yesterday we stated; no EMA5 lock above 3317, forcing a rejection back to the retracement range.
We then stated that we are expecting continued reactions within this retracement range, inline with our plans to buy dips. Our updated levels and weighted levels help us track downward movements and catch bounce setups.
- This played out perfectly with the reaction from the retracement range into 3317. We will now look for a lock above this level for a continuation or failure to lock will follow with a rejection back into the lower Goldturns for support and bounce.
We'll continue to buy dips using our key support levels, targeting 20 to 40 pip moves. As always, each level structure provides consistent bounce zones, offering great opportunities for both entry and exit. If you backtest the levels we’ve shared every week over the past 24 months, you’ll see how effectively they work with or against short to mid term swings and trends.
Remember:
Swing ranges yield bigger bounces than weighted levels — that’s the key difference.
BULLISH TARGET
3389
EMA5 CROSS AND LOCK ABOVE 3389 WILL OPEN THE FOLLOWING BULLISH TARGETS
3428
EMA5 CROSS AND LOCK ABOVE 3428 WILL OPEN THE FOLLOWING BULLISH TARGET
3478
EMA5 CROSS AND LOCK ABOVE 3478 WILL OPEN THE FOLLOWING BULLISH TARGET
3517
BEARISH TARGETS
3352 - DONE
EMA5 CROSS AND LOCK BELOW 3352 WILL OPEN THE FOLLOWING BEARISH TARGET
3317 - DONE
EMA5 CROSS AND LOCK BELOW 3317 WILL OPEN THE FOLLOWING BEARISH TARGET
3282
EMA5 CROSS AND LOCK BELOW 3282 WILL OPEN THE FOLLOWING BEARISH TARGET
3233
EMA5 CROSS AND LOCK BELOW 3233 WILL OPEN THE SWING RANGE
3185
3146
As always, we’ll keep you all updated with real time analysis and management of active setups throughout the week. Thank you for your continued support, your likes, comments, and follows mean a lot!
Mr Gold
GoldViewFX

#XRP MARKET STRUCTURE | DAILY OUTLOOK | MAY 2025📊 *XRP - Strong Support & Breakout Watch | Daily Timeframe*
XRP is currently holding above a major support zone around the 102B market cap level. Price has shown multiple rejections from this zone, indicating strong buying interest.
🔹 *Key Levels:*
- *Support Zone:* 102B (Strong Demand Area)
- *Resistance Zone:* 147B (Breakout Level)
📈 *Market Structure:*
Price is forming a potential accumulation pattern. If this structure holds, we might see a bullish reversal towards the resistance, followed by a possible breakout.
📌 *Bullish Scenario:*
- Bounce from support
- Retest of previous high
- Breakout above resistance
📌 *Invalidation:*
- If price closes below 102B support zone, setup may fail and a deeper drop could follow.
🧠 *Note:* This is not financial advice. Always do your own analysis before trading.
#XRP #CryptoAnalysis #TechnicalAnalysis #Breakout #SupportResistance

GOLD (XAUUSD) Full Analysis – MMC Strategy in Action + Target🧠 What is Mirror Market Concepts (MMC)?
MMC is a psychological and technical framework that interprets market movements as mirrors of past behaviors, often using curves, rays, and emotional imprints to forecast price flow. It assumes that price reacts not just to levels but to memory zones left by institutional actions.
🧭 Chart Overview and Interpretation
1. Black Mind Curve Resistance:
The black curved line represents a dynamic resistance zone where the market previously showed sensitivity.
It aligns with psychological levels where institutional interest faded, marking a high-probability rejection point.
Note the smooth arc — MMC suggests such curves reflect subconscious market resistance.
2. Blue Ray – Institutional Reaction Line:
The blue ray points to a previous impulsive reaction zone near 3,320, marking an emotional high.
Price sharply rejected this area again, creating a mirror rejection.
This symmetry is key in MMC — the present move is reflecting the structure of the past.
3. SR Interchange Zone (Support-turned-Resistance):
Around the 3,290 level, price previously bounced from this zone (demand), but it has now flipped to act as resistance.
This SR Interchange is significant in MMC as it represents a "mental switch" — demand has turned into fear-based supply.
4. Break of Market Structure + Retest:
A clean break below the short-term bullish trendline followed by a rejection retest confirms the shift in structure.
This breakdown confirms bears are in control for now.
The recent candles show clear rejection wicks from the retest zone.
🎯 Trade Plan (Bearish Setup)
Entry Zone:
🔹 Enter between 3,275 – 3,285, where price is rejecting the SR flip and mind curve.
Target Zone:
🎯 First TP: 3,250 (MMC Support Zone – highlighted in purple below)
🛑 Optional Second TP: 3,240 if momentum continues post-news event.
Stop Loss:
🔺 Above 3,300 to allow space for false spikes, just beyond the curve rejection zone.
📉 Why This Setup Works (Psychological Flow)
The current price action is mirroring the left side of the chart — the same way price impulsively rose from a zone, it's now impulsively falling back into it.
The rejection from the Black Curve and Blue Ray are not just technical — they are emotional resistance zones, meaning institutions remember the reaction.
This creates internal balance that MMC traders look to exploit, riding the memory of the market.
🔔 Risk Factors & Considerations
Watch for the USD-related news event on the calendar (noted on chart). If high-impact, it can cause volatility and short-term spikes.
If price breaks and holds above 3,300, the bearish idea becomes invalid — don’t fight the market.
🧵 MMC Concepts Highlighted in This Chart
Black Mind Curve Zone – Dynamic psychological resistance
Blue Ray – Emotional ray from institutional rejection
SR Interchange – Support becomes resistance
Mirror Symmetry – Price behavior is reflecting the past
Emotional Imprint Zones – Past reactions leave future footprints
🗨️ Community Call-to-Action (CTA)
💬 What’s your view on GOLD today? Are you using Mirror Market Concepts in your trading?
Drop your thoughts, charts, or alternate views below — let’s build solid MMC case studies together!

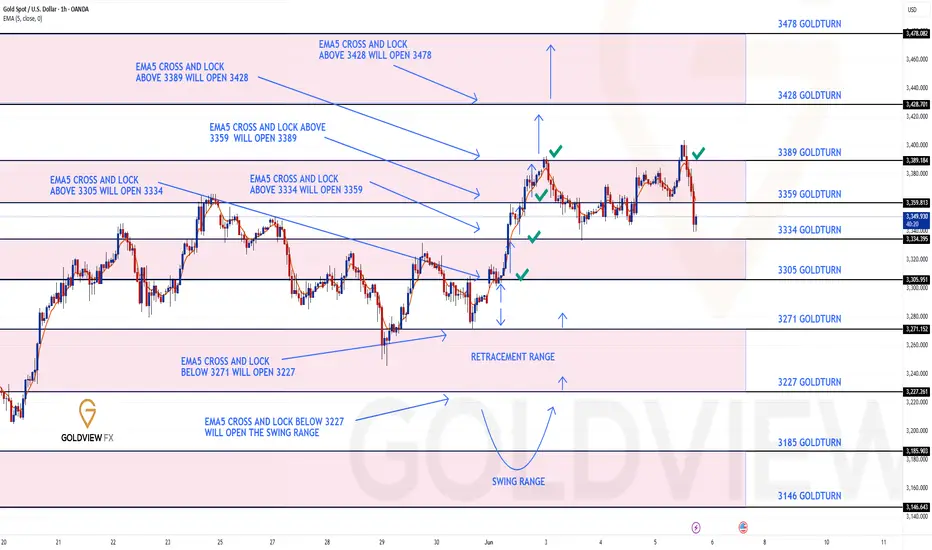
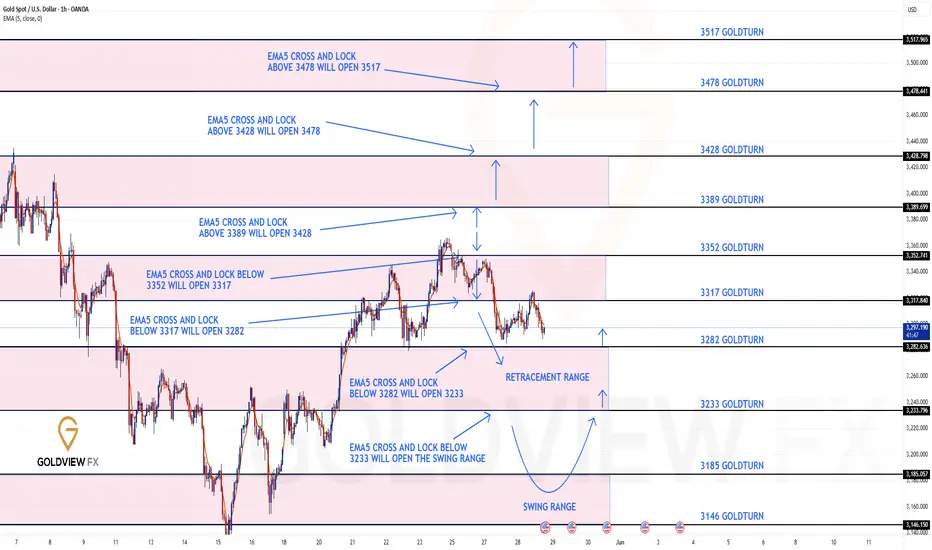
GOLD ROUTE MAP UPDATEHey Everyone,
Please see the update on our 1H chart route map - playing out exactly as analysed.
We started the week with a bearish gap at 3352 being hit, followed by an EMA5 cross and lock below 3352, which opened up the next level at 3317, also hit perfectly.
Yesterday, we found support above the 3282 retracement level, leading to a solid bounce into 3317. However, there was no EMA5 lock above 3317, and price faced rejection today once again, pushing it back toward 3282.
We are now looking for support to hold above 3282 to give us fresh bounce opportunities and upper Goldturn tests. However, a lock below 3282 will open up lower levels as we move deeper into the retracement range.
We are expecting continued reactions within this retracement range, in line with our plan to buy dips. Our updated levels and weighted levels help us track downward movements and catch bounce setups.
We'll continue to buy dips using our key support levels, targeting 20 to 40 pip moves. As always, each level structure provides consistent bounce zones, offering great opportunities for both entry and exit. If you backtest the levels we’ve shared every week over the past 24 months, you’ll see how effectively they work with or against short to mid term swings and trends.
Remember:
Swing ranges yield bigger bounces than weighted levels — that’s the key difference.
BULLISH TARGET
3389
EMA5 CROSS AND LOCK ABOVE 3389 WILL OPEN THE FOLLOWING BULLISH TARGETS
3428
EMA5 CROSS AND LOCK ABOVE 3428 WILL OPEN THE FOLLOWING BULLISH TARGET
3478
EMA5 CROSS AND LOCK ABOVE 3478 WILL OPEN THE FOLLOWING BULLISH TARGET
3517
BEARISH TARGETS
3352 - DONE
EMA5 CROSS AND LOCK BELOW 3352 WILL OPEN THE FOLLOWING BEARISH TARGET
3317 - DONE
EMA5 CROSS AND LOCK BELOW 3317 WILL OPEN THE FOLLOWING BEARISH TARGET
3282
EMA5 CROSS AND LOCK BELOW 3282 WILL OPEN THE FOLLOWING BEARISH TARGET
3233
EMA5 CROSS AND LOCK BELOW 3233 WILL OPEN THE SWING RANGE
3185
3146
As always, we’ll keep you all updated with real time analysis and management of active setups throughout the week. Thank you for your continued support, your likes, comments, and follows mean a lot!
Mr Gold
GoldViewFX
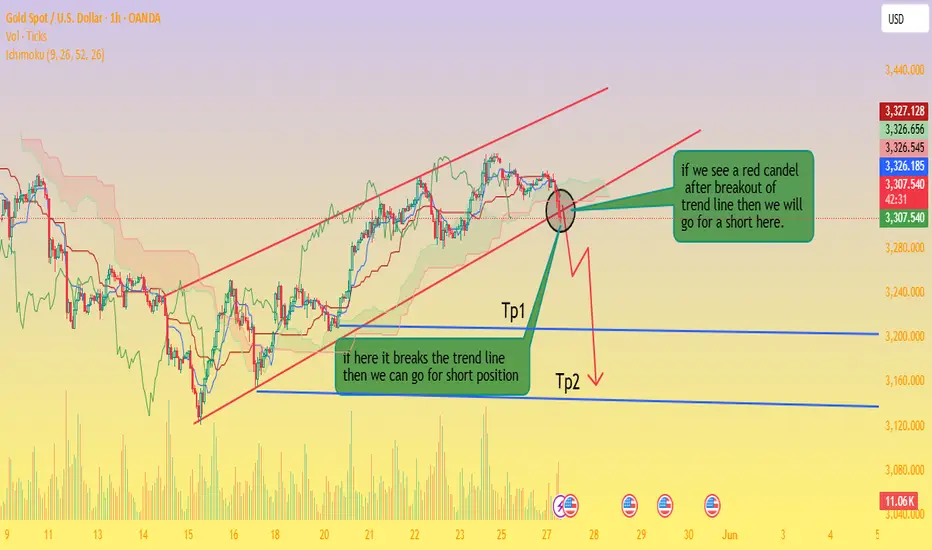
Gold (XAU/USD) Bearish Trendline Breakout – Short Set.Trend Channel: Price had been moving within a clear ascending channel. Recently, price action tested the lower trendline and appears to have broken below it, indicating potential bearish momentum.
Ichimoku Cloud: The price has moved below the Ichimoku cloud, which adds further bearish confirmation. This breakdown of both the trendline and the cloud indicates a possible shift in trend direction.
Volume Spike: A slight increase in volume during the breakout suggests growing interest from sellers.
Entry Signal: The chart marks a zone (circle) where traders should watch for a red candle confirmation. A bearish close below the trendline supports initiating a short position.
Targets:
TP1 (Take Profit 1): Around the 3,240 zone — this is a moderate support area and a conservative profit target.
TP2 (Take Profit 2): Around the 3,160 zone — this aligns with a previous demand zone and represents a deeper corrective move.
Trade Strategy:
Entry: After confirmation with a red candle below the trendline and Ichimoku cloud.
SL (Stop Loss): Ideally placed above the trendline or recent high to protect against a false breakout.
Conclusion:
If the price holds below the ascending channel and the Ichimoku cloud, the setup favors short sellers. Watch closely for bearish candlestick confirmation before entering. TP1 and TP2 offer clear targets based on past support zones.
Would you like a follow-up with live price tracking or updated levels?
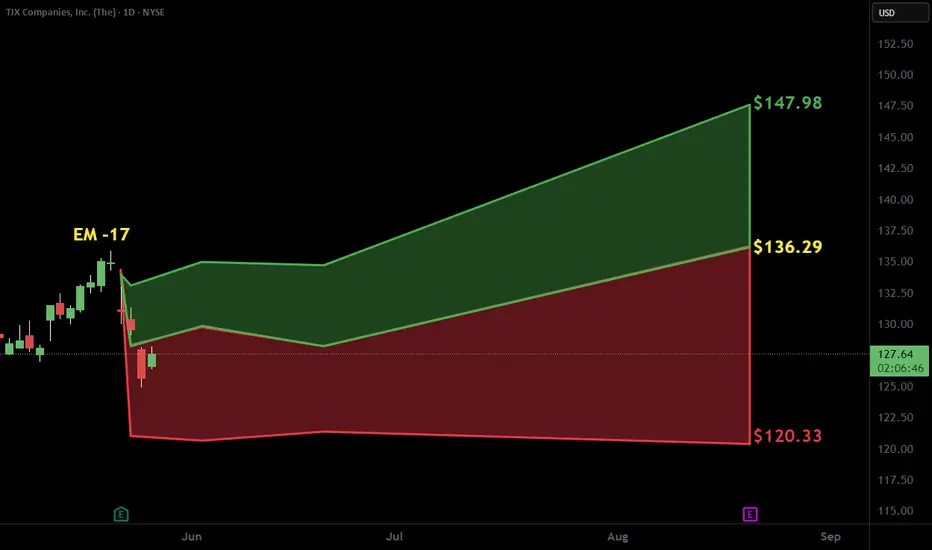
$TJX with a bullish outlook following its earnings #StocksThe PEAD projected a bullish outlook for NYSE:TJX after a negative under reaction following its earnings release placing the stock in drift D with an expected accuracy of 50%.
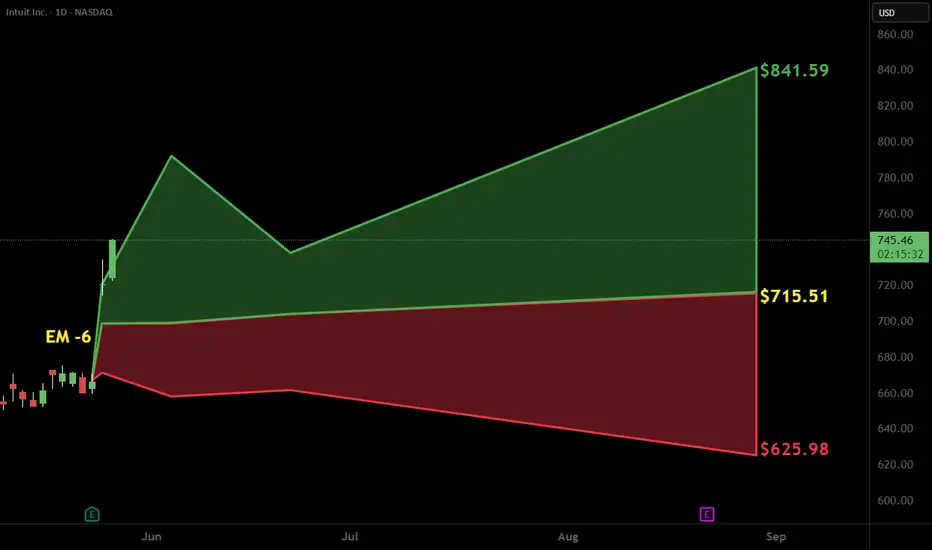
$INTU with a bullish outlook following its earnings #StocksThe PEAD projected a bullish outlook for NASDAQ:INTU after a positive under reaction following its earnings release placing the stock in drift A with an expected accuracy of 71.43%.
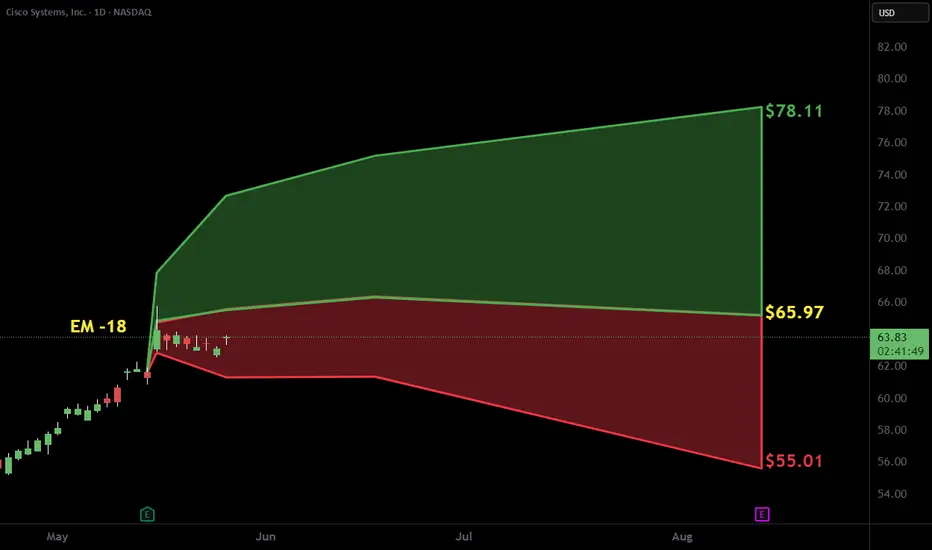
$CSCO with a bullish outlook following its earnings #StocksThe PEAD projected a bullish outlook for NASDAQ:CSCO after a positive under reaction following its earnings release placing the stock in drift A with an expected accuracy of 75%.
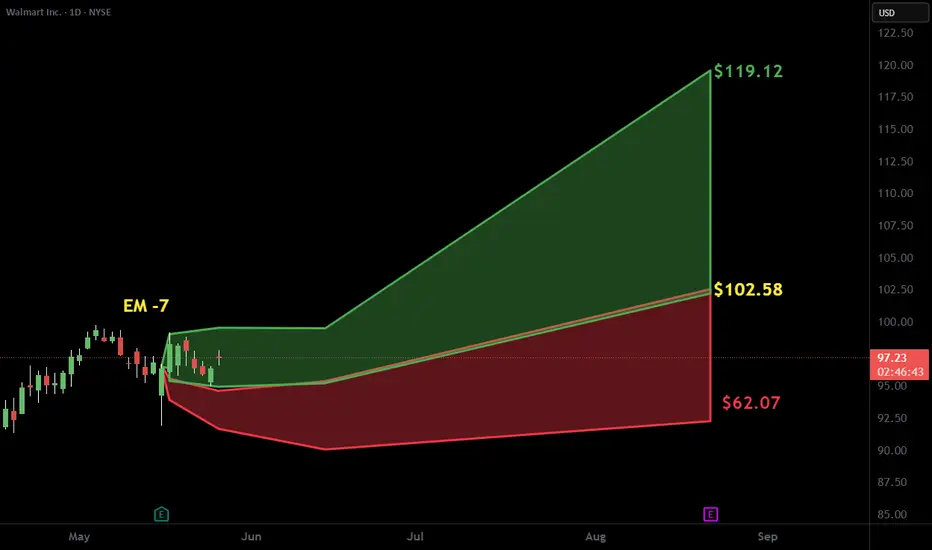
$WMT with a bullish outlook following its earnings #StocksThe PEAD projected a bullish outlook for NYSE:WMT after a negative over reaction following its earnings release placing the stock in drift C with an expected accuracy of 66.67%%.
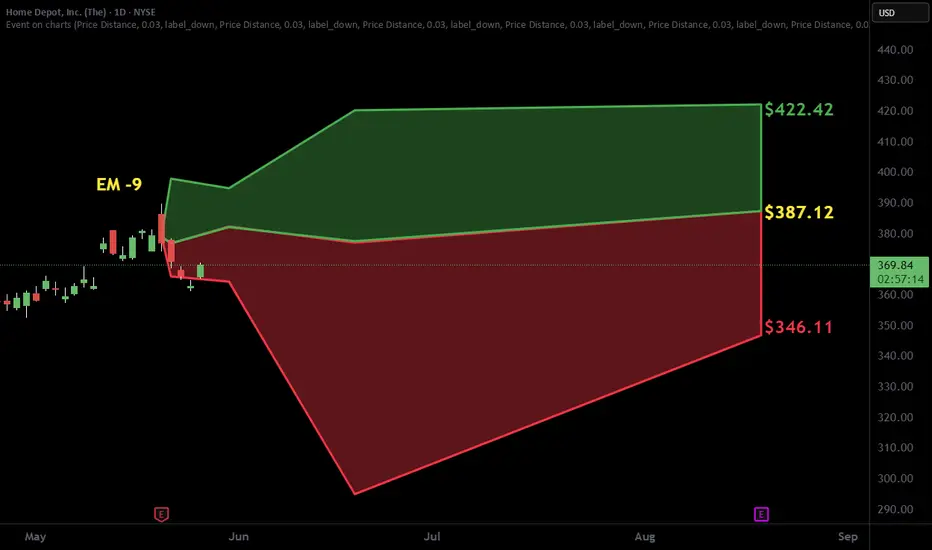
$HD with a bullish outlook following its earnings #StocksThe PEAD projected a bullish outlook for NYSE:HD after a positive over reaction following its earnings release placing the stock in drift B with an expected accuracy of 80%.
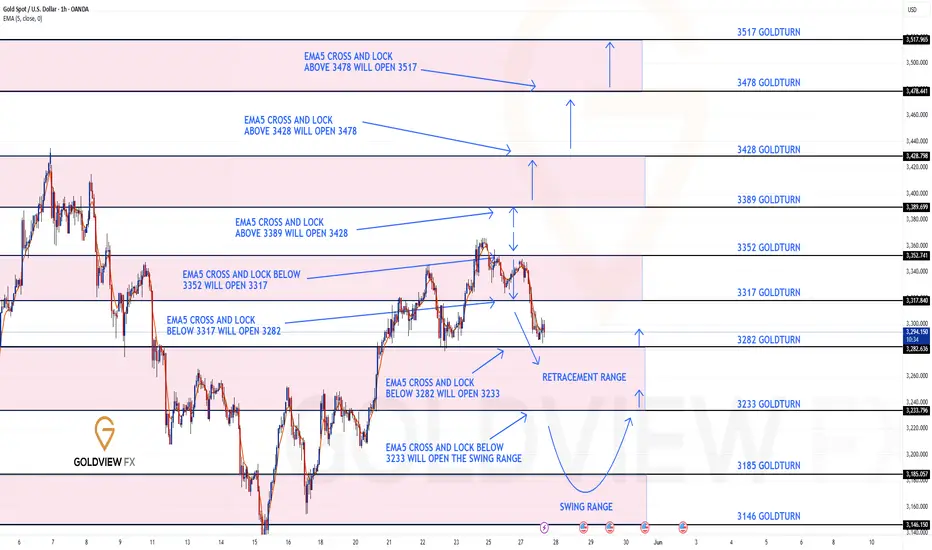
GOLD 1H CHART ROUTE MAP UPDATEHey Everyone,
Please see update on our 1H chart route map, playing out as analysed.
We started the week with a bearish gap at 3352 being hit, followed by ema5 cross and lock below 3352, which opened up the next level at 3317, also hit perfectly. We are now seeing ema5 cross and lock below 3317, opening the retracement range, which is currently being tested. We are expecting a reaction within this retracement range, aligning with our plan to buy dips.
We will keep the above in mind when taking buys from dips. Our updated levels and weighted levels will allow us to track the movement down and then catch bounces up.
We will continue to buy dips using our support levels taking 20 to 40 pips. As stated before each of our level structures give 20 to 40 pip bounces, which is enough for a nice entry and exit. If you back test the levels we shared every week for the past 24 months, you can see how effectively they were used to trade with or against short/mid term swings and trends.
The swing range give bigger bounces then our weighted levels that's the difference between weighted levels and swing ranges.
BULLISH TARGET
3389
EMA5 CROSS AND LOCK ABOVE 3389 WILL OPEN THE FOLLOWING BULLISH TARGETS
3428
EMA5 CROSS AND LOCK ABOVE 3428 WILL OPEN THE FOLLOWING BULLISH TARGET
3478
EMA5 CROSS AND LOCK ABOVE 3478 WILL OPEN THE FOLLOWING BULLISH TARGET
3517
BEARISH TARGETS
3352 - DONE
EMA5 CROSS AND LOCK BELOW 3352 WILL OPEN THE FOLLOWING BEARISH TARGET
3317 - DONE
EMA5 CROSS AND LOCK BELOW 3317 WILL OPEN THE FOLLOWING BEARISH TARGET
3282
EMA5 CROSS AND LOCK BELOW 3282 WILL OPEN THE FOLLOWING BEARISH TARGET
3233
EMA5 CROSS AND LOCK BELOW 3233 WILL OPEN THE SWING RANGE
3185
3146
As always, we will keep you all updated with regular updates throughout the week and how we manage the active ideas and setups. Thank you all for your likes, comments and follows, we really appreciate it!
Mr Gold
GoldViewFX