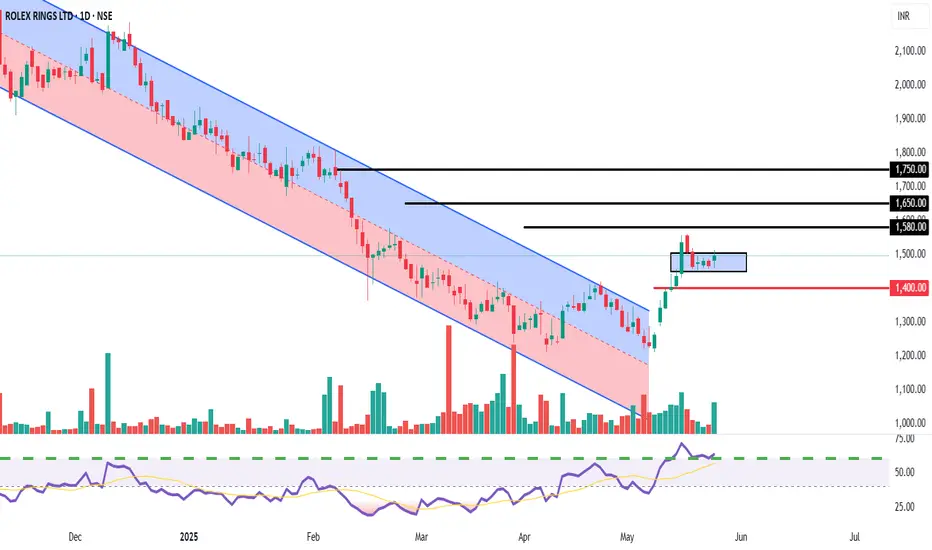
Confirmed Breakout and Retest of Channel Resistance.Entry Zone: We recommend accumulating Rolex Rings Ltd. in the zone of ₹1,460 - ₹1,500. This area represents a crucial retest of the broken descending channel's resistance, now acting as strong support.
Target 1 (T1): ₹1,580
Target 2 (T2): ₹1,650
Target 3 (T3): ₹1,750 (Extended target if momentum remains strong)
Stop Loss (SL): ₹1,400 (Strictly on a daily closing basis)
Rationale:
Clear Channel Breakout: The stock has executed a textbook breakout from a well-defined multi-month descending channel. This indicates a significant shift in the underlying trend from bearish to bullish.
Successful Retest: Post-breakout, the price has pulled back to retest the upper boundary of the channel, which is a classic technical confirmation of a valid breakout. The retest appears to be holding, suggesting the former resistance has turned into reliable support.
Volume Confirmation: The initial breakout was supported by decent volumes, and the current consolidation/retest phase is occurring on relatively lower volumes, which is typical before the next leg up.
RSI Bullish Momentum: The Relative Strength Index (RSI) is maintaining its position above the 50-mark and shows bullish bias, supporting the upward price momentum.
Favorable Risk-Reward: The current entry point offers an attractive risk-reward profile for a short-term trade, with the potential upside significantly outweighing the downside risk defined by the stop-loss.
Key Risk: A decisive daily closing below ₹1,400 would invalidate the bullish breakout and retest pattern, suggesting a false breakout or a resumption of the downtrend. Strict adherence to the stop-loss is advised.
Disclaimer : This report is for informational purposes only and does not constitute financial advice. Investors should conduct their own due diligence and consult with a qualified financial advisor before making any investment decisions. Equity investments are subject to market risks.
For Education purposes only
Tradingideas
GOLD 4H CHART ROUTE MAP UPDATEHey Everyone,
Please see our updated 4H chart levels and targets for the coming week.
Price is currently ranging sideways between the two key weighted levels at 3378 and 3312, with both gaps still open. We are closely monitoring these areas for a potential breakout. Until then, we expect continued sideways action within this range.
We are watching for the EMA5 to cross and lock above or below these levels to confirm the next directional move. Once that happens, we will adapt accordingly, either to the upside or downside for buying dips.
Until a clear break occurs, we anticipate price to test both levels. Our strategy remains to buy dips, using smaller timeframe support levels to capture 20–40 pip bounces, as we’ve consistently done. These intraday moves offer solid entry and exit opportunities in line with the current market structure.
As always, our updated weighted levels and swing ranges provide the framework to identify key reaction points, helping us trade both short and mid term moves effectively.
BULLISH TARGET
3378
EMA5 CROSS AND LOCK ABOVE 3378 WILL OPEN THE FOLLOWING BULLISH TARGETS
3438
EMA5 CROSS AND LOCK ABOVE 3438 WILL OPEN THE FOLLOWING BULLISH TARGET
3496
EMA5 CROSS AND LOCK ABOVE 3496 WILL OPEN THE FOLLOWING BULLISH TARGET
3555
BEARISH TARGETS
3312
EMA5 CROSS AND LOCK BELOW 3312 WILL OPEN THE FOLLOWING BEARISH TARGET
3249
EMA5 CROSS AND LOCK BELOW 3249 WILL OPEN THE SWING RANGE
3198
3119
EMA5 CROSS AND LOCK BELOW 3249 WILL OPEN THE SECONDARY SWING RANGE
3046
2988
As always, we will continue to provide regular updates throughout the week as we manage and execute the setups.
Thank you all for your continued support, your likes, comments, and follows are always appreciated!
Mr Gold
GoldViewFX

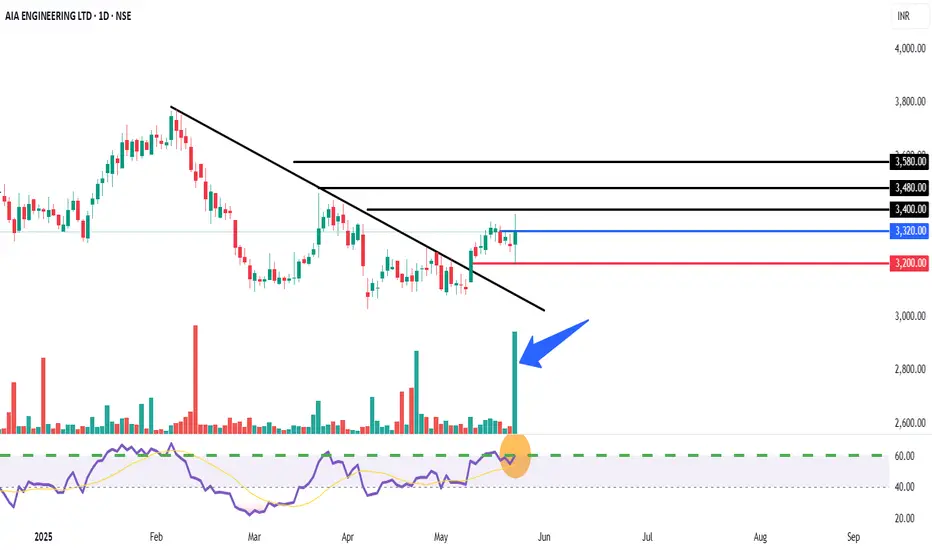
Potential Reversal and Breakout Retest.Entry Zone: We recommend initiating a BUY position in AIA Engineering Ltd. around the current levels, ideally between ₹3,280 - ₹3,320. This area represents a retest of the recent trendline breakout.
Target 1 (T1): ₹3,400
Target 2 (T2): ₹3,480
Target 3 (T3): ₹3,580 (If momentum sustains above T2)
Stop Loss (SL): ₹3,200 (Strictly on a closing basis)
Trendline Breakout & Retest: The stock recently broke out of a significant descending trendline, indicating a potential end to the corrective phase. The current price action appears to be a successful retest of this broken trendline, which often acts as new support, presenting a lower-risk entry point.
Volume Confirmation: The initial breakout was accompanied by higher volumes, and while the retest phase has lower volumes (typical), sustained buying interest on subsequent upward moves would confirm strength.
RSI Bounce from Support: The Relative Strength Index (RSI) is showing a bounce from the 40-50 zone, indicating that momentum is regaining strength and potentially moving towards the bullish territory.
Positive Structure: The overall chart structure suggests that the stock is attempting to reverse its short-term downtrend and potentially resume its broader upward trajectory.
Favorable Risk-Reward: The current setup offers a reasonable risk-to-reward ratio for a short-term trade, with potential for upside gains outweighing the defined risk.
Key Risk: A close below ₹3,200 would invalidate the bullish retest scenario and could lead to further downside, bringing the previous lows into play. Traders should adhere strictly to the stop-loss.
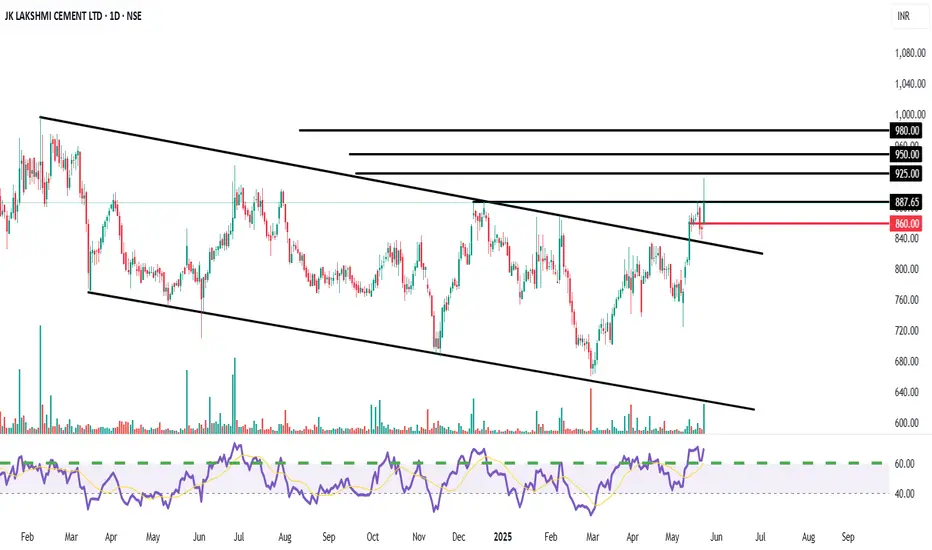
Potential Breakout from a Symmetrical Triangl Descending ChannelEntry Zone: We recommend initiating a BUY position in JK Lakshmi Cement around the current levels, ideally between ₹880 - ₹890. This considers the strong closing above the resistance trendline.
Target 1 (T1): ₹925
Target 2 (T2): ₹950
Target 3 (T3): ₹980 (If momentum sustains above T2)
Stop Loss (SL): ₹860 (Strictly on a closing basis)
Channel Breakout: The stock has decisively broken out of a multi-month descending channel/symmetrical triangle pattern, indicating a potential strong reversal from a corrective phase. This breakout appears to be supported by a noticeable pickup in volumes.
Key Resistance Breach: The stock has also managed to close above a significant horizontal resistance level around ₹880-885, which has acted as a hurdle multiple times in the past. A sustained move above this level confirms bullish intent.
RSI Strength: The Relative Strength Index (RSI) is showing strength, trading well above the 50-mark and moving towards the overbought zone, confirming increasing buying momentum.
Positive Price Action: The overall structure suggests accumulation at lower levels, and the current breakout could initiate the next leg of the uptrend.
Favorable Risk-Reward: The setup offers a compelling risk-reward profile for a short-term trade, with significant upside potential compared to the defined stop-loss.
Key Risk: A failure to sustain above the ₹880 level or a close below the ₹860 stop-loss would invalidate the bullish view and could lead to renewed selling pressure.
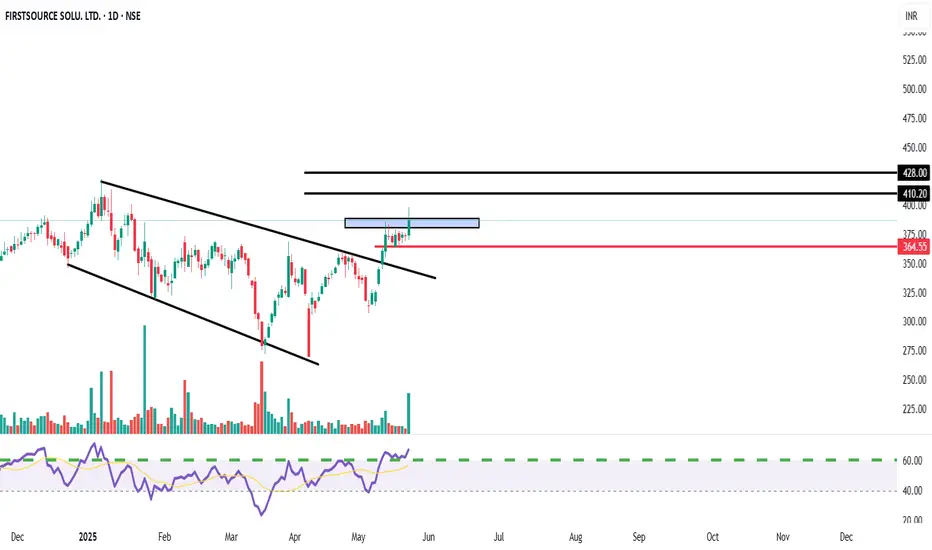
Bullish - Breakout observed from a descending channelEntry Zone: We recommend accumulating FSL in the zone of ₹375 - ₹385.
Target 1 (T1): ₹405
Target 2 (T2): ₹420
Target 3 (T3): ₹450 (If momentum sustains above T2)
Stop Loss (SL): ₹360 (Closing basis)
Rationale:
Channel Breakout: The stock has successfully broken out of a prominent descending channel, indicating a potential shift in momentum from bearish to bullish. This breakout is supported by decent volumes on the breakout candle.
RSI Confirmation: The Relative Strength Index (RSI) has shown a strong move above the 50-mark and is trending upwards, suggesting increasing buying interest and underlying strength.
Support from Previous Levels: The breakout retests appear to hold the previous resistance now acting as support, which is a classic bullish reversal pattern.
Risk-Reward: The current setup offers a favorable risk-to-reward ratio for short-term traders.
Key Risk: A close below ₹360 would negate the current bullish view and could lead to further downside. Traders should adhere strictly to the stop-loss.
Disclaimer: This report is for informational purposes only and does not constitute financial advice. Investors should conduct their own due diligence and consult with a qualified financial advisor before making any investment decisions. Equity investments are subject to market risks.
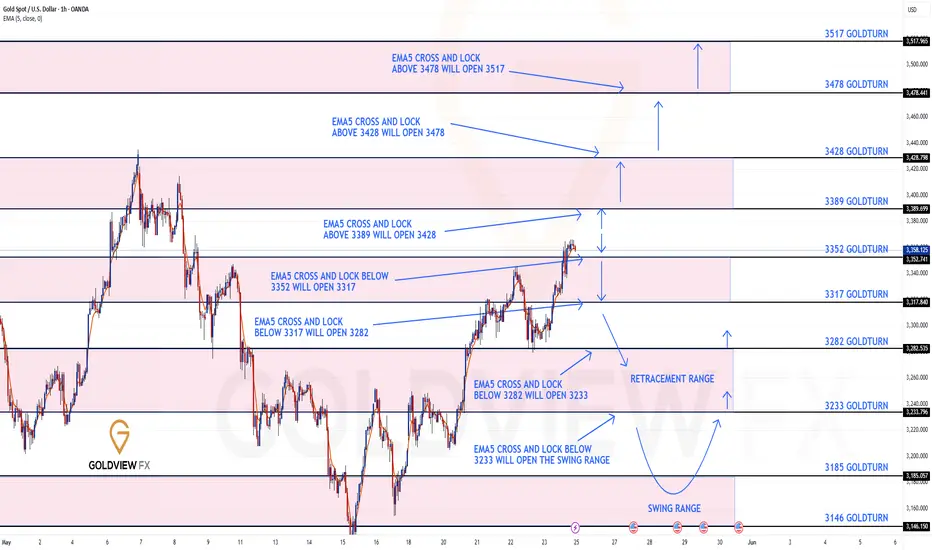
GOLD 1H CHART ROUTE MAP UPDATE & TRADING PLAN FOR THE WEEKHey Everyone,
Please see our updated 1h chart levels and targets for the coming week.
We are seeing price play between two weighted levels with a gap above at 3389 and a gap below at 3352. We will need to see ema5 cross and lock on either weighted level to determine the next range.
We will see levels tested side by side until one of the weighted levels break and lock to confirm direction for the next range.
We will keep the above in mind when taking buys from dips. Our updated levels and weighted levels will allow us to track the movement down and then catch bounces up.
We will continue to buy dips using our support levels taking 20 to 40 pips. As stated before each of our level structures give 20 to 40 pip bounces, which is enough for a nice entry and exit. If you back test the levels we shared every week for the past 24 months, you can see how effectively they were used to trade with or against short/mid term swings and trends.
The swing range give bigger bounces then our weighted levels that's the difference between weighted levels and swing ranges.
BULLISH TARGET
3389
EMA5 CROSS AND LOCK ABOVE 3389 WILL OPEN THE FOLLOWING BULLISH TARGETS
3428
EMA5 CROSS AND LOCK ABOVE 3428 WILL OPEN THE FOLLOWING BULLISH TARGET
3478
EMA5 CROSS AND LOCK ABOVE 3478 WILL OPEN THE FOLLOWING BULLISH TARGET
3517
BEARISH TARGETS
3352
EMA5 CROSS AND LOCK BELOW 3352 WILL OPEN THE FOLLOWING BEARISH TARGET
3317
EMA5 CROSS AND LOCK BELOW 3317 WILL OPEN THE FOLLOWING BEARISH TARGET
3282
EMA5 CROSS AND LOCK BELOW 3282 WILL OPEN THE FOLLOWING BEARISH TARGET
3233
EMA5 CROSS AND LOCK BELOW 3233 WILL OPEN THE SWING RANGE
3185
3146
As always, we will keep you all updated with regular updates throughout the week and how we manage the active ideas and setups. Thank you all for your likes, comments and follows, we really appreciate it!
Mr Gold
GoldViewFX
GOLD DAILY CHART ROUTE MAPHey Everyone,
Here's an update on the daily chart setup we've been tracking and trading successfully over the past few weeks.
As anticipated, price action rejected off the midline of the channel and produced a strong bounce, exactly as we had analysed. This move reached the 3272 Goldturn level and closed above it, opening the path for a potential test of the channel top near 3433. We captured a solid move of over 600 pips, aligning perfectly with our strategy of buying the dips for the ideal swing setup.
Please note that the gap remains open, but we are not looking to chase from the top. We'll continue to focus on buying pullbacks for better entries.
This is the beauty of our Goldturn channels, drawn using weighted averages instead of pure price action. This unique approach helps us clearly identify fake outs and real breakouts, cutting out much of the noise that usually confuses traders.
Moving forward, we’ll focus on smaller timeframes (1H and 4H) to buy dips off the weighted Goldturns, aiming for clean 30–40 pip moves. Ranging markets are perfect for this style, allowing us to capitalise on quick moves without getting caught in the chop of larger swings.
Thank you all again for your continued likes, comments, and follows, we truly appreciate your support!
Mr Gold
GoldViewFX

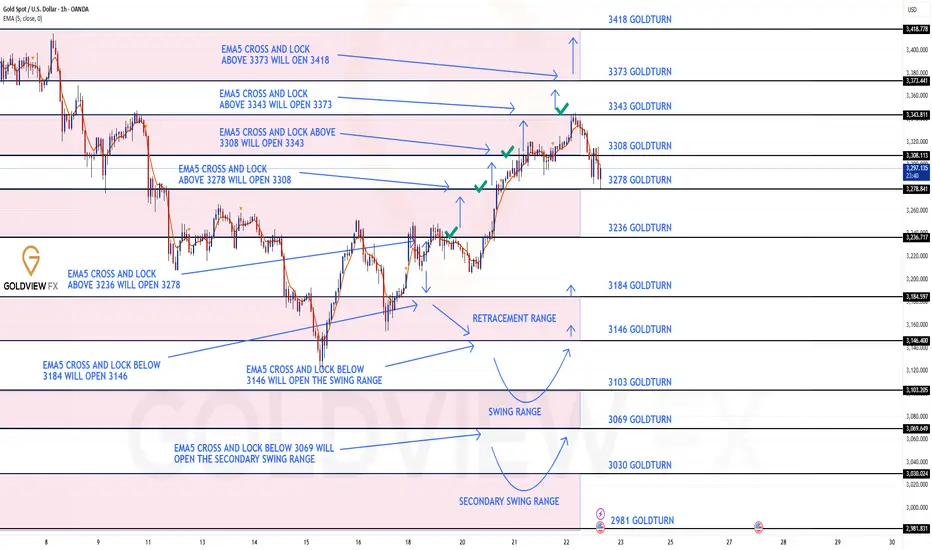
GOLD ROUTE MAP UPDATEHey Everyone,
What a Piptastic end to the week with our chart idea playing out exactly as anticipated, step by step.
Yesterday, after we cleanly hit 3308, we highlighted a confirmed cross and lock above this level, opening 3343, as the next key target. This level has now been struck with precision, completing the target.
Currently, 3343 is being tested. A ema5 cross and lock above this zone, will open the path toward 3373. However, failure to hold here may lead to a rejection and a move back to test lower Goldturns, just as we've seen this week, where price found support on Goldturns, inline with our plans to buy dips.
BULLISH TARGET
3236 - DONE
EMA5 CROSS AND LOCK ABOVE 3236 WILL OPEN THE FOLLOWING BULLISH TARGETS
3278 - DONE
EMA5 CROSS AND LOCK ABOVE 3278 WILL OPEN THE FOLLOWING BULLISH TARGET
3308 - DONE
EMA5 CROSS AND LOCK ABOVE 3308 WILL OPEN THE FOLLOWING BULLISH TARGET
3343 - DONE
EMA5 CROSS AND LOCK ABOVE 3343 WILL OPEN THE FOLLOWING BULLISH TARGETS
3373
We will now come back Sunday with our updated Multi time-frame analysis, Gold route map and trading plans for the week ahead.
Have a smashing weekend!! And once again, thank you all for your likes, comments and follows, we really appreciate it!
Mr Gold
GoldViewFX
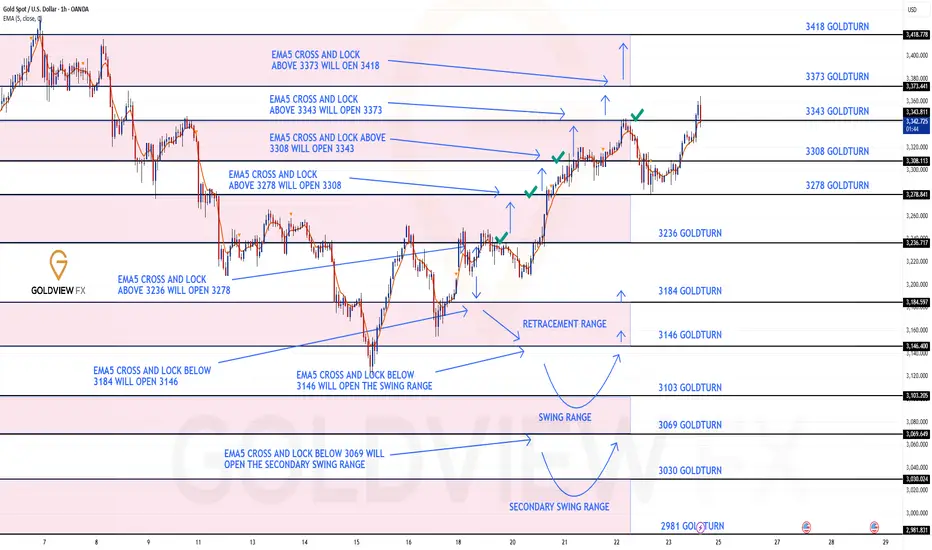
GOLD ROUTE MAP UPDATEHey Everyone,
Another strong day in the markets!
After hitting our bullish targets at 3236, 3278, and 3308 earlier this week, yesterday we identified and stated that we have EMA5 cross and lock above 3308, opening the move to 3343.
- 3343 target was reached with precision, completing the move as planned.
However, with no further lock above 3343, we saw the rejection, driving price back into the lower Goldturn zones for support and clean bounces just like we stated.
We’ll continue tracking price level by level, guided by EMA5 confirmations and buying the dips, inline with our plans.
We will keep the above in mind when taking buys from dips. Our updated levels and weighted levels will allow us to track the movement down and then catch bounces up.
We will continue to buy dips using our support levels taking 20 to 40 pips. As stated before each of our level structures give 20 to 40 pip bounces, which is enough for a nice entry and exit. If you back test the levels we shared every week for the past 24 months, you can see how effectively they were used to trade with or against short/mid term swings and trends.
The swing range give bigger bounces then our weighted levels that's the difference between weighted levels and swing ranges.
BULLISH TARGET
3236 - DONE
EMA5 CROSS AND LOCK ABOVE 3236 WILL OPEN THE FOLLOWING BULLISH TARGETS
3278 - DONE
EMA5 CROSS AND LOCK ABOVE 3278 WILL OPEN THE FOLLOWING BULLISH TARGET
3308 - DONE
EMA5 CROSS AND LOCK ABOVE 3308 WILL OPEN THE FOLLOWING BULLISH TARGET
3343 - DONE
EMA5 CROSS AND LOCK ABOVE 3343 WILL OPEN THE FOLLOWING BULLISH TARGETS
3373
EMA5 CROSS AND LOCK ABOVE 3373 WILL OPEN THE FOLLOWING BULLISH TARGETS
3418
BEARISH TARGETS
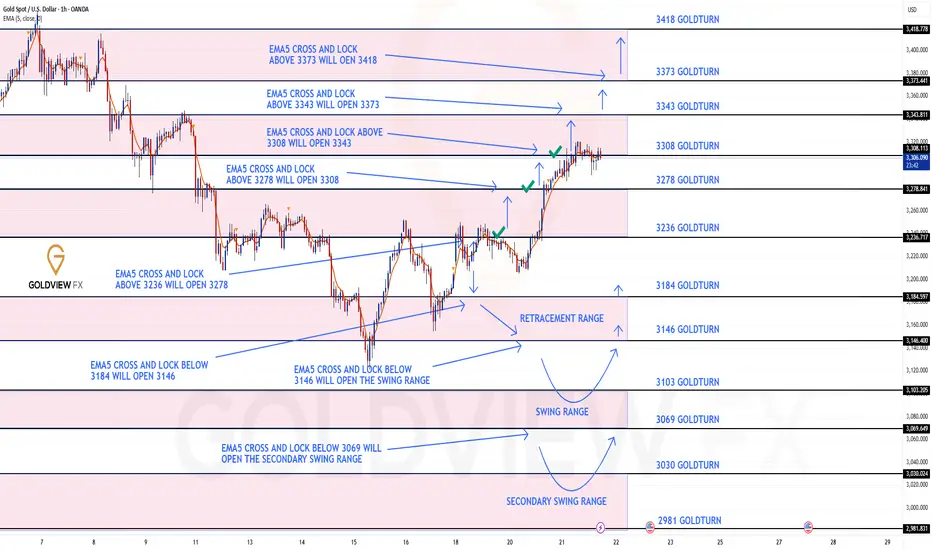
3184
EMA5 CROSS AND LOCK BELOW 3184 WILL OPEN THE FOLLOWING BEARISH TARGET
3146
EMA5 CROSS AND LOCK BELOW 3146 WILL OPEN THE SWING RANGE
3103
3069
EMA5 CROSS AND LOCK BELOW 3069 WILL OPEN THE SECONDARY SWING RANGE
3030
2981
As always, we will keep you all updated with regular updates throughout the week and how we manage the active ideas and setups. Thank you all for your likes, comments and follows, we really appreciate it!
Mr Gold
GoldViewFX
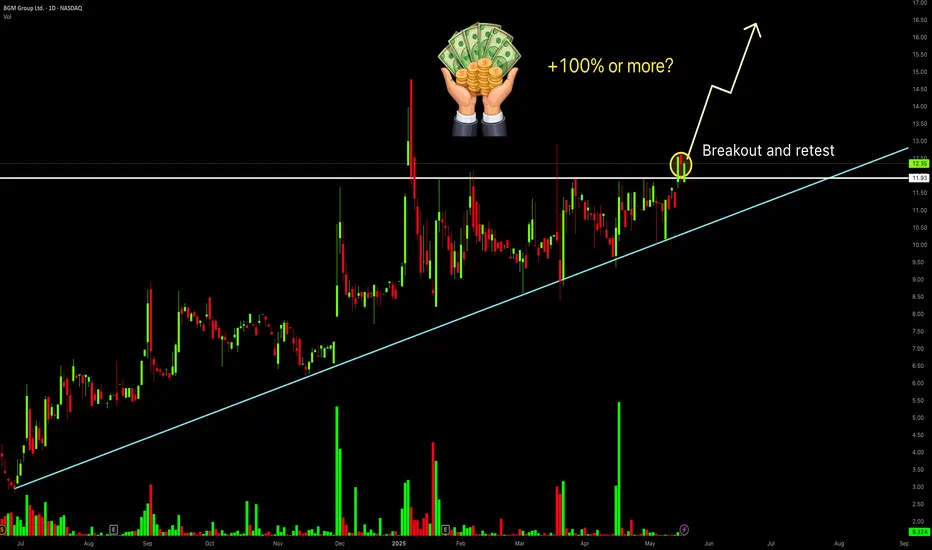
Breaking key resistance — could $BGM repeat $RGC’s 100x rally?Let me introduce a stock that has already generated a profit of nearly 40% and I have no intention of selling it yet. Because both the chart and fundamentals suggest the stock seems to be approaching the point of potential explosion, and it is even possible to increase several times.
This stock is NASDAQ:BGM , a traditional Chinese pharmaceutical chemical company but now it has transformed into an AI productivty platform. More on that later—let’s first take a look at the technicals, which I always pay close attention to.
Firstly,the uptrend remains intact.
Since last year’s stock split, the price has been climbing steadily within a clear uptrend. After breaking above $8.50, it has consistently held above that level for months, showing strong momentum. (I bought in when it dipped back to $8.50 earlier this year and have held since.)
In the recent days, the stock price has successfully broken through the upper limit of the consolidation range that has persisted for nearly 3 months, and has stabilized above $12.
This is a significant breakthrough, and it may indicate that the stock price could potentially start a significant upward rally at any time.
Secondly,the stock is almost fully controlled by the market maker.
There’s a saying in trading: “Volume precedes price.” Since December 2024, BGM’s trading volume has clearly increased, with each spike in volume followed by a small price uptick—money was buying.
Interestingly, each rise is followed by a pullback, but on much lower volume. This volume pattern—rising on gains and shrinking on pullbacks—suggests that the maket maker have accumulated most of the shares and now have strong control. The dips are likely just shakeouts to flush weak hands before a bigger breakout.
Thirdly, low short interest means minimal resistance to a price surge.
According to Nasdaq's data, BGM’s short position was 34,466 shares by 31th March, but dropping to 18,889 shares by April 30,the number of short positions has significantly decreased.
This was showing that as the stock price rose, short sellers mostly exited or turned bullish—clearing major obstacles for further gains.
Technically, everything is set—just waiting for the trigger. Pull the trigger could spark a massive rally, and that trigger may come anytime as the company nears to complete a key transformation.
Yes, the company is transforming from a traditional pharmaceutical firm into a leading AI tech ecosystem. Since last year, it has been actively acquiring companies to enter AI-driven healthcare, insurance, and wellness sectors, aiming to become an industry leader.
①In December 2024, BGM acquired RONS Tech and Xinbao Investment, integrating the AI insurance platform “Duxiaobao” (powered by Baidu’s NASDAQ:BIDU technology). Leveraging 704 million monthly active users, they aim to disrupt traditional insurance sales and drive exponential customer growth.
②In April 2025, BGM acquired YX Management to boost AI applications in insurance and transportation, accelerating the “pharma-insurance-health” ecosystem.
③In May 2025, BGM acquired HM Management and its two subsidiaries—SHUDA Technology and New Media Star—strengthening its algorithm optimization、data modeling and traffic-driven customer acquisition capabilities
After several acquisitions, the company has initially completed its transformation plan. So the "trigger" we are pursuing might emerge during the next major acquisition by the company to complete the final transformation.This is an important milestone. According to reliable sources, the company's next acquisition is likely to take place in the coming June. Let's wait and see.
Another "trigger" may be the company’s next earnings report, which will include the “Duxiaobao” AI insurance business for the first time, expected to add over $5 million in revenue, might to confirm the initial success of the company's transformation. And this is potentially spark a strong stock rally.
These two potential "triggers" are both approaching soon.
If all goes well, how far could this rally go? Let’s refer to the recent strong gains of Chinese stocks like $RGC.
Technically, RGC saw a clear volume increase and price rise around July-August 2024. Then it had a six-month shakeout with low volume pullback (similar to BGM’s current pattern). In March 2025, it launched a major rally, rising over tenfold.
In May, RGC surged again, supported by fundamental news: the company announced FDA approval for its new neurostimulation chip and a Parkinson’s study with Mayo Clinic. From the start to the peak, RGC gained over 100 times in a short period!
Looking at BGM again: after the breakout, the stock will likely first test resistance near $15, which may not be a big hurdle. The real test could be at $24—the pre-split high and the upper boundary of the current “megaphone” consolidation.
Even if the price only reaches around $24 , current investors could nearly double their money. After the company’s fundamental transformation, its revenue and profits potential could grow beyond RGC. So, how high can BGM’s stock go? Let’s wait and see.
GOLD 1H CHART ROUTE MAP UPDATEHey everyone,
Please see update on our 1h chart idea.
After completing our Bullish targets yesterday, at 3236 and 3278; we stated that we would look for ema5 to lock above 3278 to open 3308.
- We got the lock above 3278, confirming 3308, which was hit perfectly today. We now have a ema5 cross and lock above 3308, opening the range above. Any rejections in this zone and we may see a retest of lower Goldturns for the usual weighted level bounces, inline with our plans to buy dips.
We will keep the above in mind when taking buys from dips. Our updated levels and weighted levels will allow us to track the movement down and then catch bounces up.
We will continue to buy dips using our support levels taking 20 to 40 pips. As stated before each of our level structures give 20 to 40 pip bounces, which is enough for a nice entry and exit. If you back test the levels we shared every week for the past 24 months, you can see how effectively they were used to trade with or against short/mid term swings and trends.
The swing range give bigger bounces then our weighted levels that's the difference between weighted levels and swing ranges.
BULLISH TARGET
3236 - DONE
EMA5 CROSS AND LOCK ABOVE 3236 WILL OPEN THE FOLLOWING BULLISH TARGETS
3278 - DONE
EMA5 CROSS AND LOCK ABOVE 3278 WILL OPEN THE FOLLOWING BULLISH TARGET
3308 - DONE
EMA5 CROSS AND LOCK ABOVE 3308 WILL OPEN THE FOLLOWING BULLISH TARGET
3343
EMA5 CROSS AND LOCK ABOVE 3343 WILL OPEN THE FOLLOWING BULLISH TARGETS
3373
EMA5 CROSS AND LOCK ABOVE 3373 WILL OPEN THE FOLLOWING BULLISH TARGETS
3418
BEARISH TARGETS
3184
EMA5 CROSS AND LOCK BELOW 3184 WILL OPEN THE FOLLOWING BEARISH TARGET
3146
EMA5 CROSS AND LOCK BELOW 3146 WILL OPEN THE SWING RANGE
3103
3069
EMA5 CROSS AND LOCK BELOW 3069 WILL OPEN THE SECONDARY SWING RANGE
3030
2981
As always, we will keep you all updated with regular updates throughout the week and how we manage the active ideas and setups. Thank you all for your likes, comments and follows, we really appreciate it!
Mr Gold
GoldViewFX
Buy Agnico Eagle Mines LimitedShort Term Trading Advice by Naranj Capital
Buy Agnico Eagle Mines Limited
● Buy Range- 108.5 - 112
● Target- 116 - 118
● StopLoss- 104.5
● Potential Return- 4-5%
● Duration- 14-15 Trading Days

GOLD 1H CHART ROUTE MAP UPDATEHey everyone,
It’s been another piptastic day in the markets with our 1H chart setup playing out beautifully.
We began with our bullish target at 3236, which was successfully hit. This was followed by EMA5 cross and lock that opened 3278, also reached perfectly. The entire range played out smoothly, giving ample time after confirmation for entries.
Looking ahead, we’ll be watching for an EMA5 cross and lock above 3278, which could open the path to 3308. A further lock above 3308 would open the potential for extended upside.
However, if price fails to lock above these key levels, we may see a retest of lower Goldturns for a potential bounce.
We will keep the above in mind when taking buys from dips. Our updated levels and weighted levels will allow us to track the movement down and then catch bounces up.
We will continue to buy dips using our support levels taking 20 to 40 pips. As stated before each of our level structures give 20 to 40 pip bounces, which is enough for a nice entry and exit. If you back test the levels we shared every week for the past 24 months, you can see how effectively they were used to trade with or against short/mid term swings and trends.
The swing range give bigger bounces then our weighted levels that's the difference between weighted levels and swing ranges.
BULLISH TARGET
3236 - DONE
EMA5 CROSS AND LOCK ABOVE 3236 WILL OPEN THE FOLLOWING BULLISH TARGETS
3278 - DONE
EMA5 CROSS AND LOCK ABOVE 3278 WILL OPEN THE FOLLOWING BULLISH TARGET
3308
EMA5 CROSS AND LOCK ABOVE 3308 WILL OPEN THE FOLLOWING BULLISH TARGET
3343
EMA5 CROSS AND LOCK ABOVE 3343 WILL OPEN THE FOLLOWING BULLISH TARGETS
3373
EMA5 CROSS AND LOCK ABOVE 3373 WILL OPEN THE FOLLOWING BULLISH TARGETS
3418
BEARISH TARGETS
3184
EMA5 CROSS AND LOCK BELOW 3184 WILL OPEN THE FOLLOWING BEARISH TARGET
3146
EMA5 CROSS AND LOCK BELOW 3146 WILL OPEN THE SWING RANGE
3103
3069
EMA5 CROSS AND LOCK BELOW 3069 WILL OPEN THE SECONDARY SWING RANGE
3030
2981
As always, we will keep you all updated with regular updates throughout the week and how we manage the active ideas and setups. Thank you all for your likes, comments and follows, we really appreciate it!
Mr Gold
GoldViewFX

GOLD 4H CHART ROUTE MAP UPDATEHey Everyone,
Great start tot he week with all our chart ideas playing out as analysed. This is an update on our 4H chart idea.
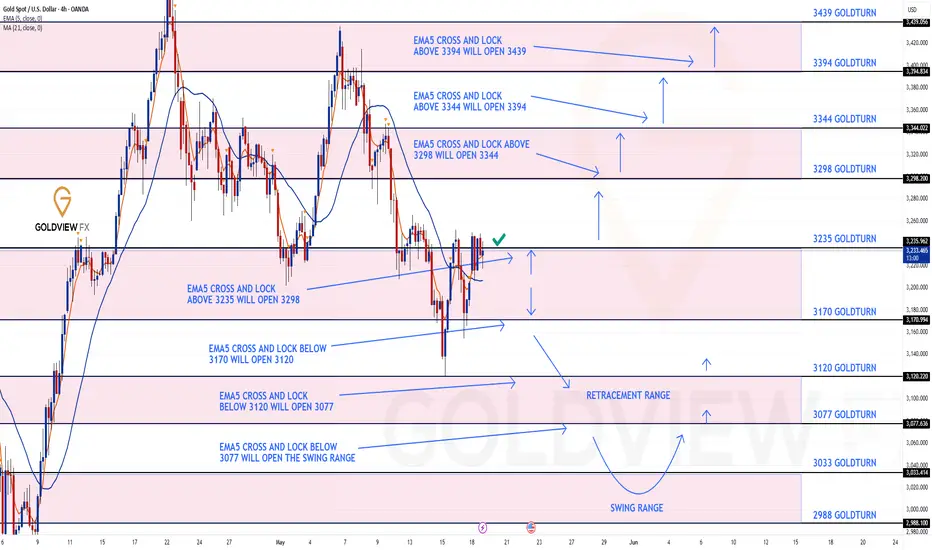
We began the week hitting our bullish target at 3235. Moving forward, we will monitor for a confirmed EMA5 cross and lock above 3235 to validate a potential move toward the next target at 3298.
If price fails to hold above 3235, we anticipate a retest of lower Goldturn support levels. These levels will serve as potential zones to identify bullish reversal opportunities.
We will keep the above in mind when taking buys from dips. Our updated levels and weighted levels will allow us to track the movement down and then catch bounces up.
We will continue to buy dips using our support levels taking 20 to 40 pips. As stated before each of our level structures give 20 to 40 pip bounces, which is enough for a nice entry and exit. If you back test the levels we shared every week for the past 24 months, you can see how effectively they were used to trade with or against short/mid term swings and trends.
The swing range give bigger bounces then our weighted levels that's the difference between weighted levels and swing ranges.
BULLISH TARGET
3235 - DONE
EMA5 CROSS AND LOCK ABOVE 3235 WILL OPEN THE FOLLOWING BULLISH TARGET
3298
EMA5 CROSS AND LOCK ABOVE 3298 WILL OPEN THE FOLLOWING BULLISH TARGET
3344
EMA5 CROSS AND LOCK ABOVE 3344 WILL OPEN THE FOLLOWING BULLISH TARGET
3394
EMA5 CROSS AND LOCK ABOVE 3394 WILL OPEN THE FOLLOWING BULLISH TARGET
3439
BEARISH TARGETS
3170
EMA5 CROSS AND LOCK BELOW 3170 WILL OPEN THE FOLLOWING BEARISH TARGET TARGET
3120
EMA5 CROSS AND LOCK BELOW 3120 WILL OPEN THE FOLLOWING BEARISH TARGET TARGET
3077
EMA5 CROSS AND LOCK BELOW 3077 WILL OPEN THE SWING RANGE
SWING RANGE
3236 - 3176
EMA5 CROSS AND LOCK BELOW 3176 WILL OPEN THE SECONDARY SWING RANGE
SWING RANGE
3033 - 2988
As always, we will keep you all updated with regular updates throughout the week and how we manage the active ideas and setups. Thank you all for your likes, comments and follows, we really appreciate it!
Mr Gold
GoldViewFX
GOLD → Correction & The decline will continueGold is trading below major resistance zones: Bearish Bias Below Key Levels
Price recently rejected this zone multiple times, forming lower highs and showing bearish momentum.
📉 Idea: Sell
📍 Sell Zone: $3,245–$3,250
📍 Sell Zone: $3,265–$3,270
Bias remains bearish unless price breaks and holds above $3,270.
Comment below your thoughts. Thank you.

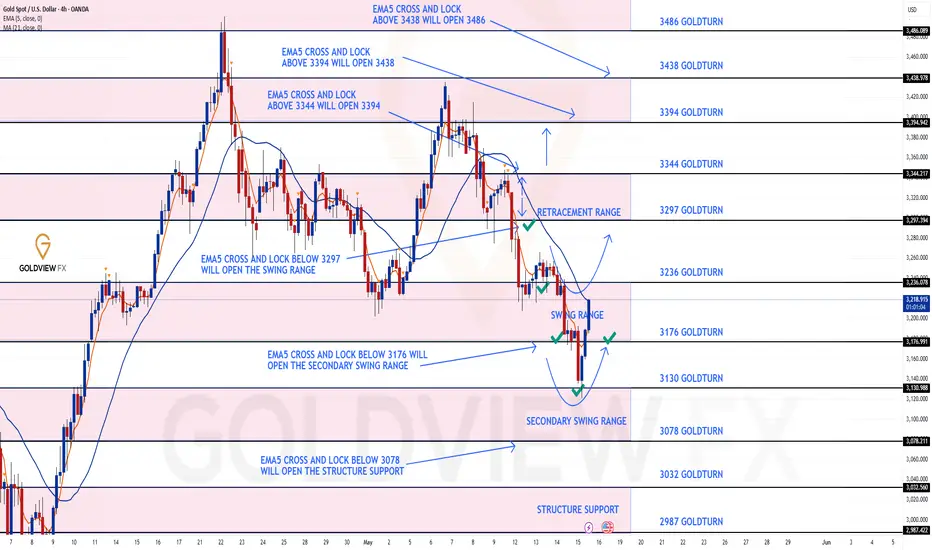
GOLD 4H CHART ROUTE MAP UPDATE & TRADING PLAN FOR THE WEEKHey Everyone,
Please see our updated 4h chart levels and targets for the coming week.
We are seeing price play between two weighted levels with a gap above at 3215 and a gap below at 3170. We will need to see ema5 cross and lock on either weighted level to determine the next range. We have a bigger range in play then usual.
We will see levels tested side by side until one of the weighted levels break and lock to confirm direction for the next range.
We will keep the above in mind when taking buys from dips. Our updated levels and weighted levels will allow us to track the movement down and then catch bounces up.
We will continue to buy dips using our support levels taking 20 to 40 pips. As stated before each of our level structures give 20 to 40 pip bounces, which is enough for a nice entry and exit. If you back test the levels we shared every week for the past 24 months, you can see how effectively they were used to trade with or against short/mid term swings and trends.
The swing range give bigger bounces then our weighted levels that's the difference between weighted levels and swing ranges.
BULLISH TARGET
3215
EMA5 CROSS AND LOCK ABOVE 3215 WILL OPEN THE FOLLOWING BULLISH TARGET
3298
EMA5 CROSS AND LOCK ABOVE 3298 WILL OPEN THE FOLLOWING BULLISH TARGET
3344
EMA5 CROSS AND LOCK ABOVE 3344 WILL OPEN THE FOLLOWING BULLISH TARGET
3394
EMA5 CROSS AND LOCK ABOVE 3394 WILL OPEN THE FOLLOWING BULLISH TARGET
3439
BEARISH TARGETS
3170
EMA5 CROSS AND LOCK BELOW 3170 WILL OPEN THE FOLLOWING BEARISH TARGET TARGET
3120
EMA5 CROSS AND LOCK BELOW 3120 WILL OPEN THE FOLLOWING BEARISH TARGET TARGET
3077
EMA5 CROSS AND LOCK BELOW 3077 WILL OPEN THE SWING RANGE
SWING RANGE
3236 - 3176
EMA5 CROSS AND LOCK BELOW 3176 WILL OPEN THE SECONDARY SWING RANGE
SWING RANGE
3033 - 2988
As always, we will keep you all updated with regular updates throughout the week and how we manage the active ideas and setups. Thank you all for your likes, comments and follows, we really appreciate it!
Mr Gold
GoldViewFX

GOLD 1H CHART ROUTE MAP & TRADING PLAN FOR THE WEEKHey Everyone,
Please see our updated 1h chart levels and targets for the coming week.
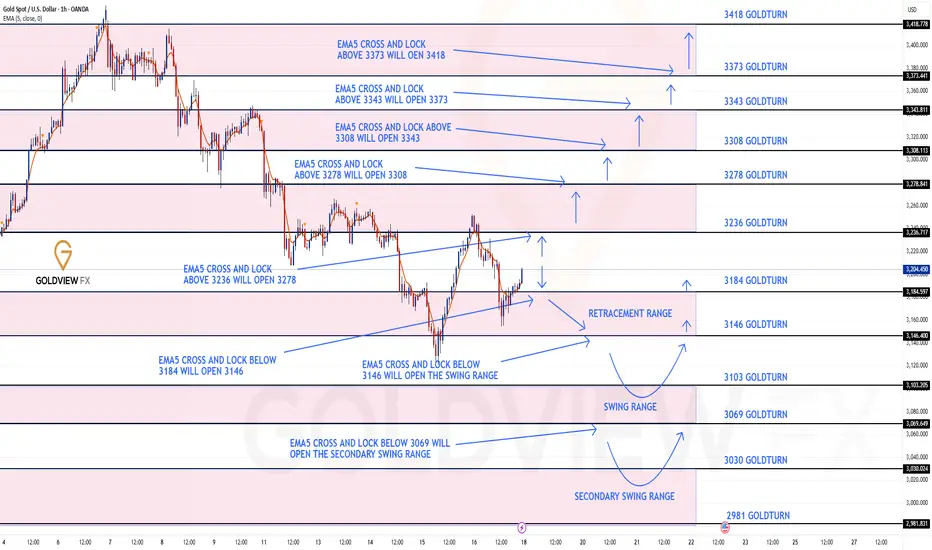
We are seeing price play between two weighted levels with a gap above at 3236 and a gap below at 3184. We will need to see ema5 cross and lock on either weighted level to determine the next range.
We will see levels tested side by side until one of the weighted levels break and lock to confirm direction for the next range.
We will keep the above in mind when taking buys from dips. Our updated levels and weighted levels will allow us to track the movement down and then catch bounces up.
We will continue to buy dips using our support levels taking 20 to 40 pips. As stated before each of our level structures give 20 to 40 pip bounces, which is enough for a nice entry and exit. If you back test the levels we shared every week for the past 24 months, you can see how effectively they were used to trade with or against short/mid term swings and trends.
The swing range give bigger bounces then our weighted levels that's the difference between weighted levels and swing ranges.
BULLISH TARGET
3236
EMA5 CROSS AND LOCK ABOVE 3236 WILL OPEN THE FOLLOWING BULLISH TARGETS
3278
EMA5 CROSS AND LOCK ABOVE 3278 WILL OPEN THE FOLLOWING BULLISH TARGET
3308
EMA5 CROSS AND LOCK ABOVE 3308 WILL OPEN THE FOLLOWING BULLISH TARGET
3343
EMA5 CROSS AND LOCK ABOVE 3343 WILL OPEN THE FOLLOWING BULLISH TARGETS
3373
EMA5 CROSS AND LOCK ABOVE 3373 WILL OPEN THE FOLLOWING BULLISH TARGETS
3418
BEARISH TARGETS
3184
EMA5 CROSS AND LOCK BELOW 3184 WILL OPEN THE FOLLOWING BEARISH TARGET
3146
EMA5 CROSS AND LOCK BELOW 3146 WILL OPEN THE SWING RANGE
3103
3069
EMA5 CROSS AND LOCK BELOW 3069 WILL OPEN THE SECONDARY SWING RANGE
3030
2981
As always, we will keep you all updated with regular updates throughout the week and how we manage the active ideas and setups. Thank you all for your likes, comments and follows, we really appreciate it!
Mr Gold
GoldViewFX
GOLD WEEKLY CHART MID/LONG TERM ROUTE MAPHey Everyone,
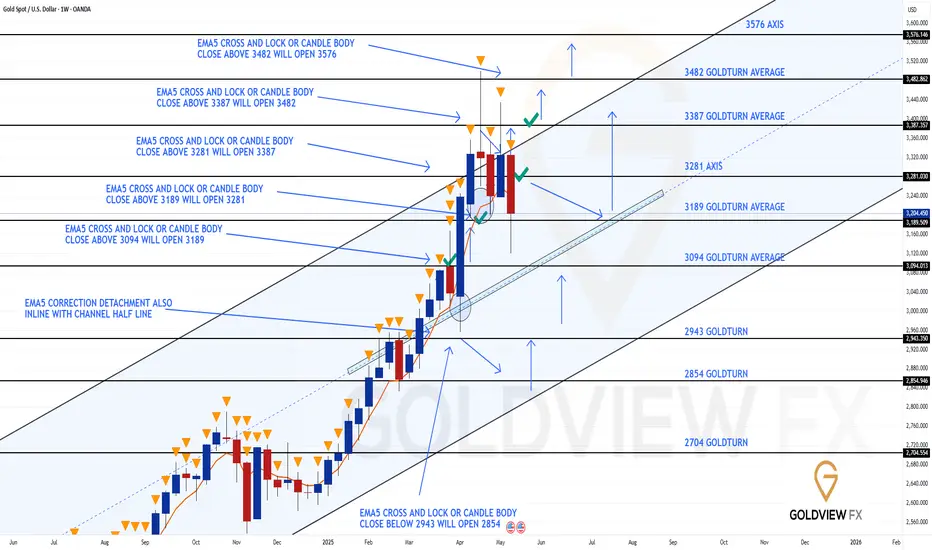
Here’s our weekly chart update. Once again, the Goldturn channel is proving reliable, with price action unfolding as expected. Over the past few weeks, we saw multiple attempts to break above the top of the channel, but each was rejected , confirmed by the EMA5 failing to break through.
Following this, price dropped to as low as 3189 and nearly reached 3094, aligning closely with the channels half line, a key support level we've been monitoring. We caught an early bounce there and capitalized on it using confluence from our lower time frame analysis, also shared with you all, on our 1h and 4h chart ideas.
As long as price holds above the channels half line, we’ll continue to look for bounce opportunities using levels from our smaller time frame setups. However, if price crosses and holds below the half line, it may open the door for a move toward the lower boundary of the channel.
As always, patience and precision are key. We'll continue using the 1H and 4H timeframes to buy dips on retracements into these support zones, targeting clean 20–40 pip moves. These levels and pullbacks offer ideal opportunities, especially in ranging conditions where our Goldturn method truly shines.
This is exactly why we rely on our Goldturn Channels, our proprietary system built on weighted averages. It filters the noise, helps us spot real breakouts vs. fake-outs, and gives us the confidence to act with clarity and discipline.
Thanks again for all the support, your likes, comments and follows.
MR GOLD
GOLDVIEWFX
GOLD DAILY CHART ROUTE MAP UPDATEHey Everyone,
This daily chart idea played out exactly as analysed. The channel top provided strong resistance, with EMA5 failing to cross and lock outside the channel confirming the rejection.
Price then moved down to the channel half line, which, as we anticipated, held firmly as support and delivered the expected bounce. This move aligned perfectly with our plan to buy dips, demonstrating once again the precision of the Goldturn channel methodology.
This is the beauty of our Goldturn channels, drawn using weighted averages instead of pure price action. This unique approach helps us clearly identify fake-outs and real breakouts, cutting out much of the noise that usually confuses traders.
We will now come back Sunday with our updated Multi time-frame analysis, Gold route map and trading plans for the week ahead.
Have a smashing weekend!! And once again, thank you all for your likes, comments and follows, we really appreciate it!
Mr Gold
GoldViewFX

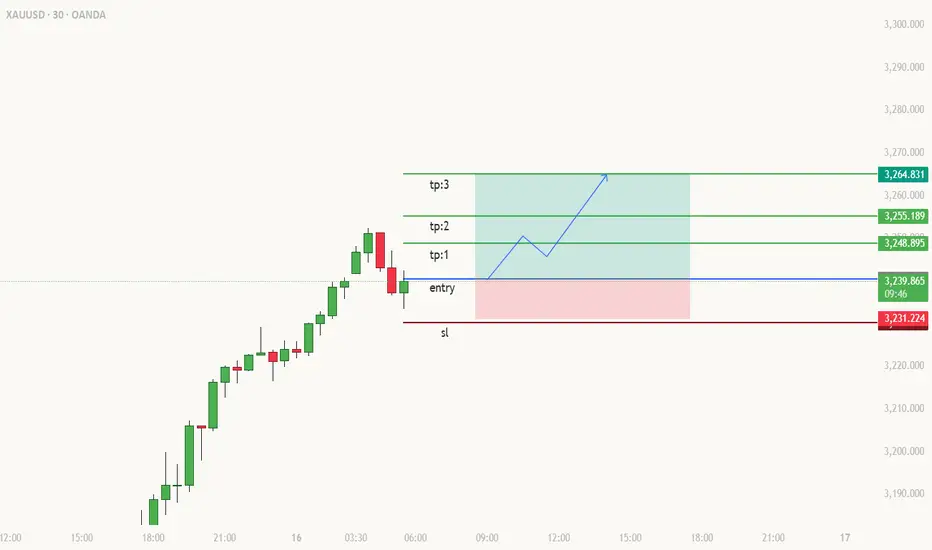
Gold Bulls Reloading from 3239 | Break-and-Retest Long SetupGold (XAUUSD) is still riding a solid bullish wave after yesterday's strong move. The price surged sharply and is now setting up a classic break-and-retest pattern around the 3239 demand zone on the 30-minute chart.
After hitting a local peak, the price pulled back to the previous breakout level, creating a potential re-entry point for buyers. This movement fits well with the intraday structure and momentum, making it a high-probability continuation setup.
As long as the 3231 support level holds, the bullish outlook stays intact. The rejection wick from this area shows early signs of buyer interest, and a small bullish candle confirmation from here could spark another upward move.
🔹 Trade Plan:
Entry: 3239 (retest of broken structure)
Stop Loss: 3231 (below rejection wick & minor support)
Take Profits:
TP1: 3248 – minor resistance
TP2: 3255 – price imbalance fill
TP3: 3264 – extended target / top liquidity zone
GOLD 4H CHART ROUTE MAP UPDATE Hey Everyone,
Another productive session on the charts, with our strategy of buying dips delivering solid results once again.
This is a follow up on our 4-hour chart setup. The week began with our initial bearish targets being achieved, each confirmed by decisive candle body closures. Additionally, momentum conditions allowed for EMA5 lock confirmations at key levels, reinforcing the validity of the moves.
Today, price action tested the secondary swing range following a confirmed break and EMA5 lock below the primary swing zone. This led to a clean retracement and a reaction from the secondary swing range, with price covering the full range of the swing, a strong technical sign of structure respecting prior levels.
Looking ahead, we are closely monitoring for one of two scenarios:
1. Primary swing range completion – If price continues its upward momentum and completes the move back to the primary range, this could set the stage for a potential breakout.
2. Rejection at current zone – Should price fail to reclaim the primary swing range, we anticipate a retest of the lower Goldturn zones as support. A successful hold and bounce from this level would reinforce the broader range dynamics and offer renewed long opportunities.
We'll remain reactive to price structure and momentum alignment, especially in relation to key support/resistance levels.
Mr Gold
GOLDVIEWFX
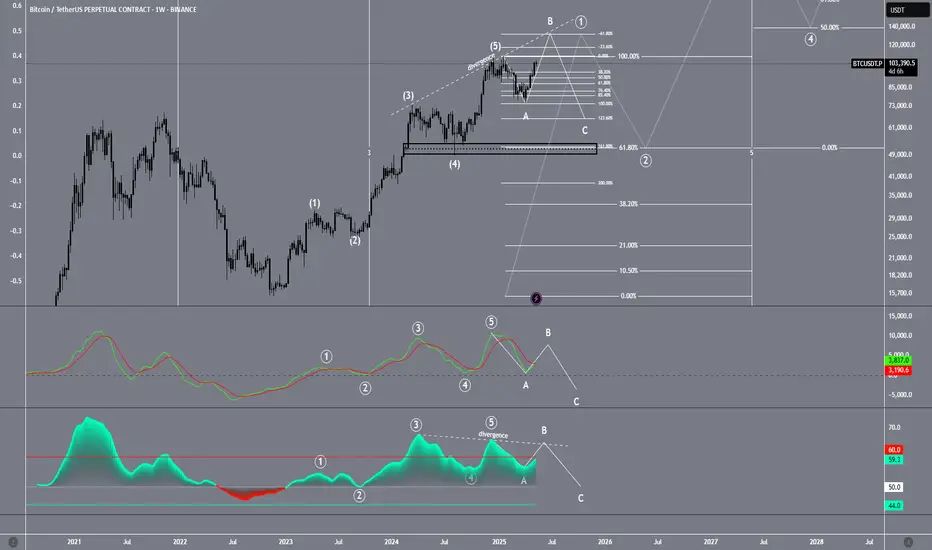
BTC bull cycle comes to an end.We can see it clearly on the chart. BTC has ended the 5 waves pattern in Elliot wave count. you can see it on the chart, you can see it on the MACD & RSI.
What we are seeing now is that because of Greed & Hype no one is selling bitcoin. the up-trend we are seeing now is the result of no sellers and Hype Buyers. This is a bull trap. We can see the divergence clear as day. Stay alert and dont let them catch you this time.
GOLD WEEKLY CHART MID/LONG TERM ROUTE MAPHey Everyone,
Here’s the latest follow-up on our weekly chart setup and as anticipated, it’s playing out as analysed with the test into the top of our Goldturn Ascending Channel and rejection.
Price tested the upper boundary but failed to secure a sustained breakout. The EMA5 did not cross and lock outside the channel, signaling a lack of confirmation for bullish continuation. Instead, the top of the channel acted as a clean resistance zone, resulting in a firm rejection.
We are now seeing price pull back toward our identified support zones at 3281 and 3189, of which price can slowly align with the channel’s midline with either price finding support here, or we look for it to gradually sync up with the half-line of the channel for structural support.
As always, patience and precision are key. We'll continue using the 1H and 4H timeframes to buy dips on retracements into these support zones, targeting clean 30–40 pip moves. These levels and pullbacks offer ideal opportunities, especially in ranging conditions where our Goldturn method truly shines.
This is exactly why we rely on our Goldturn Channels, our proprietary system built on weighted averages. It filters the noise, helps us spot real breakouts vs. fake-outs, and gives us the confidence to act with clarity and discipline.
Thanks again for all the support, your likes, comments and follows.
MR GOLD
GOLDVIEWFX
