GOLD 4H CHART ROUTE MAP UPDATE & TRADING PLAN FOR THE WEEKHey Everyone,
Please see our updated 4h chart levels and targets for the coming week.
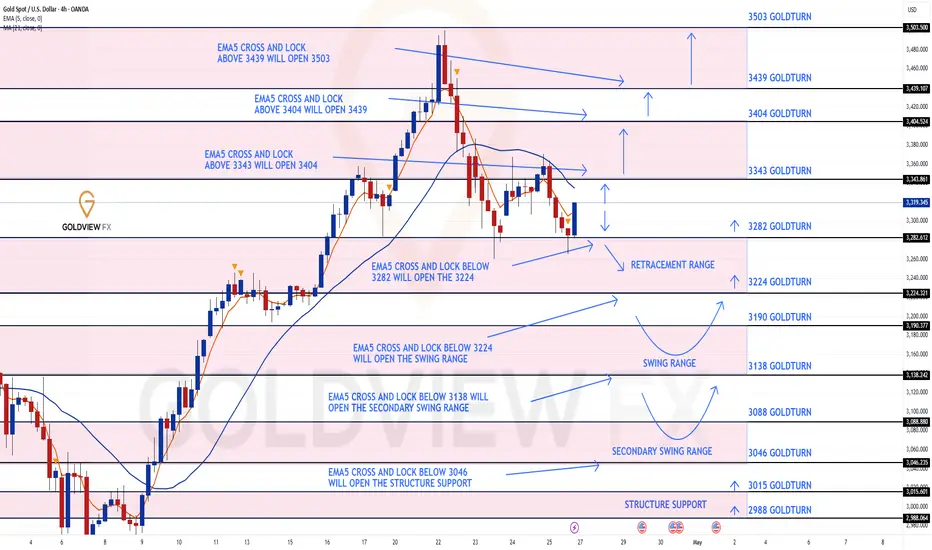
We are seeing price play between two weighted levels with a gap above at 3343 and a gap below at 3282. We will need to see ema5 cross and lock on either weighted level to determine the next range. We have a bigger range in play then usual.
We will see levels tested side by side until one of the weighted levels break and lock to confirm direction for the next range.
We will keep the above in mind when taking buys from dips. Our updated levels and weighted levels will allow us to track the movement down and then catch bounces up.
We will continue to buy dips using our support levels taking 30 to 40 pips. As stated before each of our level structures give 20 to 40 pip bounces, which is enough for a nice entry and exit. If you back test the levels we shared every week for the past 24 months, you can see how effectively they were used to trade with or against short/mid term swings and trends.
BULLISH TARGET
3343
EMA5 CROSS AND LOCK ABOVE 3343 WILL OPEN THE FOLLOWING BULLISH TARGET
3404
EMA5 CROSS AND LOCK ABOVE 3404 WILL OPEN THE FOLLOWING BULLISH TARGET
3439
EMA5 CROSS AND LOCK ABOVE 3439 WILL OPEN THE FOLLOWING BULLISH TARGET
3503
BEARISH TARGETS
3282
EMA5 CROSS AND LOCK BELOW 3282 WILL OPEN THE FOLLOWING BEARISH TARGET
3224
EMA5 CROSS AND LOCK BELOW 3224 WILL OPEN THE SWING RANGE
SWING RANGE
3190 - 3138
EMA5 CROSS AND LOCK BELOW 3138 WILL OPEN THE SECONDARY SWING RANGE
SECONDARY SWING RANGE
3088 - 3046
As always, we will keep you all updated with regular updates throughout the week and how we manage the active ideas and setups. Thank you all for your likes, comments and follows, we really appreciate it!
Mr Gold
GoldViewFX
Tradingideas
GOLD DAILY CHART ROUTE MAP UPDATEHey Everyone,
Here’s the latest update on our daily chart idea, it’s been playing out perfectly!
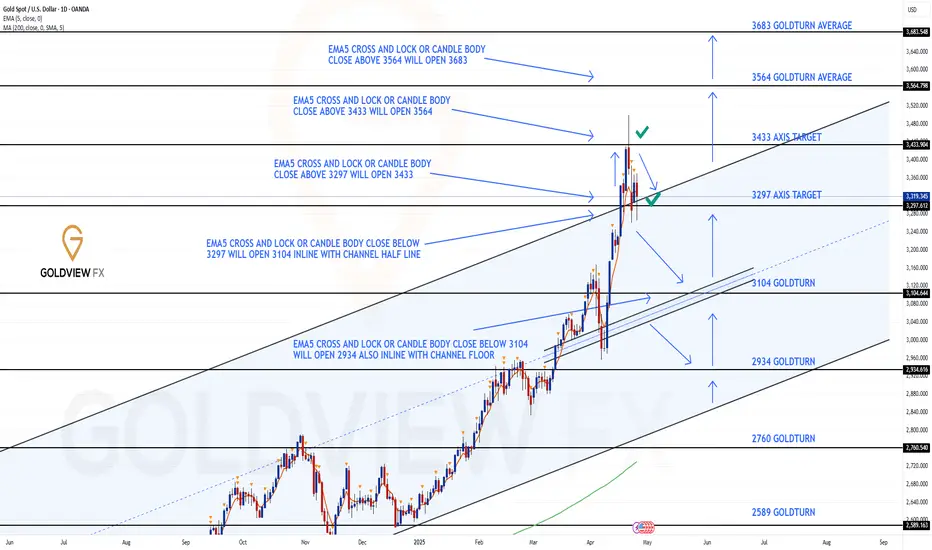
After we got the close above 3297, the gap up to 3433 completed exactly as we had analysed. However, without a further close or lock above 3433, the rejection was confirmed with a wick, and price then found support above the channel top, just as we always highlight.
With EMA5 still holding above the channel top, we’re likely to continue seeing support and price action playing above the channel. This opens the door for another retest of 3433. However, if price breaks back inside the channel along with EMA5, the levels inside the channel will reactivate for level-to-level plays.
This is the beauty of our Goldturn channels, drawn using weighted averages instead of pure price action. This unique approach helps us clearly identify fake-outs and real breakouts, cutting out much of the noise that usually confuses traders.
Moving forward, we’ll focus on smaller timeframes (1H and 4H) to buy dips off the weighted Goldturns, aiming for clean 30–40 pip moves. Ranging markets are perfect for this style, allowing us to capitalize on quick moves without getting caught in the chop of larger swings.
Thank you all again for your continued likes, comments, and follows, we truly appreciate your support!
Mr Gold
GoldViewFX
GOLD ROUTE MAP UPDATEHey Everyone,
A great finish to the week with all our chart ideas completed, as analysed.
This is our 4h chart update that started with the open Bullish target and then all the way to the top into our final target with a few pips short and then followed with a perfect rejection on our final Goldturn.
The price dropped into each lower Goldturns for support and gave the 30 to 40 pip bounces like we always state. The final drop went and completed the open bearish target at 3282, completing this chart idea top to bottom.
BULLISH TARGET
3330 - DONE
EMA5 CROSS AND LOCK ABOVE 3330 WILL OPEN THE FOLLOWING BULLISH TARGET
3372 -DONE
EMA5 CROSS AND LOCK ABOVE 3372 WILL OPEN THE FOLLOWING BULLISH TARGET
3414 - DONE
EMA5 CROSS AND LOCK ABOVE 2414 WILL OPEN THE FOLLOWING BULLISH TARGET
3457 - DONE
EMA5 CROSS AND LOCK ABOVE 3457 WILL OPEN THE FOLLOWING BULLISH TARGET
3503 - DONE (FELL SHORT BY A FEW PIPS)
BEARISH TARGETS
3282 - DONE
We will now come back Sunday with our updated Multi time-frame analysis, Gold route map and trading plans for the week ahead.
Have a smashing weekend!! And once again, thank you all for your likes, comments and follows, we really appreciate it!
Mr Gold
GoldViewFX

GOLD DAILY CHART ROUTE MAP UPDATE
Hey Everyone,
Another smashing day on the charts today with our analysis playing out perfectly. This is an update from yesterday, which you can read below for continuity.
After completing the target yesterday we stated We are now looking for support above the channel top for a continuation or a ema5 lock inside the channel will see price play back into the channel levels.
- We got the support and bounce just outside the channel, just like we said and perfectly inline with our plans to buy dips.
This is now a crucial range test with either support here for a continuation or a break back into the channel. We will be looking for ema5 to confirm the break or failure to identify rejection.
Thank you all for your likes, comments and follows, we really appreciate it!
Mr Gold
GoldViewFX
YESTERDAYS UPDATE
Hey Everyone,
After updating our 1H and 4h chart idea last two days, please see update on our daily chart idea also playing out perfectly.
On our last update we stated that we were seeing price break out of the channel but will need ema5 to lock outside of the channel to confirm the breakout into the next level.
We got the candle body above 3297 and ema5 lock opening 3433 - This was hit perfectly completing this target. No further close above this level confirmed the rejection.
We are now looking for support above the channel top for a continuation or a ema5 lock inside the channel will see price play back into the channel levels.
This is the beauty of our Goldturn channels, which we draw in our unique way, using averages rather than price. This enables us to identify fake-outs and breakouts clearly, as minimal noise in the way our channels are drawn.
We will use our smaller timeframe analysis on the 1H and 4H chart to buy dips from the weighted Goldturns for 30 to 40 pips clean. Ranging markets are perfectly suited for this type of trading, instead of trying to hold longer positions and getting chopped up in the swings up and down in the range.
We will keep the above in mind when taking buys from dips. Our updated levels and weighted levels will allow us to track the movement down and then catch bounces up using our smaller timeframe ideas.
Our long term bias is Bullish and therefore we look forward to drops from rejections, which allows us to continue to use our smaller timeframes to buy dips using our levels and setups.
Buying dips allows us to safely manage any swings rather then chasing the bull from the top.
Thank you all for your likes, comments and follows, we really appreciate it!
Mr Gold
GoldViewFX

The next trade idea for “6B” GBPUSD FX FuturesCME:6B1!
This trade idea is built on very simple premises.
Simplicity in trading is what we all strive for. Where possible, we should aim to simplify our strategies rather than complicate them with excessive information—unless the additional inputs add clear, actionable value to the trade thesis. While that holds true in this analysis, for the sake of clarity and simplicity, we’ve chosen not to include volume profile study or levels derived from volume profiling.
Also, don’t forget to check out how our example trade idea in Crude Oil played out —posted earlier this Tuesday.
6B Weekly Time frame:
Key Levels
Weekly Resistance: 1.3400 – 1.3425
Daily Double Top: 1.3425
April 21 Mid: 1.3350
April 2025 Developing Mid: 1.3067
Scenario 1: Break and Continuation
In this scenario, we anticipate further upside in 6B futures and GBPUSD. A break above the double top at 1.3425 could lead to a push toward 1.3550. Look for confirmation across other FX futures and signs of Dollar weakening to support this thesis.
Example Trade Idea 1:
Entry: 1.3425 (wait for an hourly candle to close above the double top, then enter on the pullback)
Stop: 1.3350
Target: 1.3550
Risk: 75 ticks
Reward: 125 ticks
Risk/Reward Ratio: 1.7 R
Scenario 2: Swing Failure on Weekly Timeframe
Zooming out to the weekly timeframe, 1.3425 aligns with a potential swing failure at prior resistance near 1.3423. A pullback from this level could provide a short opportunity. Watch for Dollar strength and pullbacks in 6E and 6J to further support this thesis.
Example Trade Idea 2:
Entry: 1.3350 (wait for sellers to regain control at Monday’s mid)
Stop: 1.3425
Target: 1.3067
Risk: 75 ticks
Reward: 283 ticks
Risk/Reward Ratio: 3.7 R
Important Notes:
These are example trade ideas provided strictly for educational purposes and should not be considered trade recommendations.
Traders are encouraged to perform their own independent analysis and thorough preparation before entering any positions.
Please note: Stop losses are not guaranteed to execute at specified levels. Actual losses may exceed predetermined stop amounts.

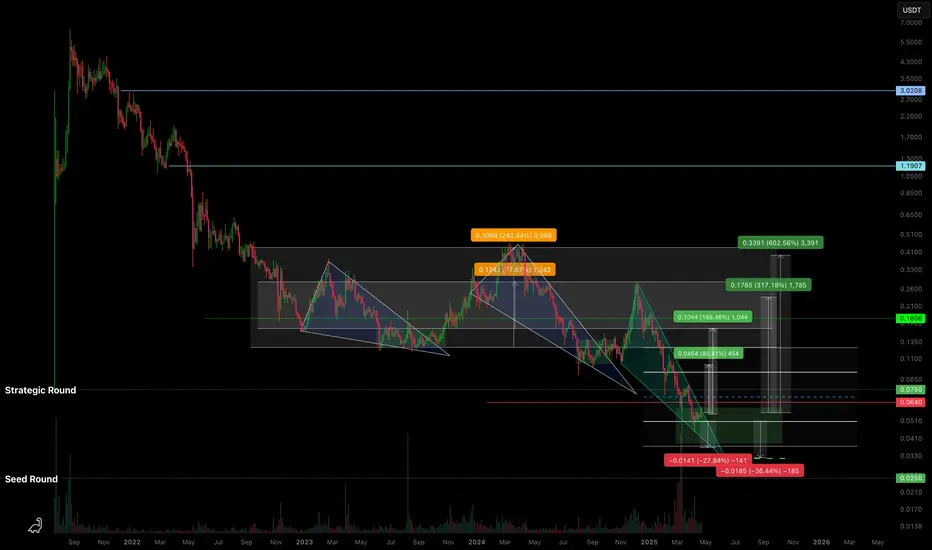
C98USDT — Descending Wedge & High R/R ZoneBased on the current structure, BINANCE:C98USDT is moving within a descending wedge , approaching zones that align with early investor positions.
🔍 What I’m seeing:
Potential drop into the range of a previous horizontal channel - marked on the chart.
We've already reached the Strategic Round level; below that is the Seed Round .
Assuming the project isn’t abandoned, it makes sense to expect investor defense in this zone.
From what I observe, there's likely accumulation happening from weak hands - at a discount .
🛡️ Approach:
As I’ve said before - you can’t treat coins like this in isolation .
They should be traded as part of a group of low-liquidity tokens , with proper risk management .
You can’t know in advance which one will “survive” without insider info from the team.
So the key is having a solid strategy and managing your portfolio and risk wisely .
📈 Targets:
Potential breakout targets from the wedge are marked on the chart.
If the market remains weak, I’ve noted a lower zone where consolidation might occur (sideways chop within a horizontal channel).
💭 Opinion:
The market is “paused” and waiting for a catalyst. You can’t rush it.
But zones like the current one on BINANCE:C98USDT seem attractive in terms of risk/reward .
The goal isn’t to guess - it’s to follow a pre-built strategy and stay focused .
📌 As always, this is not financial advice. Just my personal take and observations on the structure.
GOLD DAILY CHART MID/LONG TERM UPDATEHey Everyone,
After updating our 1H and 4h chart idea last two days, please see update on our daily chart idea also playing out perfectly.
On our last update we stated that we were seeing price break out of the channel but will need ema5 to lock outside of the channel to confirm the breakout into the next level.
We got the candle body above 3297 and ema5 lock opening 3433 - This was hit perfectly completing this target. No further close above this level confirmed the rejection.
We are now looking for support above the channel top for a continuation or a ema5 lock inside the channel will see price play back into the channel levels.
This is the beauty of our Goldturn channels, which we draw in our unique way, using averages rather than price. This enables us to identify fake-outs and breakouts clearly, as minimal noise in the way our channels are drawn.
We will use our smaller timeframe analysis on the 1H and 4H chart to buy dips from the weighted Goldturns for 30 to 40 pips clean. Ranging markets are perfectly suited for this type of trading, instead of trying to hold longer positions and getting chopped up in the swings up and down in the range.
We will keep the above in mind when taking buys from dips. Our updated levels and weighted levels will allow us to track the movement down and then catch bounces up using our smaller timeframe ideas.
Our long term bias is Bullish and therefore we look forward to drops from rejections, which allows us to continue to use our smaller timeframes to buy dips using our levels and setups.
Buying dips allows us to safely manage any swings rather then chasing the bull from the top.
Thank you all for your likes, comments and follows, we really appreciate it!
Mr Gold
GoldViewFX

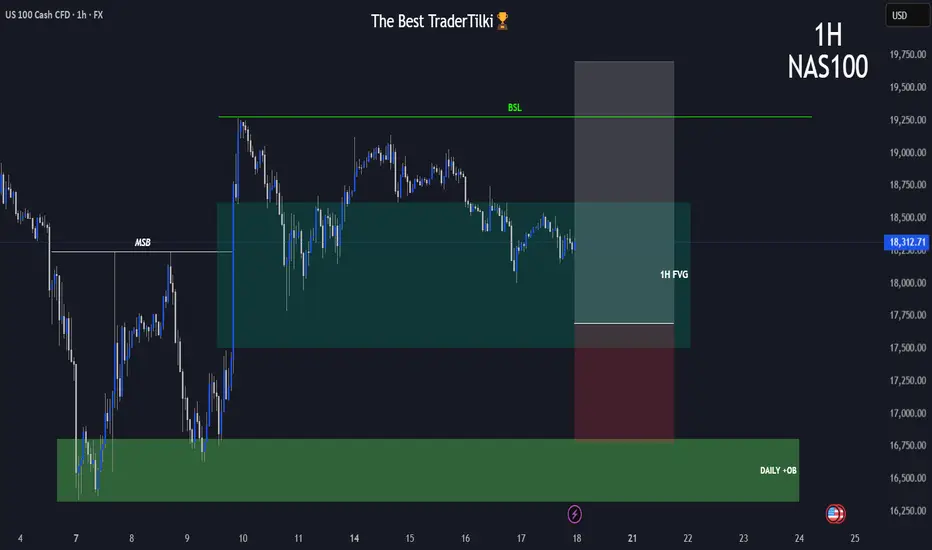
NAS100 | 1H | BUY ZONEHey There;
SIGNAL ALERT
BUY NAS100 / 17,682,18
🟢TP1: 18,000,00
🟢TP2: 18,500,00
🟢TP3: 19,726,64
🔴SL: 16,782,61
RR / 2,2
Please don't forget to like 🙏🏻
Thanks to everyone who supports my analysis with likes. 💙💙💙
GOLD 4H CHART ROUTE MAP UPDATEHey Everyone,
Another great day on the markets today. After completing our 1h chart route map yesterday, we moved onto our 4 chart route map.
On this chart idea, we got our Bullish target at 3330 hit, followed with candle body close gaps to 3372 and 3414, as ema5 didn't catch up due to momentum. However, the body close breaks on each level still gave us enough time for the confirmation before being hit.
We then managed to get ema5 cross and lock above 3414 opening 3457, which was also hit perfectly, completing this target with confirmation. No further lock above 3457 confirmed the rejection. However, we now have a body close above 3457 with a gap to 3503, which just fell short by a few pips.
We will keep the above in mind when taking buys from dips. Our updated levels and weighted levels will allow us to track the movement down and then catch bounces up.
We will continue to buy dips using our support levels taking 30 to 40 pips. As stated before each of our level structures give 20 to 40 pip bounces, which is enough for a nice entry and exit. If you back test the levels we shared every week for the past 24 months, you can see how effectively they were used to trade with or against short/mid term swings and trends.
BULLISH TARGET
3330 - DONE
EMA5 CROSS AND LOCK ABOVE 3330 WILL OPEN THE FOLLOWING BULLISH TARGET
3372 - DONE
EMA5 CROSS AND LOCK ABOVE 3372 WILL OPEN THE FOLLOWING BULLISH TARGET
3414 - DONE
EMA5 CROSS AND LOCK ABOVE 3414 WILL OPEN THE FOLLOWING BULLISH TARGET
3457 - DONE
EMA5 CROSS AND LOCK ABOVE 3457 WILL OPEN THE FOLLOWING BULLISH TARGET
3503
BEARISH TARGETS
3282
EMA5 CROSS AND LOCK BELOW 3282 WILL OPEN THE RETRACEMENT RANGE
3224
3190
EMA5 CROSS AND LOCK BELOW 3190 WILL OPEN THE SWING RANGE
SWING RANGE
3131 - 3077
As always, we will keep you all updated with regular updates throughout the week and how we manage the active ideas and setups. Thank you all for your likes, comments and follows, we really appreciate it!
Mr Gold
GoldViewFX

GOLD ROUTE MAP UPDATEHey Everyone,
Great start to the week with our 1H chart idea playing out perfectly completing all our targets.
We started with our Bullish target at 3341 hit, followed with candle body close gaps to 3362 and 3382, as ema5 didn't catch up for the lock due to momentum. However, the body close breaks on each level still gave us enough time for the confirmation. The final gap at 3410 did give us the ema5 cross and lock confirmation above 3384 opening 3410 and then completed the target perfectly!!
This 1H chart idea is now complete. We can now move onto our 4H chart idea for the remaining targets to track and trade throughout the week. However, If we see price fall back into the 1h chart range, then we can continue to use the levels bellow, as they should be respected.
We will keep the above in mind when taking buys from dips. Our updated levels and weighted levels will allow us to track the movement down and then catch bounces up.
We will continue to buy dips using our support levels taking 30 to 40 pips. As stated before each of our level structures give 20 to 40 pip bounces, which is enough for a nice entry and exit. If you back test the levels we shared every week for the past 24 months, you can see how effectively they were used to trade with or against short/mid term swings and trends.
The swing range give bigger bounces then our weighted levels that's the difference between weighted levels and swing ranges.
BULLISH TARGET
3341 - DONE
EMA5 CROSS AND LOCK ABOVE 3341 WILL OPEN THE FOLLOWING BULLISH TARGET
3362 - DONE
EMA5 CROSS AND LOCK ABOVE 3362 WILL OPEN THE FOLLOWING BULLISH TARGET
3384 - DONE
EMA5 CROSS AND LOCK ABOVE 3384 WILL OPEN THE FOLLOWING BULLISH TARGET
3410 - DONE
As always, we will keep you all updated with regular updates throughout the week and how we manage the active ideas and setups. Thank you all for your likes, comments and follows, we really appreciate it!
Mr Gold
GoldViewFX
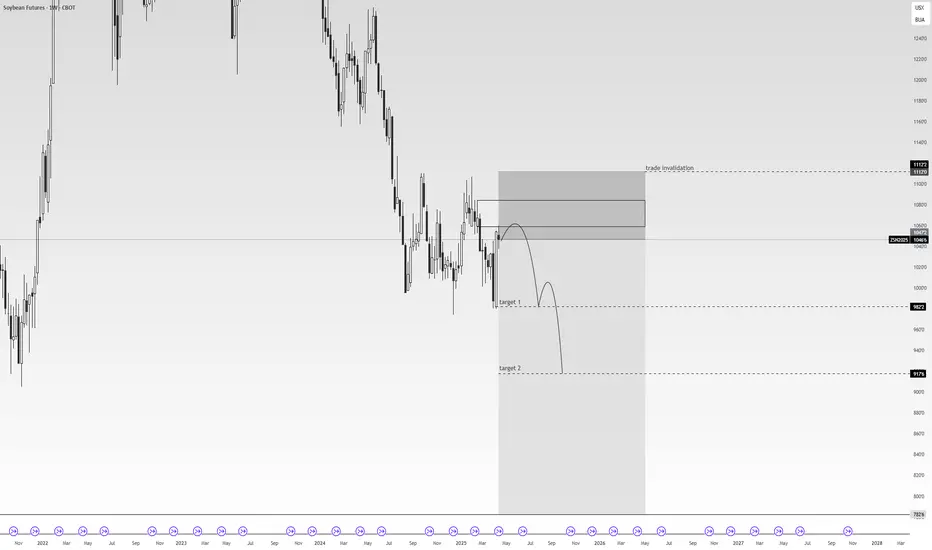
SOYBEAN, Weekly Supply/Demand+fundamentals we are kicking of the year with a clear technical rejection from $1050 to $1112 weekly supply zone. Price pushed agressively into this area and has now printed multiple rejection candles on the daily, confirming the zones strength.
fundamentals are showing bearish positioning aligned with the technical setup.
entry wil be at market open. first target is at break of recent support and if fundamentals stil support the bias by then we wil also aim for target two.
simple structure, clean confirmation. lets see if price delivers.
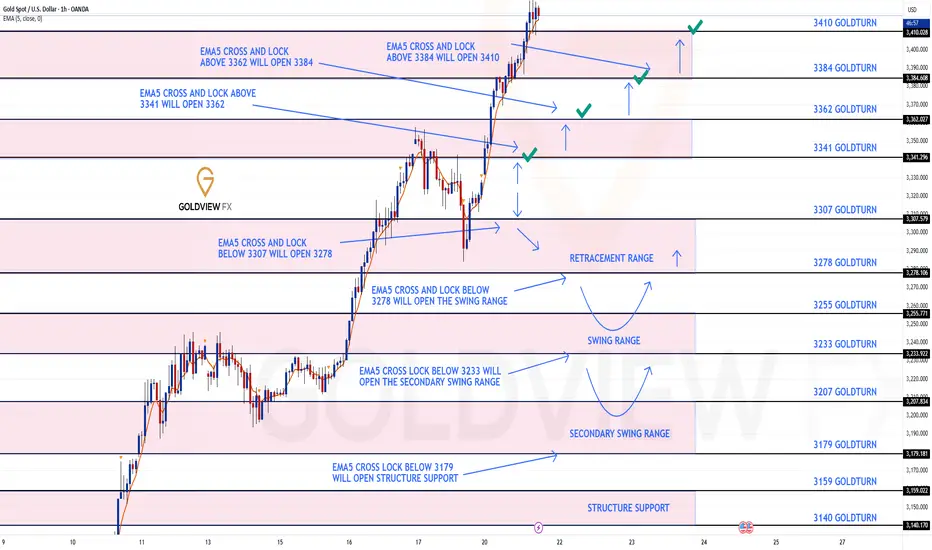
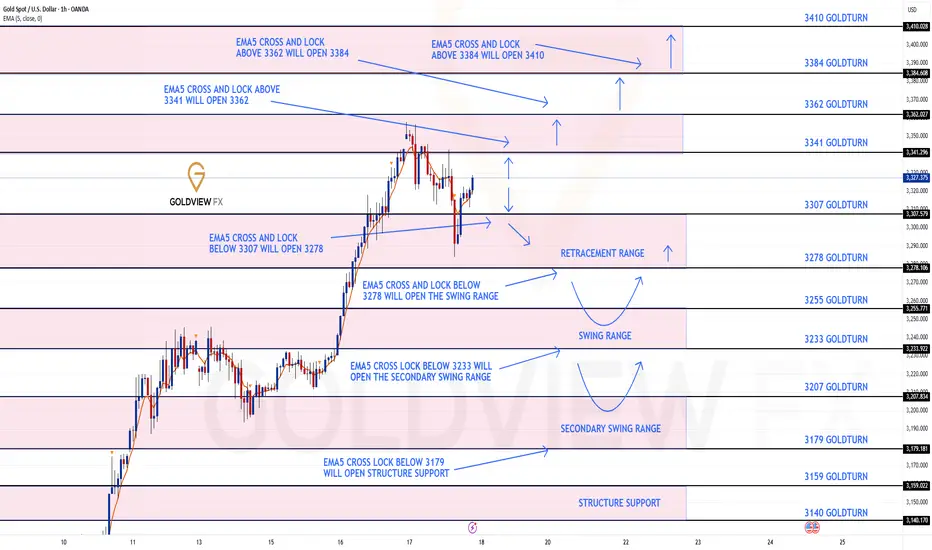
GOLD 1H CHART ROUTE MAP & TRADING PLAN FOR THE WEEKHey Everyone,
Please see our updated 1h chart levels and targets for the coming week.
We are seeing price play between two weighted levels with a gap above at 3341 and a gap below at 3307. We will need to see ema5 cross and lock on either weighted level to determine the next range.
We will see levels tested side by side until one of the weighted levels break and lock to confirm direction for the next range.
We will keep the above in mind when taking buys from dips. Our updated levels and weighted levels will allow us to track the movement down and then catch bounces up.
We will continue to buy dips using our support levels taking 30 to 40 pips. As stated before each of our level structures give 20 to 40 pip bounces, which is enough for a nice entry and exit. If you back test the levels we shared every week for the past 24 months, you can see how effectively they were used to trade with or against short/mid term swings and trends.
The swing range give bigger bounces then our weighted levels that's the difference between weighted levels and swing ranges.
BULLISH TARGET
3341
EMA5 CROSS AND LOCK ABOVE 3341 WILL OPEN THE FOLLOWING BULLISH TARGET
3362
EMA5 CROSS AND LOCK ABOVE 3362 WILL OPEN THE FOLLOWING BULLISH TARGET
3384
EMA5 CROSS AND LOCK ABOVE 3384 WILL OPEN THE FOLLOWING BULLISH TARGET
3410
BEARISH TARGETS
3307
EMA5 CROSS AND LOCK BELOW 3307 WILL OPEN THE FOLLOWING BEARISH TARGET
3278
EMA5 CROSS AND LOCK BELOW 3278 WILL OPEN THE SWING RNGE
3255
3233
EMA5 CROSS AND LOCK BELOW 3233 WILL OPEN THE SECONDARY SWING RANGE
SECONDARY SWING RANGE
3027 - 3179
As always, we will keep you all updated with regular updates throughout the week and how we manage the active ideas and setups. Thank you all for your likes, comments and follows, we really appreciate it!
Mr Gold
GoldViewFX
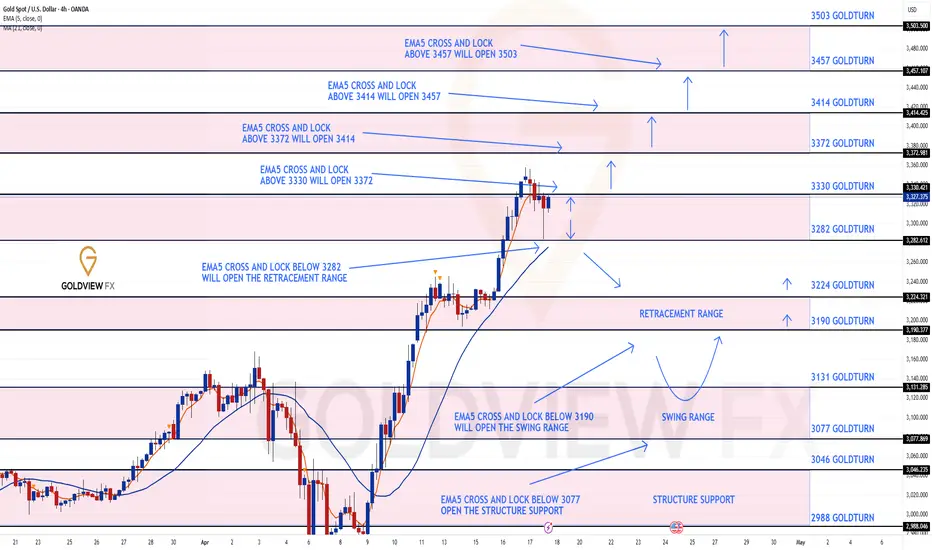
GOLD 4H CHART ROUTE MAP UPDATE & TRADING PLAN FOR THE WEEKHey Everyone,
Please see our updated 4h chart levels and targets for the coming week.
We are seeing price play between two weighted levels with a gap above at 3330 and a gap below at 3282. We will need to see ema5 cross and lock on either weighted level to determine the next range. We have a bigger range in play then usual.
We will see levels tested side by side until one of the weighted levels break and lock to confirm direction for the next range.
We will keep the above in mind when taking buys from dips. Our updated levels and weighted levels will allow us to track the movement down and then catch bounces up.
We will continue to buy dips using our support levels taking 30 to 40 pips. As stated before each of our level structures give 20 to 40 pip bounces, which is enough for a nice entry and exit. If you back test the levels we shared every week for the past 24 months, you can see how effectively they were used to trade with or against short/mid term swings and trends.
BULLISH TARGET
3330
EMA5 CROSS AND LOCK ABOVE 3330 WILL OPEN THE FOLLOWING BULLISH TARGET
3372
EMA5 CROSS AND LOCK ABOVE 3372 WILL OPEN THE FOLLOWING BULLISH TARGET
3414
BEARISH TARGETS
3282
EMA5 CROSS AND LOCK BELOW 3282 WILL OPEN THE RETRACEMENT RANGE
3224
3190
EMA5 CROSS AND LOCK BELOW 3190 WILL OPEN THE SWING RANGE
SWING RANGE
3131 - 3077
As always, we will keep you all updated with regular updates throughout the week and how we manage the active ideas and setups. Thank you all for your likes, comments and follows, we really appreciate it!
Mr Gold
GoldViewFX
GOLD DAILY CHART MID/LONG TERM UPDATEHey Everyone,
After completing our last daily chart idea please see update on our new daily chart idea. We have also updated a new Goldturn ascending channel.
We are seeing price break out of the channel but will need ema5 to lock outside of the channel to confirm the breakout vs a fakeout. If this happens then the channel top is likely to to form support for a continuation, just like we are seeing the current candles bounce from the channel top, as support.
This is the beauty of our Goldturn channels, which we draw in our unique way, using averages rather than price. This enables us to identify fake-outs and breakouts clearly, as minimal noise in the way our channels are drawn.
We will use our smaller timeframe analysis on the 1H and 4H chart to buy dips from the weighted Goldturns for 30 to 40 pips clean. Ranging markets are perfectly suited for this type of trading, instead of trying to hold longer positions and getting chopped up in the swings up and down in the range.
We will keep the above in mind when taking buys from dips. Our updated levels and weighted levels will allow us to track the movement down and then catch bounces up using our smaller timeframe ideas.
Our long term bias is Bullish and therefore we look forward to drops from rejections, which allows us to continue to use our smaller timeframes to buy dips using our levels and setups.
Buying dips allows us to safely manage any swings rather then chasing the bull from the top.
Thank you all for your likes, comments and follows, we really appreciate it!
Mr Gold
GoldViewFX

GOLD WEEKLY CHART MID/LONG TERM ROUTE MAPHey Everyone,
Please see update on our week chart idea, which has been playing out perfectly allowing us to track the movement down and trade the movement up and finally complete - BOOOOM!!!
After completed all our [previous targets on this chart, we were left with a body close above 3189 leaving a long range/term gap to 3281. This target was hit last week completed this chart idea.
We will now update a new weekly chart idea next week with more long term/range projections. Please keep an eye out for this for next Sunday or if we get a chance, we will try and get this out earlier.
However, please note if we see a rejection here on the channel top, then the lower levels within the channel, are still valid to track the movement down and up.
Thank you all for your likes, comments and follows, we really appreciate it!
Mr Gold
GoldViewFX

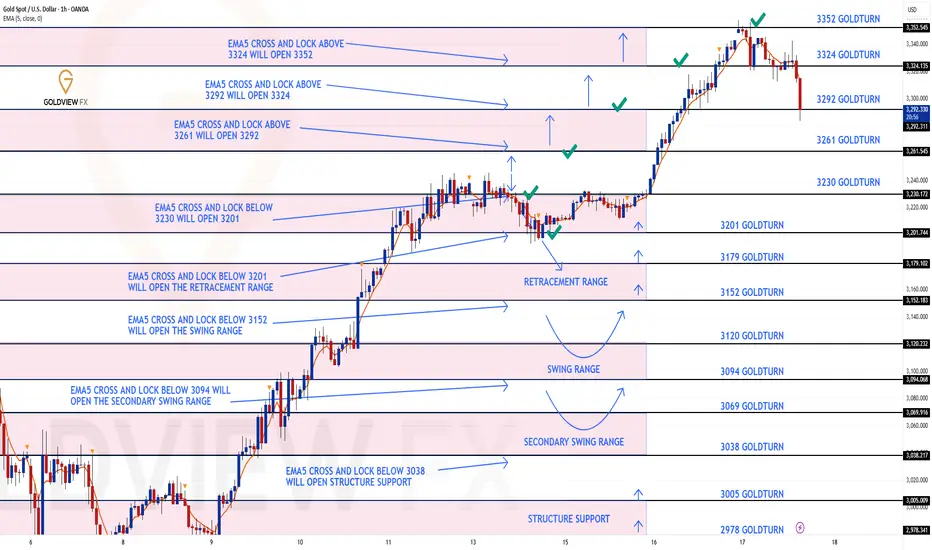
GOLD ROUTE MAP UPDATEHey Everyone,
Once again a great day on the market today with our chart idea playing out, as analysed. This chart idea is now fully complete with our final target being completed today.
Yesterday after completing 3324 we stated that we needed ema5 lock above 3324 to open 3352. We got the cross and lock above 3324 to open 3352, which was hit perfectly completing this target and this chart idea.
We now expect a rejection on this zone and then we can continue to catch bounces from the lower Goldturns.
We will keep the above in mind when taking buys from dips. Our updated levels and weighted levels will allow us to track the movement down and then catch bounces up.
We will continue to buy dips using our support levels taking 30 to 40 pips. As stated before each of our level structures give 20 to 40 pip bounces, which is enough for a nice entry and exit. If you back test the levels we shared every week for the past 24 months, you can see how effectively they were used to trade with or against short/mid term swings and trends.
The swing range give bigger bounces then our weighted levels that's the difference between weighted levels and swing ranges.
BULLISH TARGET
3261 - DONE
EMA5 CROSS AND LOCK ABOVE 3261 WILL OPEN THE FOLLOWING BULLISH TARGET
3292 - DONE
EMA5 CROSS AND LOCK ABOVE 3292 WILL OPEN THE FOLLOWING BULLISH TARGET
3324 - DONE
EMA5 CROSS AND LOCK ABOVE 3324 WILL OPEN THE FOLLOWING BULLISH TARGET
3352 - DONE
BEARISH TARGETS
3230 - DONE
EMA5 CROSS AND LOCK BELOW 3230 WILL OPEN THE FOLLOWING BEARISH TARGET
3201 - DONE
EMA5 CROSS AND LOCK BELOW 3201 WILL OPEN THE RETRACEMENT RANGE
3179
3152
EMA5 CROSS AND LOCK BELOW 3152 WILL OPEN THE SWING RANGE
3120
3094
EMA5 CROSS AND LOCK BELOW 3094 WILL OPEN THE SECONDARY SWING RANGE
SECONDARY SWING RANGE
3069 - 3038
As always, we will keep you all updated with regular updates throughout the week and how we manage the active ideas and setups. Thank you all for your likes, comments and follows, we really appreciate it!
Mr Gold
GoldViewFX
Trading opportunity for COWUSDTBased on technical factors there is a Sell position in :
📊 COWUSDT
🔴 Sell Now
🪫Stop loss 0.3620
🔋Target 0.1900
📏 R/R 1,2
💸RISK : 1%
We hope it is profitable for you ❤️
Please support our activity with your likes👍 and comments📝

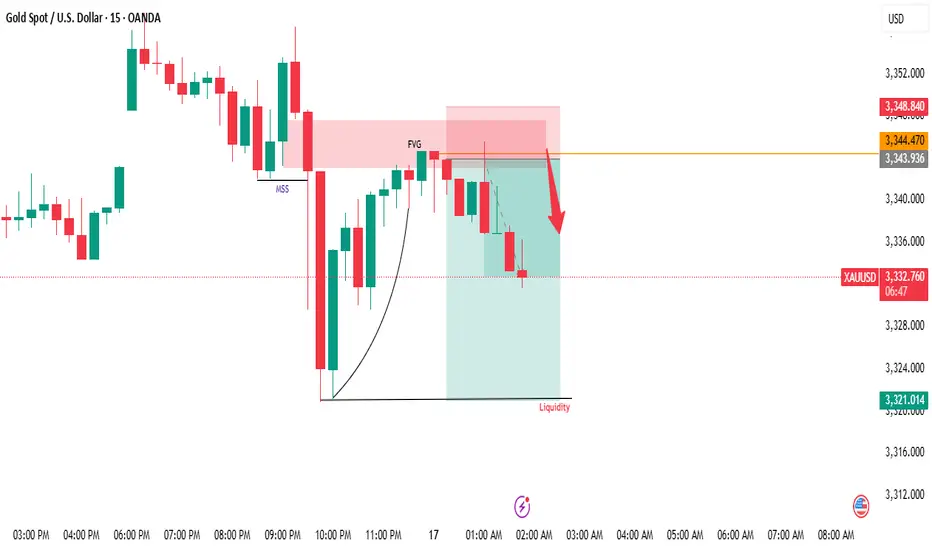
Markets next move will depend on its interaction with Key LevelsGold Analysis
MSS & FVG+Breaker Zone
Gold has given an MSS (Market Structure Shift) and touched the FVG+Breaker Zone, followed by a downward move. Given the current market structure, potential areas to watch for a stop and potential upside pump could be:
Possible Downside Targets:
1. $3321 liquidity level
2. Higher Time Frame (HTF) PD Arrays
Potential Upside Pump
If the market reaches these areas, we might see a pump upwards, driven by liquidity and market structure.
Key Levels to Watch:
- $3321 liquidity level
- HTF PD Arrays
Market Direction
The market's next move will depend on its interaction with these key levels. A potential bounce from these areas could signal an upside pump.
Let's monitor the market's movement and adjust our analysis accordingly.
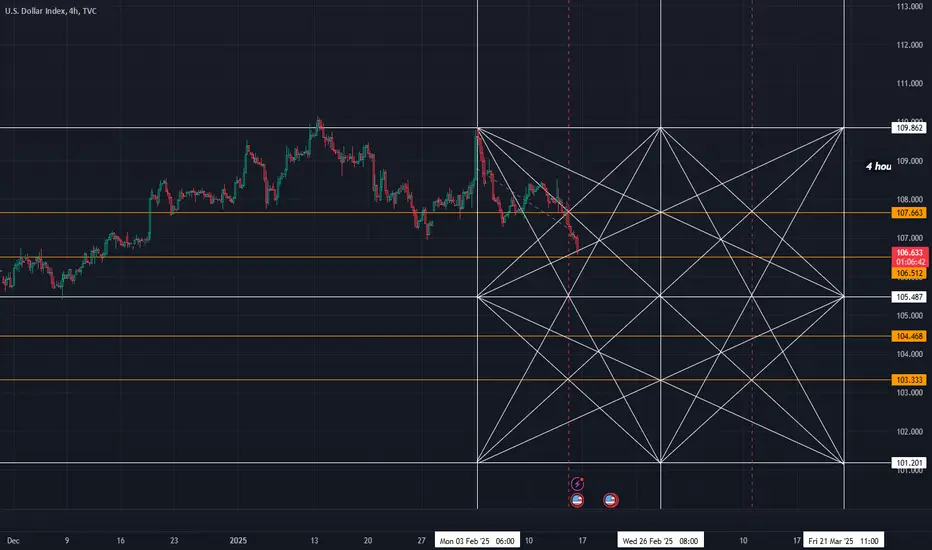
DXY – Key Level Broken, More Downside Ahead?Hello Folks , Long time no see .
The US Dollar Index (DXY) just broke below 106.5, and things are getting interesting. The trend has been weakening, and price is now sitting at a crucial zone.
📌 Here’s what I’m watching:
107.66 is the big resistance. If price can reclaim it, bulls might have a chance.
105.48 & 104.46 are the next major support levels.
👀 My Take:
If we stay below 106.5, I expect more downside towards 105.4 and maybe 103.3. If price bounces and reclaims 107, I’ll reconsider.
What’s your view? More downside or a bounce coming? Drop your thoughts below! 🚀🔥
🚨 Disclaimer:
Just sharing ideas here—this isn’t a trade advice . Everyone sees the market differently, and the goal is to improve our analysis, not tell anyone what to do. At the end of the day, your trades are your call, your responsibility. Trade smart! 🚀📊
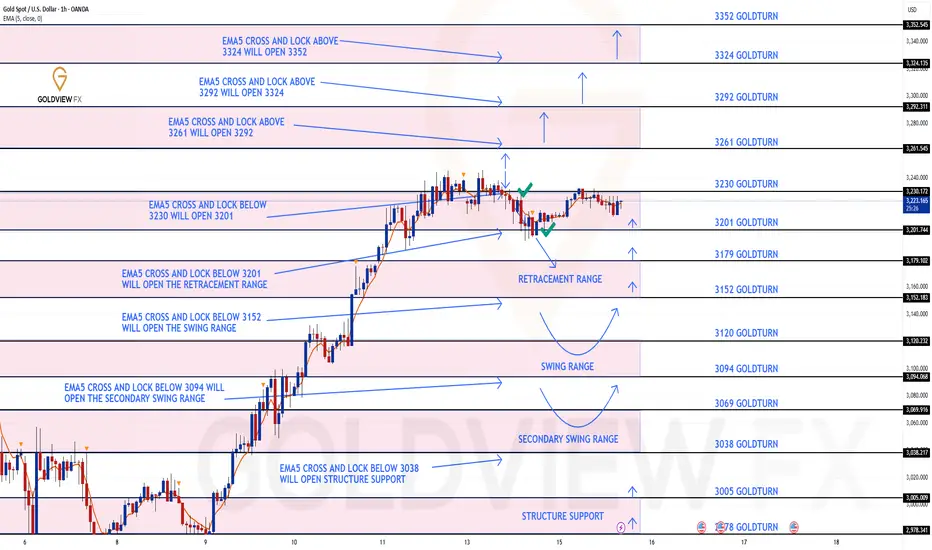
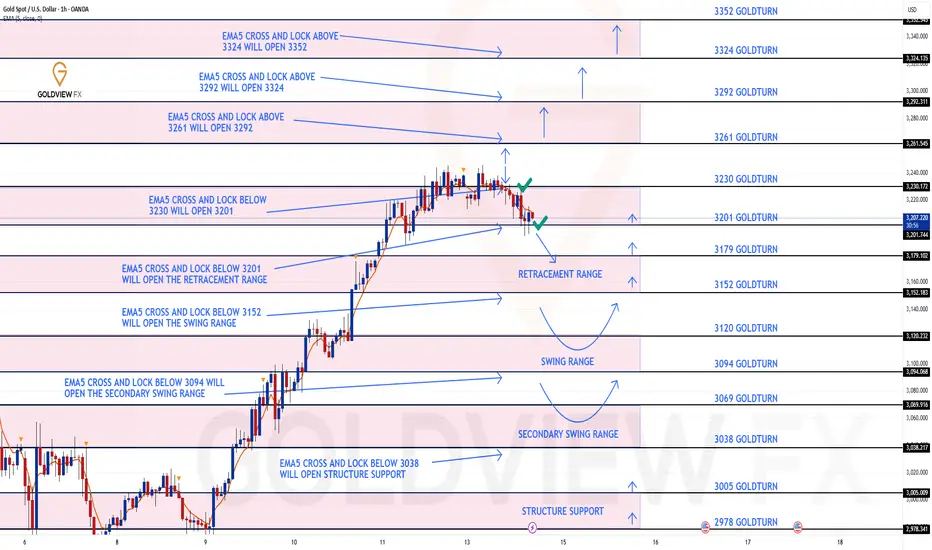
GOLD ROUTE MAP UPDATEHey Everyone,
Another great day on the charts with our levels playing out and respecting perfectly.
3201 Goldturn failed to lock below, which provided the support like we said and the bounce back into 3230.
We will now either look for a break and lock above 3230 for a continuation into the Bullish targets or we will continue to track the movement down with ema5 lock and catch the weighted level bounces inline with our plans to buy dips.
We will see levels tested side by side until one of the weighted levels break and lock to confirm direction for the next range.
We will keep the above in mind when taking buys from dips. Our updated levels and weighted levels will allow us to track the movement down and then catch bounces up.
We will continue to buy dips using our support levels taking 30 to 40 pips. As stated before each of our level structures give 20 to 40 pip bounces, which is enough for a nice entry and exit. If you back test the levels we shared every week for the past 24 months, you can see how effectively they were used to trade with or against short/mid term swings and trends.
The swing range give bigger bounces then our weighted levels that's the difference between weighted levels and swing ranges.
BULLISH TARGET
3261
EMA5 CROSS AND LOCK ABOVE 3261 WILL OPEN THE FOLLOWING BULLISH TARGET
3292
EMA5 CROSS AND LOCK ABOVE 3292 WILL OPEN THE FOLLOWING BULLISH TARGET
3324
EMA5 CROSS AND LOCK ABOVE 3324 WILL OPEN THE FOLLOWING BULLISH TARGET
3352
BEARISH TARGETS
3230 - DONE
EMA5 CROSS AND LOCK BELOW 3230 WILL OPEN THE FOLLOWING BEARISH TARGET
3201 - DONE
EMA5 CROSS AND LOCK BELOW 3201 WILL OPEN THE RETRACEMENT RANGE
3179
3152
EMA5 CROSS AND LOCK BELOW 3152 WILL OPEN THE SWING RANGE
3120
3094
EMA5 CROSS AND LOCK BELOW 3094 WILL OPEN THE SECONDARY SWING RANGE
SECONDARY SWING RANGE
3069 - 3038
As always, we will keep you all updated with regular updates throughout the week and how we manage the active ideas and setups. Thank you all for your likes, comments and follows, we really appreciate it!
Mr Gold
GoldViewFX
GOLD ROUTE MAP UPDATEHey Everyone,
Great start to the week with our chart idea playing out, as analysed.
We started of with our bearish target hit at 3230 followed with ema5 cross and lock below 3230 opening 3201, which was hit perfectly and followed with the weighted bounce of over 40 pips inline with our plans to buy dips.
We will now either look for support above this Goldturn level for a continuation above or a cross and lock below 3201 will open the Goldturn level below.
We will see levels tested side by side until one of the weighted levels break and lock to confirm direction for the next range.
We will keep the above in mind when taking buys from dips. Our updated levels and weighted levels will allow us to track the movement down and then catch bounces up.
We will continue to buy dips using our support levels taking 30 to 40 pips. As stated before each of our level structures give 20 to 40 pip bounces, which is enough for a nice entry and exit. If you back test the levels we shared every week for the past 24 months, you can see how effectively they were used to trade with or against short/mid term swings and trends.
The swing range give bigger bounces then our weighted levels that's the difference between weighted levels and swing ranges.
BULLISH TARGET
3261
EMA5 CROSS AND LOCK ABOVE 3261 WILL OPEN THE FOLLOWING BULLISH TARGET
3292
EMA5 CROSS AND LOCK ABOVE 3292 WILL OPEN THE FOLLOWING BULLISH TARGET
3324
EMA5 CROSS AND LOCK ABOVE 3324 WILL OPEN THE FOLLOWING BULLISH TARGET
3352
BEARISH TARGETS
3230 - DONE
EMA5 CROSS AND LOCK BELOW 3230 WILL OPEN THE FOLLOWING BEARISH TARGET
3201 - DONE
EMA5 CROSS AND LOCK BELOW 3021 WILL OPEN THE RETRACEMENT RANGE
3179
3152
EMA5 CROSS AND LOCK BELOW 3167 WILL OPEN THE SWING RNGE
3120
3094
EMA5 CROSS AND LOCK BELOW 2975 WILL OPEN THE SECONDARY SWING RANGE
SECONDARY SWING RANGE
3069 - 3038
As always, we will keep you all updated with regular updates throughout the week and how we manage the active ideas and setups. Thank you all for your likes, comments and follows, we really appreciate it!
Mr Gold
GoldViewFX
Opportunity in PEPEUSDT PEPEUSDT has just broken its previous high and is attempting to retrace to the 0.00000665 - 0.00000656 range. This could present an opportunity to join the uptrend.
Price reversal confirmation >0.00000679.
Upside target 0.00000728 - 0.00000737.
Invalid level below 0.00000663
Is it going to happen again? My view to the markets right now...CBOT_MINI:YM1!
Is the Dow Jones breaking the downtrend again?
I believe there's a strong chance the markets are setting up for another move higher. From a fundamental standpoint, the recent pause in tariffs is a big deal. It removes an immediate layer of uncertainty that’s been hanging over the global economy, especially for exporters and multinational companies. On top of that, the fact that key tech products have been left out of the latest tariff actions is boosting confidence in the sector that has been leading market strength for years.
Economically, we’re still seeing resilience in key indicators. Unemployment remains low, consumer spending is steady, and central banks are staying cautious with tightening. The environment still leans more towards slow growth than recession, which supports equities over the medium term.
More importantly, my own criteria for a favorable market setup are lining up. Whether it’s sentiment, intermarket signals, or trend conditions—this looks like a solid spot for a bullish stance.
You can see my chart to check out my current viewpoint on the Dow Jones and how I’m positioning based on all this.
Not Financial Advice
