Trading opportunity for SUIUSDTBased on technical factors there is a Sell position in :
📊 SUIUSDT
🔴 Sell Now
🪫Stop loss 2.8700
🔋Target 1.1100
📏 R/R 2
💸RISK : 1%
We hope it is profitable for you ❤️
Please support our activity with your likes👍 and comments📝
Tradingideas

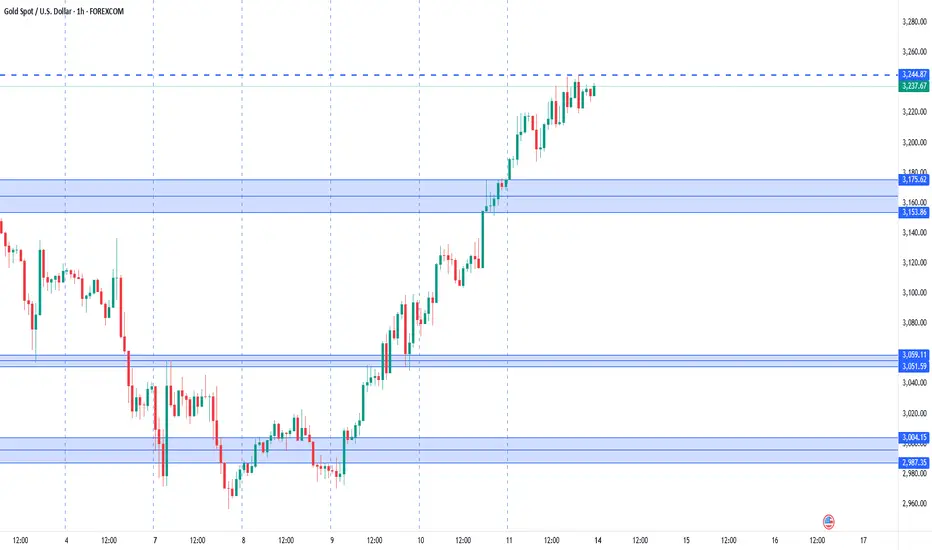
GOLD 4H CHART ROUTE MAP UPDATE & TRADING PLAN FOR THE WEEKHey Everyone,
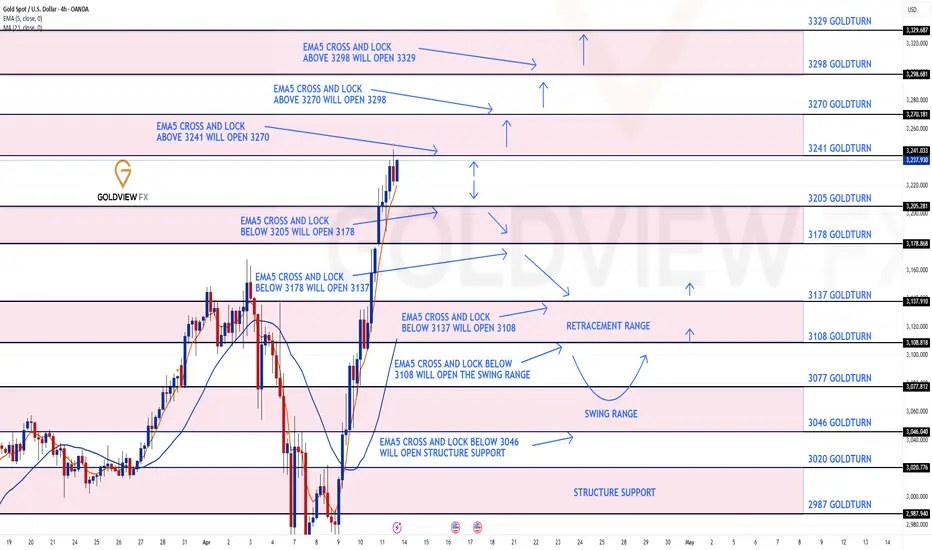
Please see our updated 4h chart levels and targets for the coming week.
We are seeing price play between two weighted levels with a gap above at 3045 and 3078 due to ema5 lagging behind and a gap below at 3016. We will need to see ema5 cross and lock on either weighted level to determine the next range. We have a bigger range in play then usual.
We will see levels tested side by side until one of the weighted levels break and lock to confirm direction for the next range.
We will keep the above in mind when taking buys from dips. Our updated levels and weighted levels will allow us to track the movement down and then catch bounces up.
We will continue to buy dips using our support levels taking 30 to 40 pips. As stated before each of our level structures give 20 to 40 pip bounces, which is enough for a nice entry and exit. If you back test the levels we shared every week for the past 24 months, you can see how effectively they were used to trade with or against short/mid term swings and trends.
BULLISH TARGET
3241
EMA5 CROSS AND LOCK ABOVE 3270 WILL OPEN THE FOLLOWING BULLISH TARGET
3298
EMA5 CROSS AND LOCK ABOVE 3298 WILL OPEN THE FOLLOWING BULLISH TARGET
3329
BEARISH TARGETS
3205
EMA5 CROSS AND LOCK BELOW 3205 WILL OPEN THE FOLLOWING BEARISH TARGET
3178
EMA5 CROSS AND LOCK BELOW 3178 WILL OPEN THE FOLLOWING BEARISH TARGET
3137
EMA5 CROSS AND LOCK BELOW 3137 WILL OPEN THE FOLLOWING BEARISH TARGET
3108
EMA5 CROSS AND LOCK BELOW 3108 WILL OPEN THE SWING RANGE
SWING RANGE
3077 - 3046
As always, we will keep you all updated with regular updates throughout the week and how we manage the active ideas and setups. Thank you all for your likes, comments and follows, we really appreciate it!
Mr Gold
GoldViewFX
GOLD DAILY CHART MID/LONG TERM UPDATEHey Everyone,
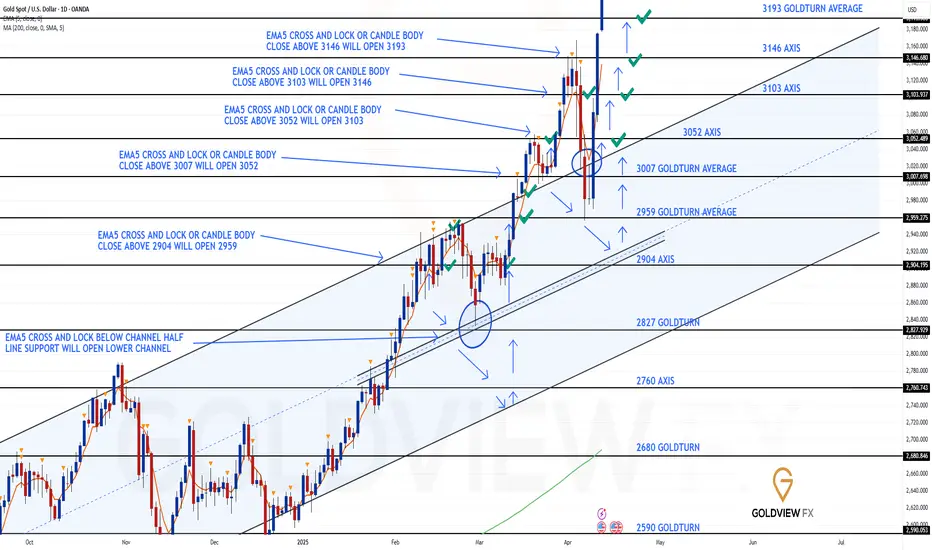
After completing this chart idea last week, we stated that we wanted to continue to share an update on this, as its still playing out by falling back into the range.
We also stated that whenever we see a breakout outside of our unique Goldturn channels; I always state that, when price does a correction, we look for support outside of the channel top.
- This played out perfectly, and although we saw price break back into the channel, you can see ema5 failed to break into the channel and created a Goldturn just above the channel top, highlighted by the circle, confirming the rejection and bounce into the bullish targets completing the levels above.
This is the beauty of our Goldturn channels, which we draw in our unique way, using averages rather than price. This enables us to identify fake-outs and breakouts clearly, as minimal noise in the way our channels are drawn. This enabled us to identify the fakeout into the channel using ema5 and gave the confirmation for the bounce.
This chart idea is now complete!. We will now update a new daily mid/long term chart idea next week.
Thank you all for your likes, comments and follows, we really appreciate it!
Mr Gold
GoldViewFX
GOLD WEEKLY CHART MID/LONG TERM ROUTE MAPHey Everyone,
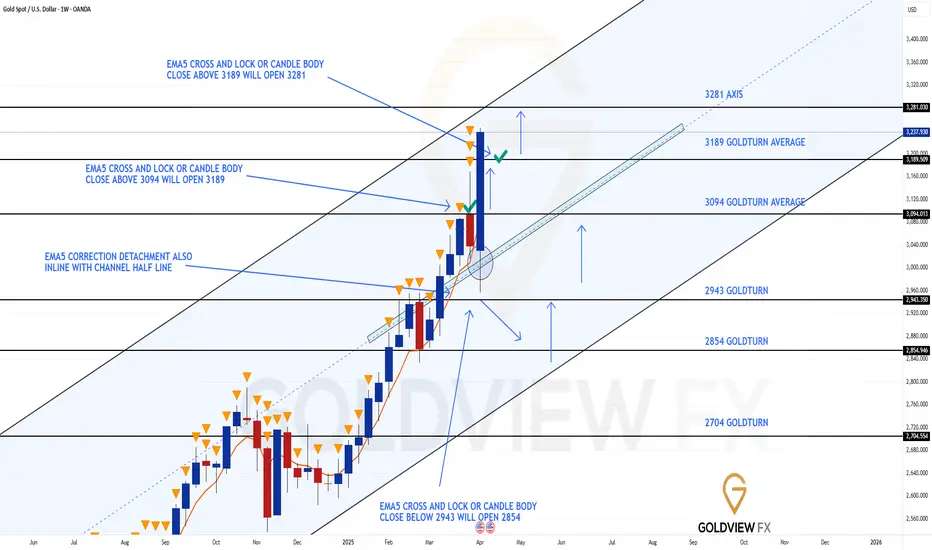
Please see update on our week chart idea, which has been playing out perfectly allowing us to track the movement down and trade the movement up.
Prior to last week, we stated that we had no close above 3094 on the weekly candle, which confirmed the rejection. This weeks candle gave the move into the channel half line, just like we stated and provided the support and bounce into 3094 and 3189. We now have a body clos above 3189 leaving a long range/term gap to 3281
This is the beauty of our channels, which we draw in our unique way, using averages rather than price. This enables us to identify fake-outs and breakouts clearly, as minimal noise in the way our channels are drawn.
Thank you all for your likes, comments and follows, we really appreciate it!
Mr Gold
GoldViewFX
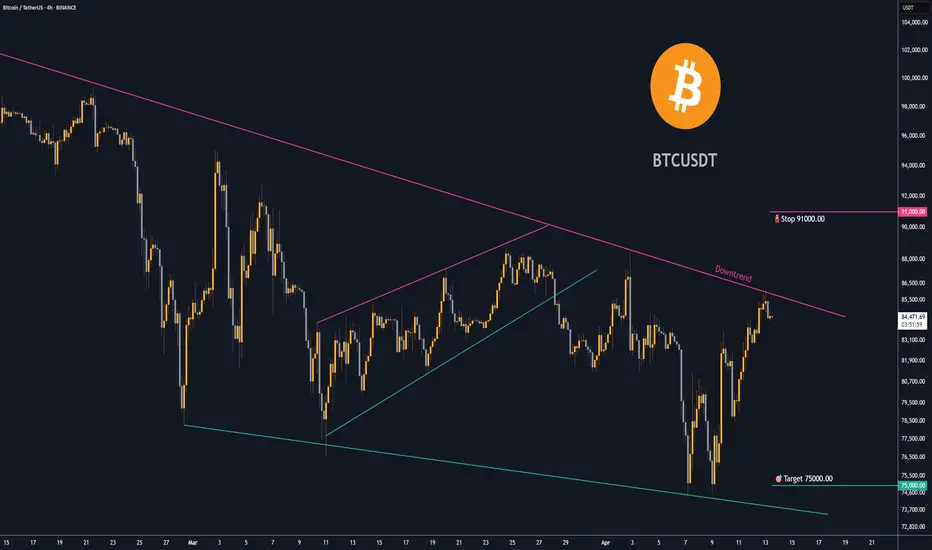
Trading opportunity for BTCUSDTBased on technical factors there is a Sell position in :
📊 BTCUSDT
🔴 Sell Now
🪫Stop loss 91000.00
🔋Target 75000.00
📏 R/R 1,5
💸RISK : 1%
We hope it is profitable for you ❤️
Please support our activity with your likes👍 and comments📝
XAUUSD. Weekly trading levels 14 - 18.04.2025During the week you can trade from these price levels. Finding the entry point into a transaction and its support is up to you, depending on your trading style and the development of the situation. Zones show preferred price ranges WHERE to look for an entry point into a trade.
If you expect any medium-term price movements, then most likely they will start from one of the zones.
Levels are valid for a week, the date is in the title. Next week I will adjust the levels based on new data and publish a new post.
! Please note that brokers have a difference in quotes, take this into account when trading.
The history of level development can be seen in my previous posts. They cannot be edited or deleted. Everything is fair. :)
----------------------------------------------
I don’t play guess the direction (that’s why there are no directional arrows), but zones (levels) are used for trading. We wait for the zone to approach, watch the reaction, and enter the trade.
Levels are drawn based on volumes and data from the CME. They are used as areas of interest for trading. Traded as classic support/resistance levels. We see the reaction to the rebound, we trade the rebound. We see a breakout and continue to trade on a rollback to the level. The worst option is if we revolve around the zone in a flat.
Do not reverse the market at every level; if there is a trend movement, consider it as an opportunity to continue the movement. Until the price has drawn a reversal pattern.
More information in my RU profile.
Don't forget to like Rocket and Subscribe!!! Feedback is very important to me!
GBPUSD. Weekly trading levels 14 - 18.04.2025During the week you can trade from these price levels. Finding the entry point into a transaction and its support is up to you, depending on your trading style and the development of the situation. Zones show preferred price ranges WHERE to look for an entry point into a trade.
If you expect any medium-term price movements, then most likely they will start from one of the zones.
Levels are valid for a week, the date is in the title. Next week I will adjust the levels based on new data and publish a new post.
! Please note that brokers have a difference in quotes, take this into account when trading.
The history of level development can be seen in my previous posts. They cannot be edited or deleted. Everything is fair. :)
----------------------------------------------
I don’t play guess the direction (that’s why there are no directional arrows), but zones (levels) are used for trading. We wait for the zone to approach, watch the reaction, and enter the trade.
Levels are drawn based on volumes and data from the CME. They are used as areas of interest for trading. Traded as classic support/resistance levels. We see the reaction to the rebound, we trade the rebound. We see a breakout and continue to trade on a rollback to the level. The worst option is if we revolve around the zone in a flat.
Do not reverse the market at every level; if there is a trend movement, consider it as an opportunity to continue the movement. Until the price has drawn a reversal pattern.
More information in my RU profile.
Don't forget to like Rocket and Subscribe!!! Feedback is very important to me!

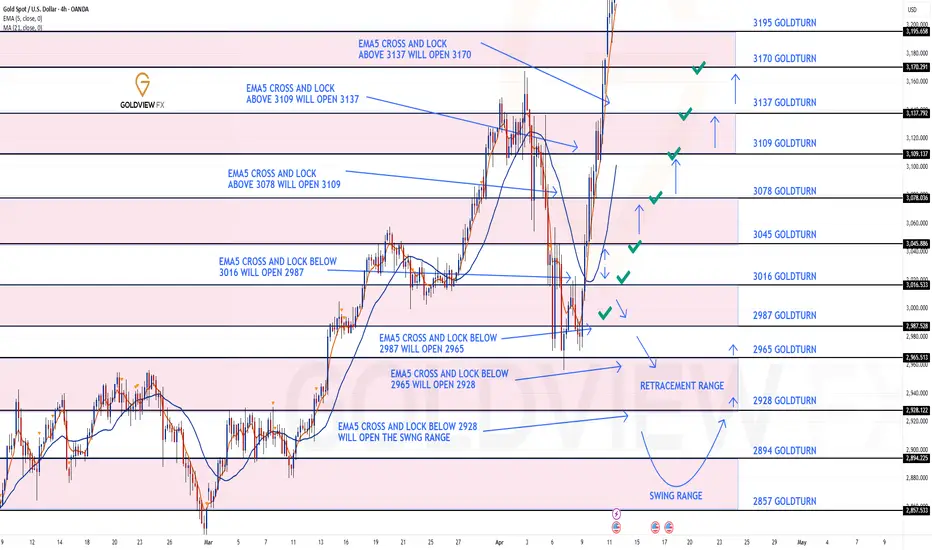
GOLD 4H CHART ROUTE MAP UPDATEHey Everyone,
After completing our 1h Chart route map, please see update on our 4h chart idea, also completed perfectly!
We started the week with the drop into the weighted retracement level. No ema5 lock below confirmed the rejection, inline with our plans to buy dips and then we saw price climb up nicely clearing all our bullish targets.
BULLISH TARGET
3045 - DONE
3078 - DONE
EMA5 CROSS AND LOCK ABOVE 3078 WILL OPEN THE FOLLOWING BULLISH TARGET
3109 - DONE
EMA5 CROSS AND LOCK ABOVE 3109 WILL OPEN THE FOLLOWING BULLISH TARGET
3137 DONE
EMA5 CROSS AND LOCK ABOVE 3137 WILL OPEN THE FOLLOWING BULLISH TARGET
3170 DONE
BEARISH TARGETS
3016 - DONE
EMA5 CROSS AND LOCK BELOW 3016 WILL OPEN THE FOLLOWING BEARISH TARGET
2987 - DONE
We will now come back Sunday with our updated Multi time-frame analysis, Gold route map and trading plans for the week ahead.
Have a smashing weekend!! And once again, thank you all for your likes, comments and follows, we really appreciate it!
Mr Gold
GoldViewFX
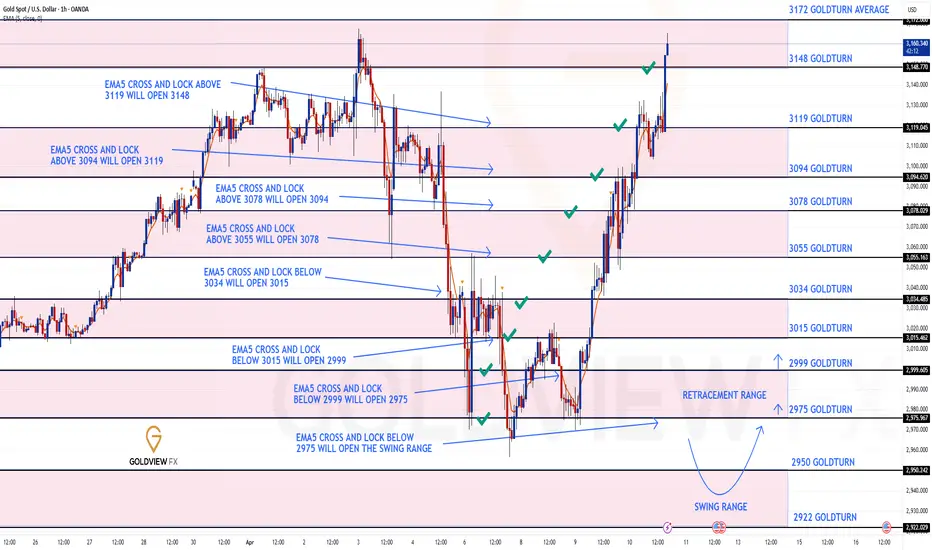
GOLD ROUTE MAP UPDATEHey Everyone,
Another awesome day on the markets with our Bullish targets getting smashed.
After completing all targets upto 3078 yesterday, we continued to get candle body close breakouts above 3078 opening 3094 and above 3094 opening 3119 and then ema5 lock above 3119 confirmed 3148 for the perfect finish to this chart idea.
We can now move over to our 4H chart idea and our remaining multi timeframe route maps to continue to track the movement for the rest of the week.
We will continue to buy dips using our support levels taking 30 to 40 pips. As stated before each of our level structures give 20 to 40 pip bounces, which is enough for a nice entry and exit. If you back test the levels we shared every week for the past 24 months, you can see how effectively they were used to trade with or against short/mid term swings and trends.
BULLISH TARGET
3055 - DONE
EMA5 CROSS AND LOCK ABOVE 3055 WILL OPEN THE FOLLOWING BULLISH TARGET
3078 - DONE
EMA5 CROSS AND LOCK ABOVE 3078 WILL OPEN THE FOLLOWING BULLISH TARGET
3094 - DONE
EMA5 CROSS AND LOCK ABOVE 3094 WILL OPEN THE FOLLOWING BULLISH TARGET
3119 - DONE
EMA5 CROSS AND LOCK ABOVE 3119 WILL OPEN THE FOLLOWING BULLISH TARGET
3148 - DONE
BEARISH TARGETS
3034 - DONE
EMA5 CROSS AND LOCK BELOW 3034 WILL OPEN THE FOLLOWING BEARISH TARGET
3015 - DONE
EMA5 CROSS AND LOCK BELOW 3015 WILL OPEN THE FOLLOWING BEARISH TARGET
2999 - DONE
EMA5 CROSS AND LOCK BELOW 2999 WILL OPEN THE FOLLOWING BEARISH TARGET
2975 - DONE
EMA5 CROSS AND LOCK BELOW 2975 WILL OPEN THE SWING RANGE
SWING RANGE
2950 - 2922
As always, we will keep you all updated with regular updates throughout the week and how we manage the active ideas and setups. Thank you all for your likes, comments and follows, we really appreciate it!
Mr Gold
GoldViewFX
Gold Ideas ahead of CPI on April 10thCurrently, Gold is at 3082, with a mix of uncertainty ahead of tomorrow's CPI release. The market is in a wait-and-see mode as traders position ahead of the data, which could drive volatility. With the macro context in mind, we’ll be focusing on key support and resistance levels, aiming to capture price action based on SMC &more.
🔻 Sell Zone #1 – Intraday Fade
📍 Sell (confirmation only): 3,095 – 3,108
📉 SL: 3,110
🎯 TP1: 3,080
🎯 TP2: 3,060
🎯 TP3: 3,040
⚠️ Tip: Move SL to breakeven when TP1 hits fast
🔺 Sell Zone #2 – Double Tap and Dump
📍 Entry: 3,125 – 3,139 (Ideal: 3,135 – 3,139)
📉 SL: 3,145
🎯 TP1: 3,105
🎯 TP2: 3,080
🎯 TP3: 3,055
⚠️ Tip: Use only with clear rejection (M5/M15 M-pattern or bearish engulfing)
🟢 Buy Scenario 1 – “Reclaim Retest”
📍 Entry: 3,066 – 3,068.50
📉 SL: 3,062
🎯 TP1: 3,089
🎯 TP2: 3,113
🎯 TP3: 3,127
🧠 Trigger: M1/M5 CHoCH or Bullish Engulfing
📌 Confluence: M5 Order Block + Fair Value Gap (Discount Zone)
🟩 Buy Zone – Deep Value Pullback (Fresh Setup)
📍 Entry: 3,035 – 3,040
📉 SL: 3,025
🎯 TP1: 3,080
🎯 TP2: 3,095
🎯 TP3: 3,110
⚠️ Tip: Wait for strong bullish reaction (M5/M15)
📌 Important Notice!!!
The above analysis is for educational purposes only and does not constitute financial advice. Always compare with your plan and wait for confirmation before taking action.
📣 If this strategy sparked clarity, hit that like button and follow. 💛
Price Played Out Exactly As Predicted — Jan 14 Setup RevisitedOn January 14, I shared this precise setup here on TradingView. At the time, it didn’t get much attention—but I trusted the analysis.
Today, price played out exactly as projected. Every level respected. Every zone reacted to. This isn’t hindsight—this is foresight, documented and time-stamped.
Key Notes:
• Clean market structure
• Precise liquidity sweep and shift
• Institutional confluence at premium/discount zones
• Patience + precision = result
I’m sharing this not to say “I was right”—but to highlight what’s possible with disciplined analysis. If you’re serious about trading or just want to see how I break down charts in real-time, feel free to drop a follow.
Let the chart speak
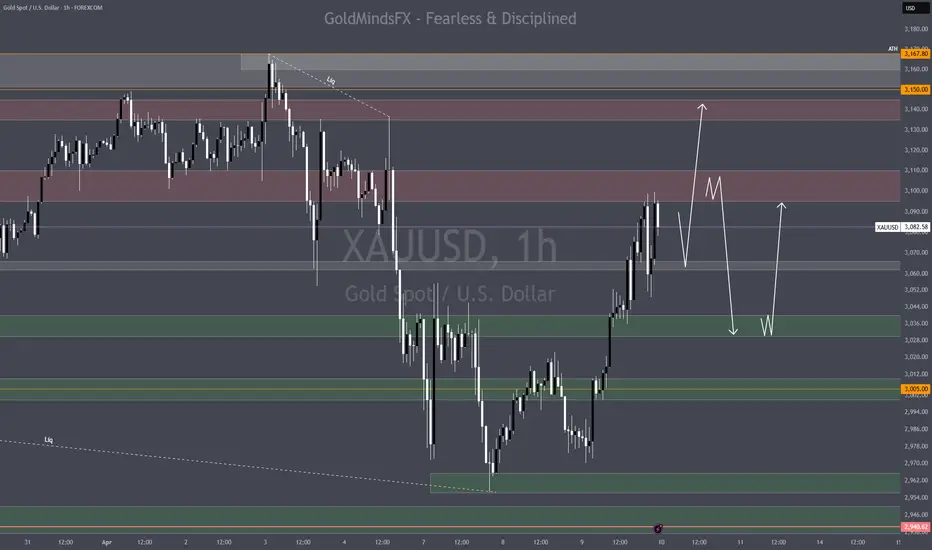
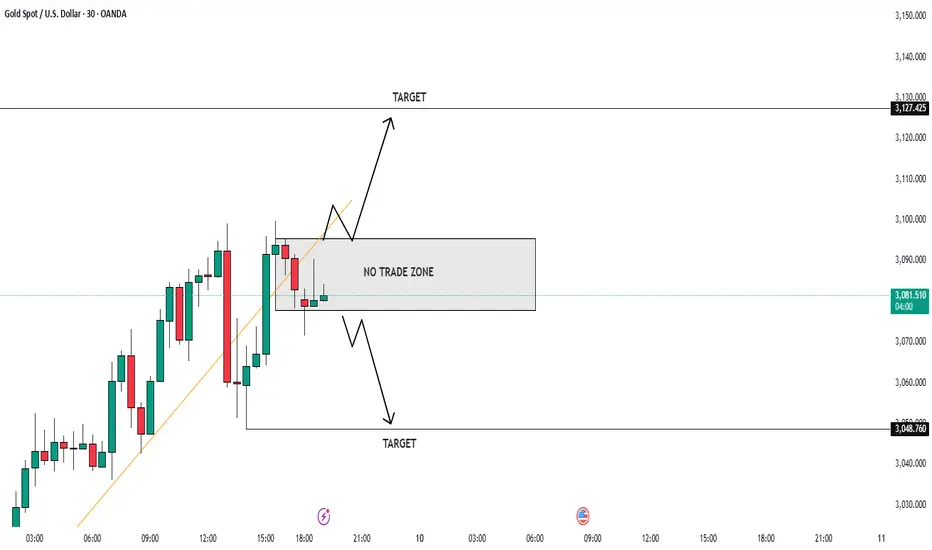
XAUUSD Outlook: Bull or Bear Move Ahead? Manage Risk📊 XAUUSD Market Insight 🌍
Gold is heating up once again, currently testing a tight range between 3080 and 3095. A breakout in either direction could set the tone for the next big move.
🔻 If price breaks below, we may see a slide toward 3060 and 3050—potential areas to watch for bearish momentum.
🔺 However, a strong push above 3095 could spark bullish energy, aiming for short-term targets at 3115 and 3127.
💡 Trade Smart
The market is full of opportunity, but don’t forget: risk management is key. Use proper position sizing, set clear stop-losses, and never overexpose your capital. Stay sharp, trade safe, and let the market come to you. 🧠💼
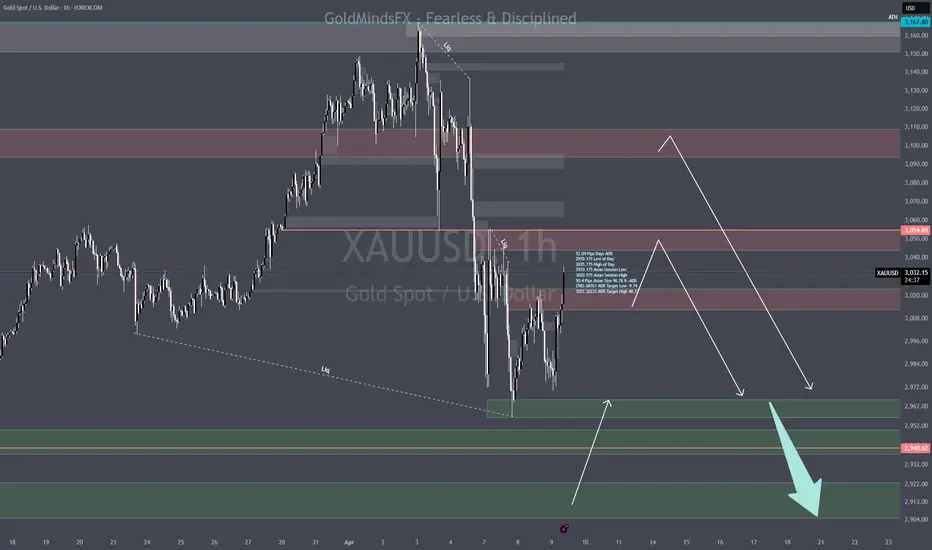
Gold trading ideas April 9th ahead of FOMC MinutesAll entries demand confirmation on M5 or M15;
Snipers don't chase—they wait for the market to come to their scope;
You’re not “late,” you’re loading up for a legendary entry.
🔻 SELL ZONE
📍 3045–3055
🛑 SL: 3065
Why: M15–H1 OB + imbalance fill from previous BOS
Liquidity grab probability during London
🎯 TP1: 3015 | TP2: 2971 | TP3: 2943
🔻 SELL ZONE
📍 3094–3109
🛑 SL: 3122
Why: D1/H4 OB + unmitigated FVG + resting equal highs
Textbook supply raid + swing short
🎯 TP1: 3055 | TP2: 3015 | TP3: 2965
🟢 BUY ZONE
📍 2965–2950
🛑 SL: 2948
Why: H1 demand + FVG + trendline bounce
RSI recovery + bullish CHoCH M15
🎯 TP1: 2990 | TP2: 3022 | TP3: 3044
🟢 BUY ZONE
📍 2922–2904
🛑 SL: 2890
Why: Unmitigated Daily OB + final imbalance
Psychological trap zone if swept
🎯 TP1: 2943 | TP2: 2982 | TP3: 3022
🟢 BUY ZONE
📍 2885–2894
🛑 SL: 2870
Why: Breaker + extreme OB + fib 0.786
Liquidity grab scenario with high RR
🎯 TP1: 2950 | TP2: 3000 | TP3: 3050
📌 Bonus Notes
🔐 Watch 3060–3080 – strong base area.
📌 Important Notice!!!
The above analysis is for educational purposes only and does not constitute financial advice. Always compare with your plan and wait for confirmation before taking action.
📣 If this strategy sparked clarity, hit that like button and follow. 💛
GOLD ROUTE MAP UPDATEHey Everyone,
Piptastic day on the markets today with our chart idea playing out, as analysed.
After failing to open the swing range yesterday, we stated that the retracement range will continue to provide support back into the Bullish Goldturn targets. The retracement range gave the bounce into 3015, 3034, 3055 just like we said.
The momentum was too strong to get the ema5 lock above 3055 to confirm 3078. However, the candle body close above 3055 gave the confirmation for the 3078 target, which was also hit completing this range
We will now look for a break above 3078 for a continuation above or a rejection here will see the lower Goldturns tested again for the bounces. The market is moving in bigger ranges so candle body close can also give earlier confirmations for the next Goldturn without ema5 lock.
We will keep the above in mind when taking buys from dips. Our updated levels and weighted levels will allow us to track the movement down and then catch bounces up.
We will continue to buy dips using our support levels taking 30 to 40 pips. As stated before each of our level structures give 20 to 40 pip bounces, which is enough for a nice entry and exit. If you back test the levels we shared every week for the past 24 months, you can see how effectively they were used to trade with or against short/mid term swings and trends.
BULLISH TARGET
3055 - DONE
EMA5 CROSS AND LOCK ABOVE 3055 WILL OPEN THE FOLLOWING BULLISH TARGET
3078 - DONE
EMA5 CROSS AND LOCK ABOVE 3078 WILL OPEN THE FOLLOWING BULLISH TARGET
3094
EMA5 CROSS AND LOCK ABOVE 3094 WILL OPEN THE FOLLOWING BULLISH TARGET
3119
EMA5 CROSS AND LOCK ABOVE 3119 WILL OPEN THE FOLLOWING BULLISH TARGET
3148
BEARISH TARGETS
3034 - DONE
EMA5 CROSS AND LOCK BELOW 3034 WILL OPEN THE FOLLOWING BEARISH TARGET
3015 - DONE
EMA5 CROSS AND LOCK BELOW 3015 WILL OPEN THE FOLLOWING BEARISH TARGET
2999 - DONE
EMA5 CROSS AND LOCK BELOW 2999 WILL OPEN THE FOLLOWING BEARISH TARGET
2975 - DONE
EMA5 CROSS AND LOCK BELOW 2975 WILL OPEN THE SWING RANGE
SWING RANGE
2950 - 2922
As always, we will keep you all updated with regular updates throughout the week and how we manage the active ideas and setups. Thank you all for your likes, comments and follows, we really appreciate it!
Mr Gold
GoldViewFX
GOLD ROUTE MAP UPDATEHey Everyone,
Another great day on the markets with our Goldturn levels playing out and respecting in true level to level fashion.
After completing the Bullish target from the retracement range yesterday; we stated that we were now playing in a bigger range and if 2975 fails to lock and open the swing range, the retracement range should give bounces into our Goldturns above. This played out perfectly, as 2999 and 3015 was tested from the bounce. We will now like to see ema5 lock above 3015 for a stronger confirmation for a continuation into 3034 and potentially into 3055 to test the full range again.
However, if we see the break below 2975 retracement level; it will open the swing range, which always gives us a bigger swing action then our usual weighted level bounces. This is the main difference between the weighted level bounces and our swing range.
We will keep the above in mind when taking buys from dips. Our updated levels and weighted levels will allow us to track the movement down and then catch bounces up.
We will continue to buy dips using our support levels taking 30 to 40 pips. As stated before each of our level structures give 20 to 40 pip bounces, which is enough for a nice entry and exit. If you back test the levels we shared every week for the past 24 months, you can see how effectively they were used to trade with or against short/mid term swings and trends.
BULLISH TARGET
3055 - DONE
EMA5 CROSS AND LOCK ABOVE 3055 WILL OPEN THE FOLLOWING BULLISH TARGET
3078
EMA5 CROSS AND LOCK ABOVE 3078 WILL OPEN THE FOLLOWING BULLISH TARGET
3094
EMA5 CROSS AND LOCK ABOVE 3094 WILL OPEN THE FOLLOWING BULLISH TARGET
3119
EMA5 CROSS AND LOCK ABOVE 3119 WILL OPEN THE FOLLOWING BULLISH TARGET
3148
BEARISH TARGETS
3034 - DONE
EMA5 CROSS AND LOCK BELOW 3034 WILL OPEN THE FOLLOWING BEARISH TARGET
3015 - DONE
EMA5 CROSS AND LOCK BELOW 3015 WILL OPEN THE FOLLOWING BEARISH TARGET
2999 - DONE
EMA5 CROSS AND LOCK BELOW 2999 WILL OPEN THE FOLLOWING BEARISH TARGET
2975 - DONE
EMA5 CROSS AND LOCK BELOW 2975 WILL OPEN THE SWING RANGE
SWING RANGE
2950 - 2922
As always, we will keep you all updated with regular updates throughout the week and how we manage the active ideas and setups. Thank you all for your likes, comments and follows, we really appreciate it!
Mr Gold
GoldViewFX
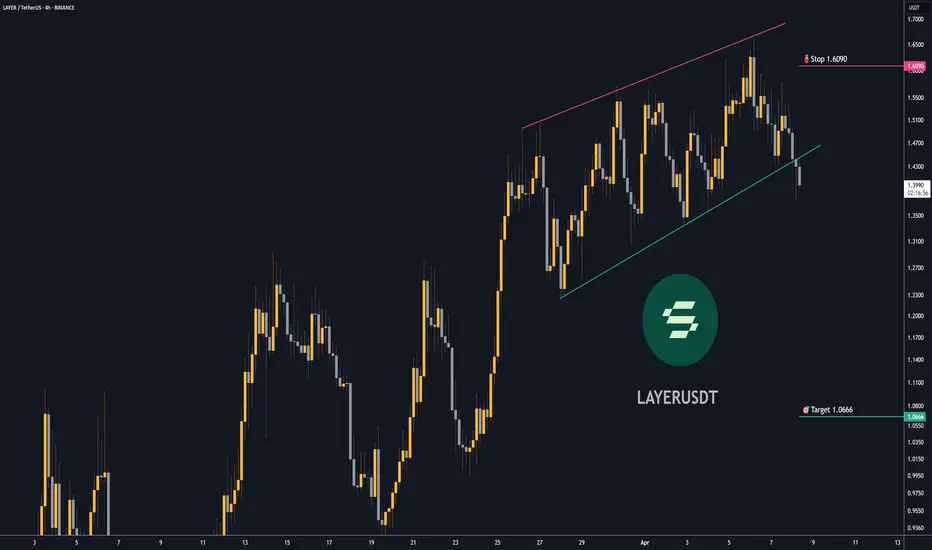
Trading opportunity for LAYERUSDTBased on technical factors there is a Sell position in :
📊 LAYERUSDT
🔴 Sell Now
🪫Stop loss 1.6090
🔋Target 1.0666
📏 R/R 1,5
💸RISK : 1%
We hope it is profitable for you ❤️
Please support our activity with your likes👍 and comments📝
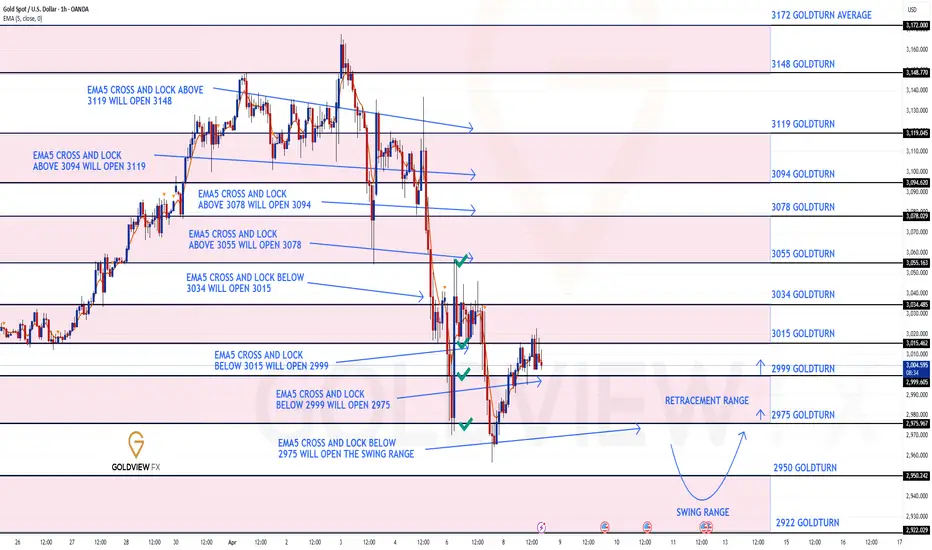
GOLD ROUTE MAP UPDATEHey Everyone,
Great start to the week with our 1h chart route map playing out, as analysed.
We started the session with our Bearish targets 3034 and 3034 and then the retracement range targets at 2999 and 2975, followed with our Bullish target at 3055, perfectly inline with our plans to buy dips.
The range is currently big and we will continue to see play and test between the weighted levels. A re-test and break below the retracement range will open the swing rang. However, continuous support above the retracement range will see a further test at 3055 weighted Goldturn level and lock above 3055 will see the range above open.
We will keep the above in mind when taking buys from dips. Our updated levels and weighted levels will allow us to track the movement down and then catch bounces up.
We will continue to buy dips using our support levels taking 30 to 40 pips. As stated before each of our level structures give 20 to 40 pip bounces, which is enough for a nice entry and exit. If you back test the levels we shared every week for the past 24 months, you can see how effectively they were used to trade with or against short/mid term swings and trends.
BULLISH TARGET
3055 - DONE
EMA5 CROSS AND LOCK ABOVE 3055 WILL OPEN THE FOLLOWING BULLISH TARGET
3078
EMA5 CROSS AND LOCK ABOVE 3078 WILL OPEN THE FOLLOWING BULLISH TARGET
3094
EMA5 CROSS AND LOCK ABOVE 3094 WILL OPEN THE FOLLOWING BULLISH TARGET
3119
EMA5 CROSS AND LOCK ABOVE 3119 WILL OPEN THE FOLLOWING BULLISH TARGET
3148
BEARISH TARGETS
3034 - DONE
EMA5 CROSS AND LOCK BELOW 3034 WILL OPEN THE FOLLOWING BEARISH TARGET
3015 - DONE
EMA5 CROSS AND LOCK BELOW 3015 WILL OPEN THE FOLLOWING BEARISH TARGET
2999 - DONE
EMA5 CROSS AND LOCK BELOW 2999 WILL OPEN THE FOLLOWING BEARISH TARGET
2975 - DONE
EMA5 CROSS AND LOCK BELOW 2975 WILL OPEN THE SWING RANGE
SWING RANGE
2950 - 2922
As always, we will keep you all updated with regular updates throughout the week and how we manage the active ideas and setups. Thank you all for your likes, comments and follows, we really appreciate it!
Mr Gold
GoldViewFX
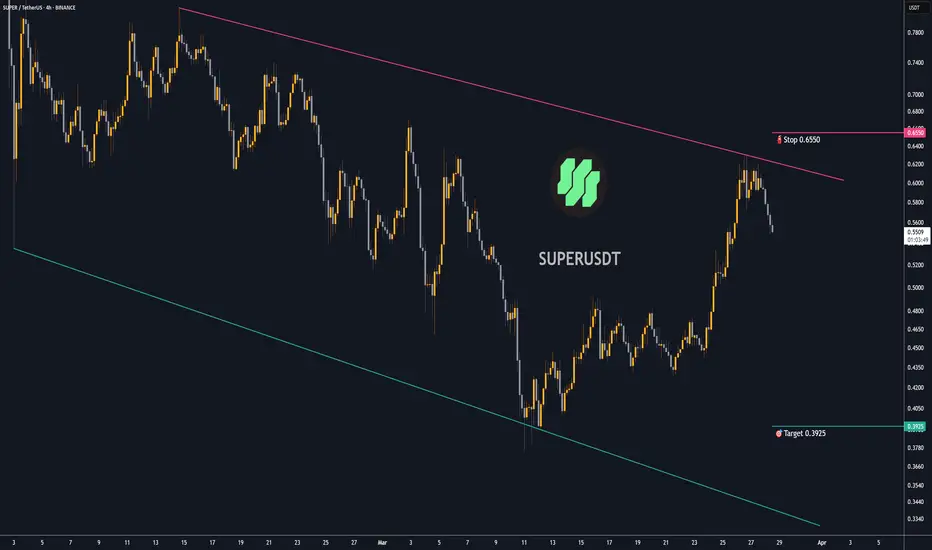
Trading opportunity for SUPERUSDTBased on technical factors there is a Sell position in :
📊 SUPERUSDT
🔴 Sell Now
🪫Stop loss 0.6550
🔋Target 0.3925
📏 R/R 1,8
💸RISK : 1%
We hope it is profitable for you ❤️
Please support our activity with your likes👍 and comments📝
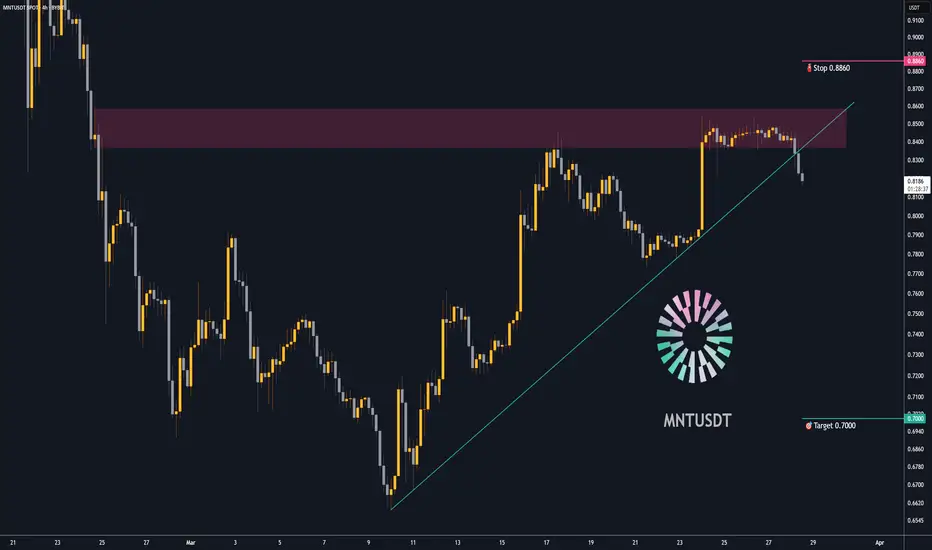
Trading opportunity for MNTUSDTBased on technical factors there is a Sell position in :
📊 MNTUSDT
🔴 Sell Now
🪫Stop loss 0.8860
🔋Target 0.7000
📏 R/R 1,8
💸RISK : 1%
We hope it is profitable for you ❤️
Please support our activity with your likes👍 and comments📝
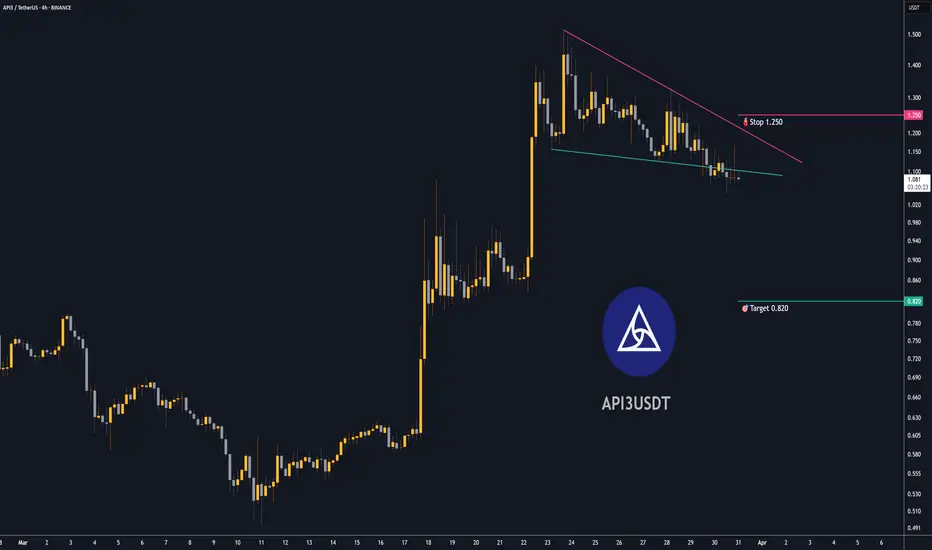
Trading opportunity for API3USDTBased on technical factors there is a Sell position in :
📊 API3USDT
🔴 Sell Now
🪫Stop loss 1.250
🔋Target 0.820
📏 R/R 1,5
💸RISK : 1%
We hope it is profitable for you ❤️
Please support our activity with your likes👍 and comments📝
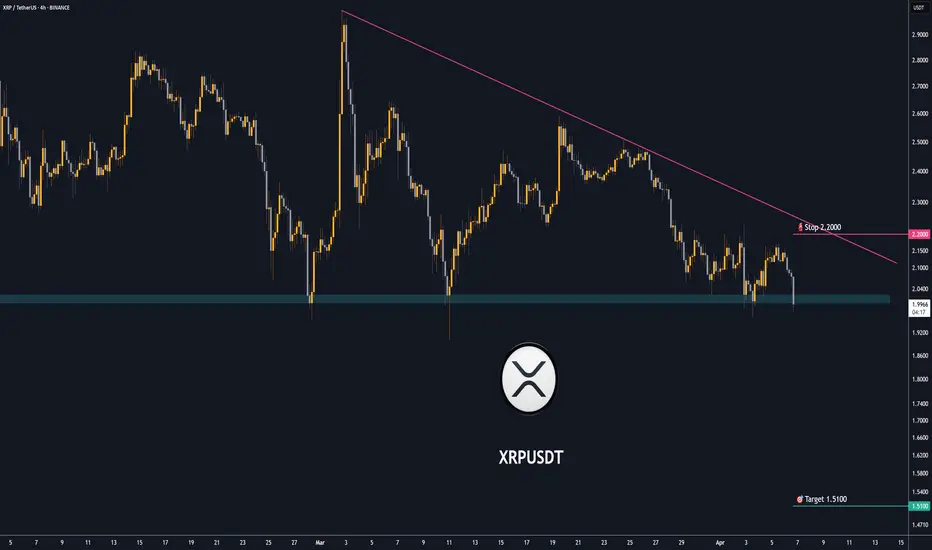
Trading opportunity for XRPUSDTBased on technical factors there is a Sell position in :
📊 XRPUSDT
🔴 Sell Now
🪫Stop loss 2.2000
🔋Target 1.5100
📏 R/R 2,2
💸RISK : 1%
We hope it is profitable for you ❤️
Please support our activity with your likes👍 and comments📝
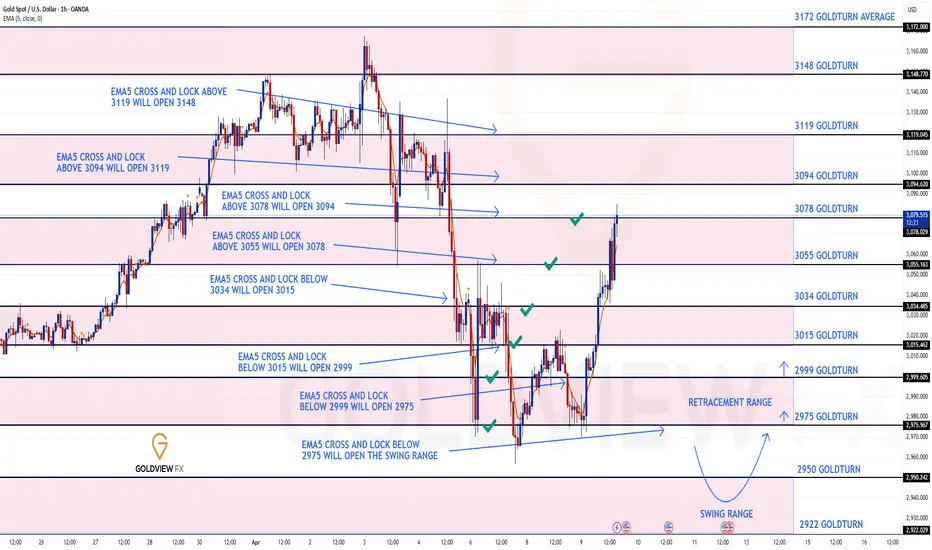
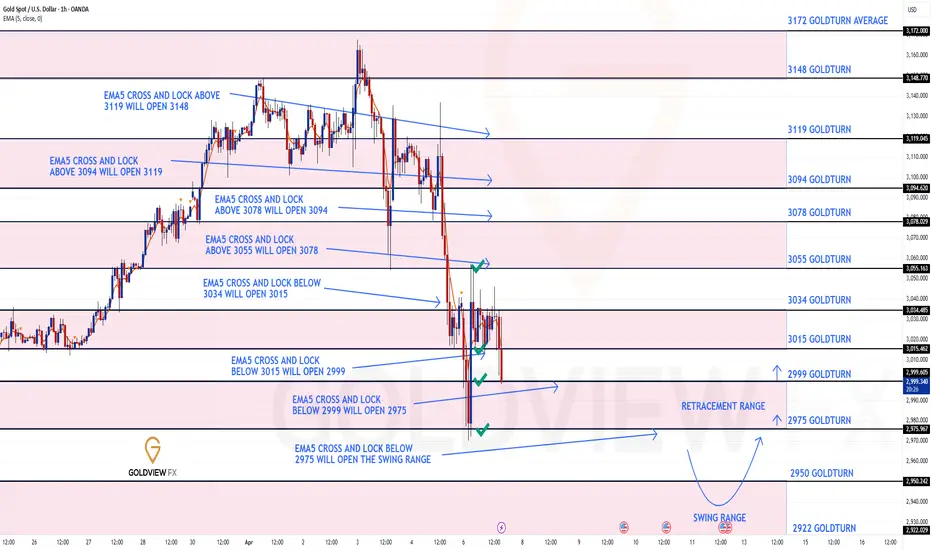
GOLD 1H CHART ROUTE MAP & TRADING PLAN FOR THE WEEKHey Everyone,
Please see our updated 1h chart levels and targets for the coming week.
We are seeing price play between two weighted levels with a gap above at 3055 and a gap below at 3034. We will need to see ema5 cross and lock on either weighted level to determine the next range.
We will see levels tested side by side until one of the weighted levels break and lock to confirm direction for the next range.
We will keep the above in mind when taking buys from dips. Our updated levels and weighted levels will allow us to track the movement down and then catch bounces up.
We will continue to buy dips using our support levels taking 30 to 40 pips. As stated before each of our level structures give 20 to 40 pip bounces, which is enough for a nice entry and exit. If you back test the levels we shared every week for the past 24 months, you can see how effectively they were used to trade with or against short/mid term swings and trends.
BULLISH TARGET
3055
EMA5 CROSS AND LOCK ABOVE 3055 WILL OPEN THE FOLLOWING BULLISH TARGET
3078
EMA5 CROSS AND LOCK ABOVE 3078 WILL OPEN THE FOLLOWING BULLISH TARGET
3094
EMA5 CROSS AND LOCK ABOVE 3094 WILL OPEN THE FOLLOWING BULLISH TARGET
3119
EMA5 CROSS AND LOCK ABOVE 3119 WILL OPEN THE FOLLOWING BULLISH TARGET
3148
BEARISH TARGETS
3034
EMA5 CROSS AND LOCK BELOW 3034 WILL OPEN THE FOLLOWING BEARISH TARGET
3015
EMA5 CROSS AND LOCK BELOW 3015 WILL OPEN THE FOLLOWING BEARISH TARGET
2999
EMA5 CROSS AND LOCK BELOW 2999 WILL OPEN THE FOLLOWING BEARISH TARGET
2975
EMA5 CROSS AND LOCK BELOW 2975 WILL OPEN THE SWING RANGE
SWING RANGE
2950 - 2922
As always, we will keep you all updated with regular updates throughout the week and how we manage the active ideas and setups. Thank you all for your likes, comments and follows, we really appreciate it!
Mr Gold
GoldViewFX

GOLD DAILY CHART MID/LONG TERM UPDATEHey Everyone,
This is an update on our daily chart idea that we have been tracking for a while now and finally completed last week. However, I wanted to continue to share an update on this, as its still playing out by falling back into the range on Fridays drop in price.
Historically, whenever we see a breakout outside of our unique Goldturn channels; I always state that, when price does a correction, we look for support outside of the channel top. This is playing out to perfection with Fridays drop finding support on the channel top, as highlighted by us on the chart with a circle. This was done with precision!!
We will now look for a test above at 3052 and a body close above this will follow with continuation to 3103 or a break below inside the channel top wall with ema5 will re-activate the levels below inside the channel, which we can then continue to track back up level to level, like we did before. I have also updated the levels above the channel to cover the new range.
This is the beauty of our Goldturn channels, which we draw in our unique way, using averages rather than price. This enables us to identify fake-outs and breakouts clearly, as minimal noise in the way our channels are drawn.
We will use our smaller timeframe analysis on the 1H and 4H chart to buy dips from the weighted Goldturns for 30 to 40 pips clean. Ranging markets are perfectly suited for this type of trading, instead of trying to hold longer positions and getting chopped up in the swings up and down in the range.
We will keep the above in mind when taking buys from dips. Our updated levels and weighted levels will allow us to track the movement down and then catch bounces up using our smaller timeframe ideas.
Our long term bias is Bullish and therefore we look forward to drops from rejections, which allows us to continue to use our smaller timeframes to buy dips using our levels and setups.
Buying dips allows us to safely manage any swings rather then chasing the bull from the top.
Thank you all for your likes, comments and follows, we really appreciate it!
Mr Gold
GoldViewFX
