SPY to $460Overview
Utilizing trading patterns and consistencies between several technical indicators, I believe the equity market will begin to unload soon as traders collect their profits from the recent rally and prepare for the next FOMC meeting on 19-20 March.
Trading Patterns
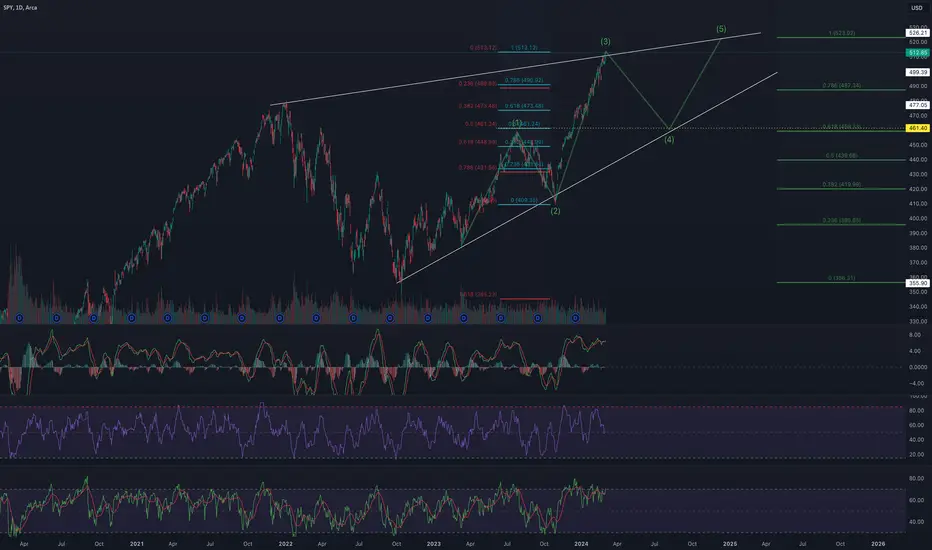
SPY is currently undergoing a rising wedge which is a bearish trading pattern. Within the wedge, I outlined an impulse wave pattern which shows SPY at what may be the peak of the third wave. Rising share price on dwindling volume, in addition to divergences spotted on the RSI, MFI, and MACD, lead me to confidently believe a dip to around $460 is approaching.
Price Target
I used the support and resistance lines of the macro rising wedge to determine the paths of the impulse waves, assuming their troughs and crests will reach the respective lines. Presuming the rules of impulse waves hold true then the fourth wave cannot end pass the crest of wave one, which falls in line with the 50% retracement level of the third wave (blue and red Fibonacci tools). This level rests at a share price near $460.
Utilizing a larger Fibonacci tool to encompass the entire rising wedge and a projected fifth wave crest as 100%, the $460 share price is around the 61.8% Fibonacci level (when used in the uptrend).
Supporting Technical Indicators
The MACD shows a divergence as well as an approaching cross over its signal line from above.
While not as prominent as MACD, the RSI also shows a divergence between the share price and peaks within the RSI oscillator. I've highlighted the divergence by placing a horizontal line at the end of the first peak. It is also reflecting overbought signals.
The MFI shows a sharp negative slope but the SPY share price is still rising. This divergence, aligned with the signals of the other two indicators, suggests the share price may be about to drop.
Tradingpatterns
$0.000015 In Sight?Shiba Inu token has been grabbing momentum as of late. On the 1W and 1D charts, a distinct W is beginning to form with us being a little above the second trough at the time of this idea. I drew a crude Fibonacci retracement -- it is crude because I am not 100% that I am using the retracement tool accurately BUT there are three fibonacci retracement levels that show strong correlation to prior resistances and supports -- 78.6%, 50%, and 23.6%.
If Shiba Inu's price can break through the resistance presented at 23.6% then the next major resistance appears to be at the 50% Fibonacci level, then the 78.6%, and then finally arriving at a bountiful price target around $0.00001587. According to the chart's timeline, this could take up to three months to complete at its current pace which presents two possibilities:
Bitcoin ETF gets rejected and the crypto market experiences a news-propelled crash. Corrections will be inevitable in any market but, in my opinion, the Bitcoin ETF getting rejected could send us back to prior lows or at least close to it.
Bitcoin ETF gets approved and the prior price target of $0.000015 may arrive sooner as well as be too conservative.
Traders should remain cognizant of macroeconomic news and Bitcoin ETF updates as they can render a trading pattern invalid at any moment. However, should everything remain status quo and the market outlook remain positive, it is my personal opinion that this trade can benefit both short and medium term holders.
Traders should practice good habits by increasing Stop-Losses with market gains and watching the volume to avoid entering or exiting a trade too soon.
COINBASE:SHIBUSD

(G(Gold fundamental forecast📊📈⤵oHello traders what do you think about Gold)
ast
Gold fundamental analysis forec 📈📉🧾📊
(technical analysis forecast) OANDA:XAUUSD 📌🔍
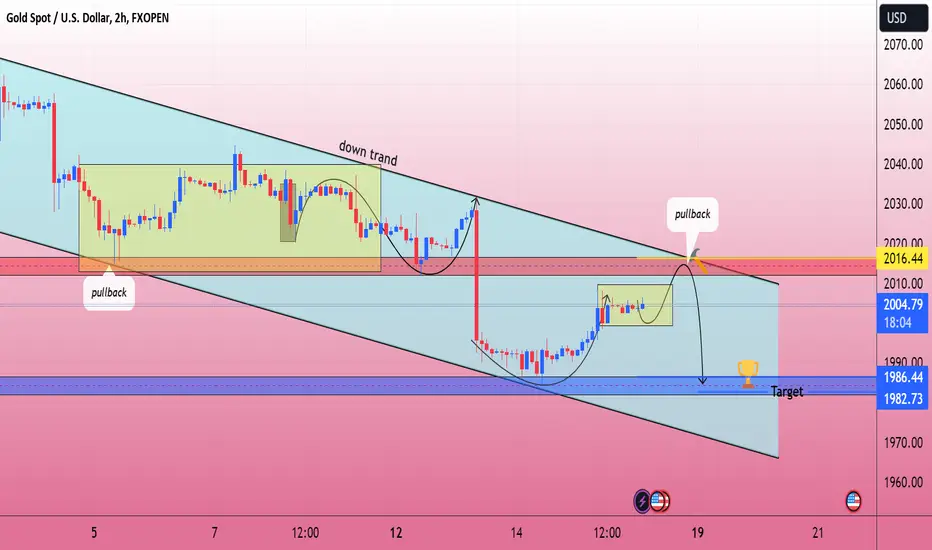
(Gold price my last idea 💡gold pullback short 2037 pullback short 2004 hitting target 🎯 gold same pullback reset taste resistance 2014down trand short 1986)
Gold fundamental forecast 🖊📝
✅Fundamental analysis of gold involves assessing various factors that influence its price. Here are some key aspects to consider:🪶
Supply and Demand: Gold's price is influenced by supply and demand dynamics. Factors such as mine production, central bank holdings, jewelry demand, industrial demand, and investment demand (including ETFs and central bank purchases) play a role in determining the balance between supply and demand.
Inflation and Economic✅ Stability: Gold is often seen as a hedge against inflation and economic instability. During times of economic uncertainty or when inflation expectations rise, investors may flock to gold as a safe-haven asset, which can drive up its price.
Interest Rates and Monetary Policy: Gold typically performs inversely to interest rates. When interest rates are low, the opportunity cost of holding gold (which doesn't provide a yield) decreases, making gold more attractive. Additionally, central bank policies, such as quantitative easing or tightening, can impact gold prices.
♻Currency Strength: Since gold is priced in US dollars, movements in the value of the dollar can influence the price of gold. A weaker dollar usually leads to higher gold prices, as it becomes cheaper for holders of other currencies.
Geopolitical Events and Market Sentiment: Geopolitical tensions, such as conflicts or trade disputes, can increase demand for gold as a safe-haven asset. Market sentiment and investor speculation also play a role in short-term price movements.
🥇Gold Production Costs: The cost of producing gold can impact its price. If production costs rise significantly, it may limit supply and support higher prices.
Technological and Industrial Demand: While investment demand is significant, gold also has industrial uses in electronics, dentistry, and other sectors. Changes in technology or industrial demand can affect the overall demand for gold.
Analyzing these factors along with broader economic trends and market sentiment can help in understanding the fundamental drivers of gold prices)
Safe trade 🙏 plaes like ❤ and comment's don't forget next analysis follow me
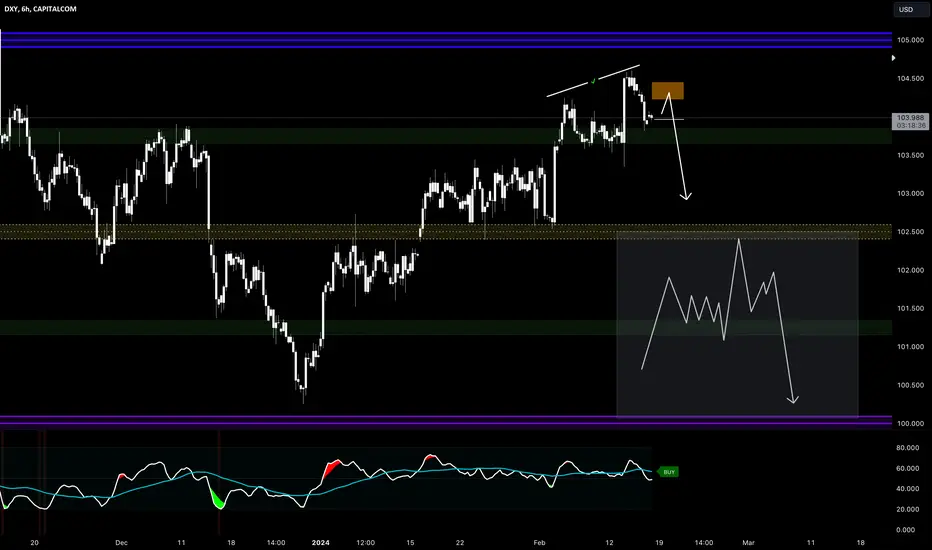
DXY DROP?? = Massive RUN UP on xxxUSD! READ. DXY recently had its massive rally to the UPSIDE which imo is a CORRECTIVE MOVE. We are expecting DXY to make its first LEG down this week or have its FULL DROP next week.
How does this information about US DOLLAR help?
IF USD goes DOWN, xxxUSD rallies UP. It is important you understand the US DOLLAR before engaging in any xxxUISD pair.
How do we FRAME the trade setup?
IF DXY pulls back up to the yellow zone first, we will be looking to BUY LONGS on xxxUSD pairs.
BUT IF,
DXY drops from our current price down to the PMH (If you have my indictors you should already see the PMH level on your chart.) we will be looking to SELL xxxUSD last LEG instead and that would mean, DXY has met up with the required volume needed to make a new HIGH.
That will be our PLAY.
AMZN to $1881HR Chart
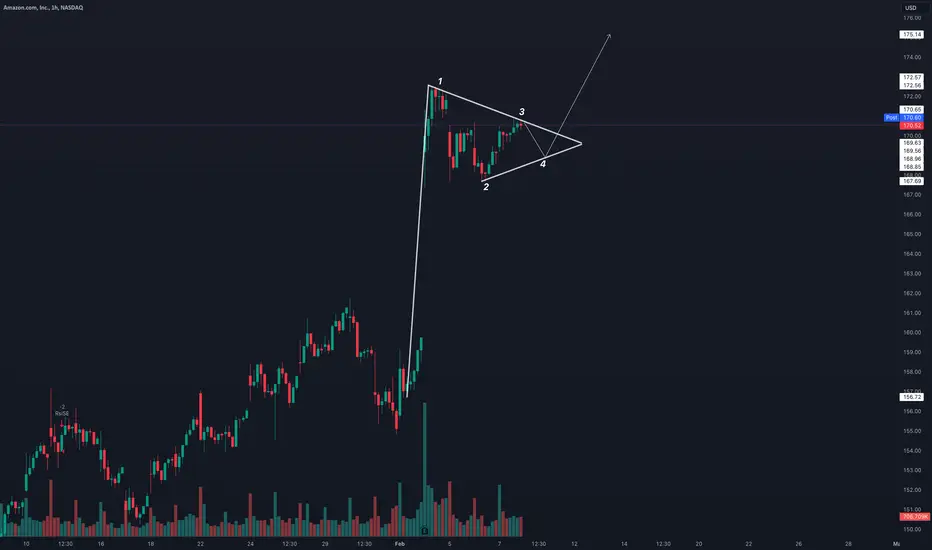
Amazon ( NASDAQ:AMZN ) has developed a bullish flagpole formation that is more easily seen on the hourly charts. This may serve as a continuation pattern that will launch AMZN to a 52 week high of $188 -- a level that hasn't been tested since July of 2021. Fibonacci retracement levels for the current trading pattern support the $188 ceiling as this value rests near the 168.1% level.
On-Balance Volume (OBV) has a positive slope which suggests that bullish investors are outpacing the bears. I also recently began using the Relative Strength Index (RSI) and Moving Average Convergence/Divergence (MACD) indicators. While my experience with RSI and MACD is limited, the RSI appears to be approaching a bearish crossover before the MACD crosses above its signal line. I interpret this as a possible correction to the pennant support line (the 4th leg) with a near immediate recovery.
1D Chart
A share price in the $180s should be carefully watched as this level has been a significant area of resistance in the past. As tempted as I am to suggest it may be forming a double top, the middle trough dipped too low and it appears that AMZN may be trading in a horizontal channel. If AMZN surpasses the $188 price ceiling with significant volume then a 12 month price target of $250 is pragmatic. Should the opposite occur then a 12 month target of $80 could also be expected.
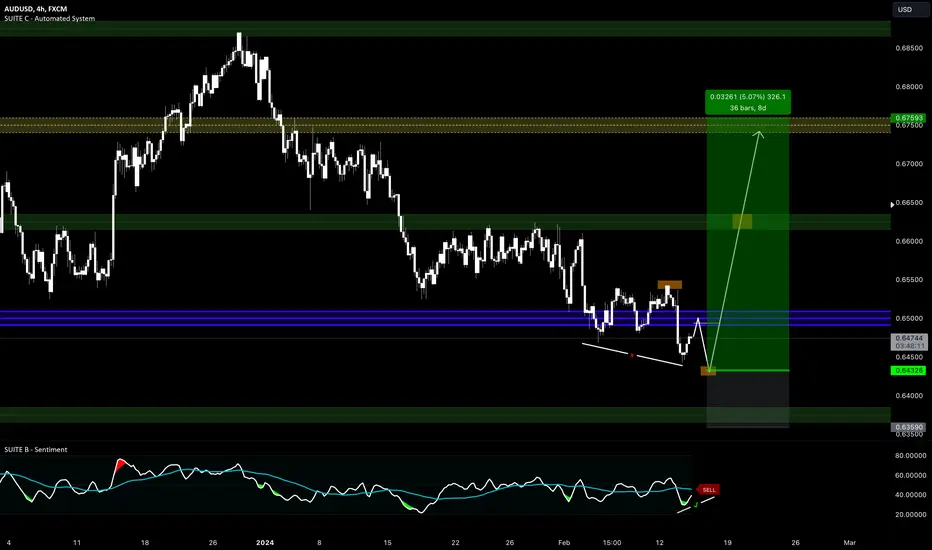
AUDUSD 300pips RIDE get READY! More to come.AUDUSD, hasn't meet the requirement for a PEAK BOTTOM setup, we expect a LL to finish the build up and the volume we require to RUN this up.
This is a HIGH QUALITY SWING, set your alert and get ready.
USDCAD Pair : USDCAD ( U.S Dollar / Canadian Dollar )
Description :
Completed " 1234 " Impulsive Waves and Rejection from Daily Demand Zone or Fibonacci Level - 50.0%. Bullish Channel as an Corrective Pattern in Short Time Frame with the Breakout of the Lower Trend Line. Strong Divergence in RSI and Break of Structure

Double Bottom Breakout and Symmetrical Triangle = PUMPInternet Computer (ICP) has undergone an extended period of trading within a horizontal accumulation pattern, accompanied by the formation of a significant double bottom pattern with a liquidity grab. Following the successful execution of the double bottom pattern, ICP broke out from the accumulation range, and it is currently trading within a symmetrical triangle. The anticipation is for a potential upward breakout from the symmetrical triangle pattern.
🔄 Horizontal Accumulation and Double Bottom Formation:
ICP's extended consolidation within the horizontal accumulation pattern provided the groundwork for the formation of a double bottom pattern. The pattern is characterized by a strategic liquidity grab, indicating a shift in market dynamics and potential accumulation of positions.
🚀 Double Bottom Breakout Impact:
The successful breakout from the double bottom pattern signified a reversal of the prevailing bearish sentiment. This breakout is indicative of increased buying interest, potentially paving the way for a sustained upward move.
🔍 Symmetrical Triangle Formation:
ICP is currently trading within a symmetrical triangle, marked by converging trendlines that create a triangular pattern. The symmetrical triangle often represents a period of consolidation and indecision in the market, with the potential for a significant breakout.
💡 Anticipating Upward Breakout:
The symmetrical triangle pattern suggests that ICP is coiling within a tightening range. An upward breakout from the symmetrical triangle could signal a continuation of the bullish momentum initiated by the double bottom breakout. Traders and investors may anticipate potential higher price levels if the symmetrical triangle is breached to the upside.
🔮 Future Outlook:
The technical analysis indicates a favorable setup for ICP, with the successful execution of the double bottom pattern and the current consolidation within a symmetrical triangle. Traders should closely monitor the price action for confirmation of an upward breakout from the triangle pattern. The cryptocurrency market's dynamic nature emphasizes the importance of adaptability and risk management in trading decisions. If the symmetrical triangle is decisively breached to the upside, it may open the door for further upward movement in ICP.

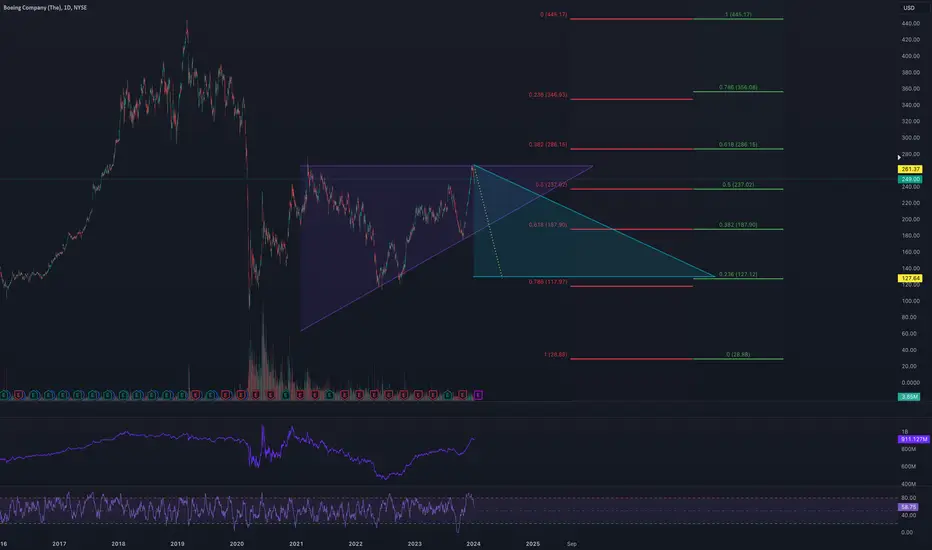
Boeing: Descent to $130Overview
Boeing ( NYSE:BA ) has had a rough several years due to the controversy surrounding its MAX series. Just recently, an incident occurred during a flight on the West Coast where a part of the fuselage blew off during an ascent and required a prompt emergency landing. Fortunately everyone onboard made it safely back to the airport. This follows years after the two fatal Boeing MAX crashes in 2018-2019.
Technical Analysis
This is a new one for me. The BA 1D chart doesn't reveal any obvious patterns and, if anything, was in the process of forming an ascending triangle which is bullish. In light of the breaking news I am fairly confident that the ascending triangle will become invalid then transform into a months long descending triangle.
Utilizing Fibonacci retracement levels, I am expecting decent support around $130. Of course there will always be plenty of opportunity for scalping in-between now and then as the current share price is sitting around $249.
Fundamental Analysis
I will assess the balance sheet and provide a fundamental analysis sometime this weekend. However, I don't believe even a good balance sheet will alleviate the coming selling pressure. The markets are reactive to news and a healthy balance sheet would only mean certain recovery at a later time.
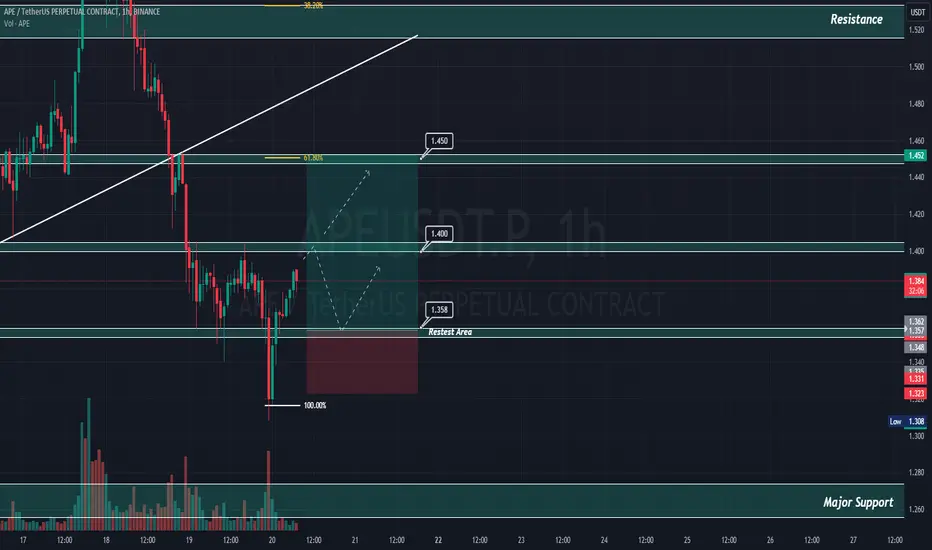
APE TRADING SETUPHi Everyone!
APE Tading setup today
APE Analyze ( APEUSDT.P ), 1 Hour time frame ⏰
APE looking good to buy, if you want to BUY APE, you can BUY in RETEST AREA
but, Don't forget set up your trading plan, risk reward
Good luck Guys!
*Follow For More!
*DYOR
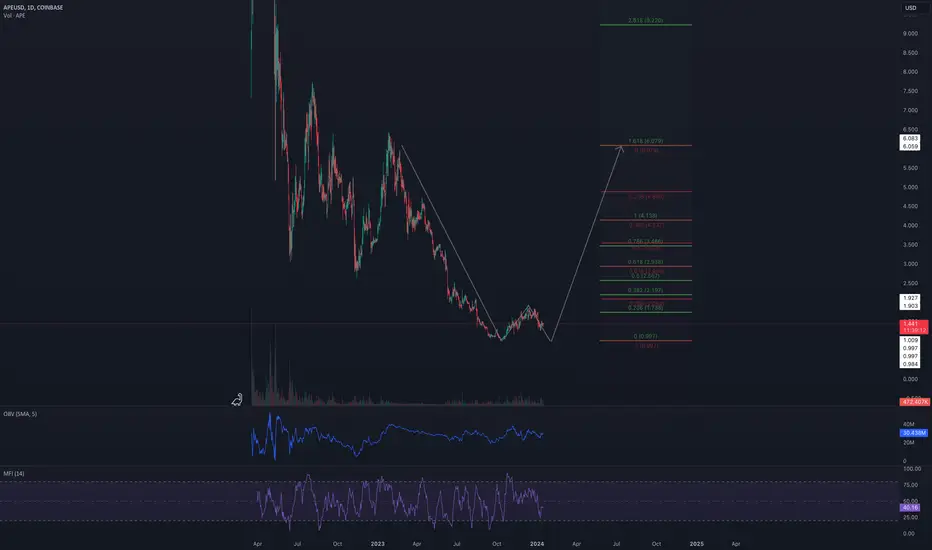
ApeCoin: Double BottomOverview
I recently cancelled one of my other ApeCoin projections where I believed a Three Hills & a Mountain pattern was forming. The second hill became a head and now a bearish Head & Shoulders is in progress. However, I am still bullish on the token because if the H&S is valid and the price is rejected back to $1.00 then this could become a setup for a medium-to-long term double bottom formation.
Head & Shoulders
The H&S can be seen on both the hourly and daily charts. The right shoulder is currently in development with a descending wedge that may squeeze the value back up to a resistance around $1.55. Should the ceiling be strong enough to extinguish any momentum that COINBASE:APEUSD may garner then a correction back to $1.00 is probable.
However, if support is significant enough at this $1.00 level then this will become the second leg for the double bottom pattern.
Double Bottom Projection
There will be plenty of noise in-between that will facilitate short-term trades but I believe a price target near $6 is practical. This is near the same price target of a macro-Cup & Handle projection that I published a few weeks ago.
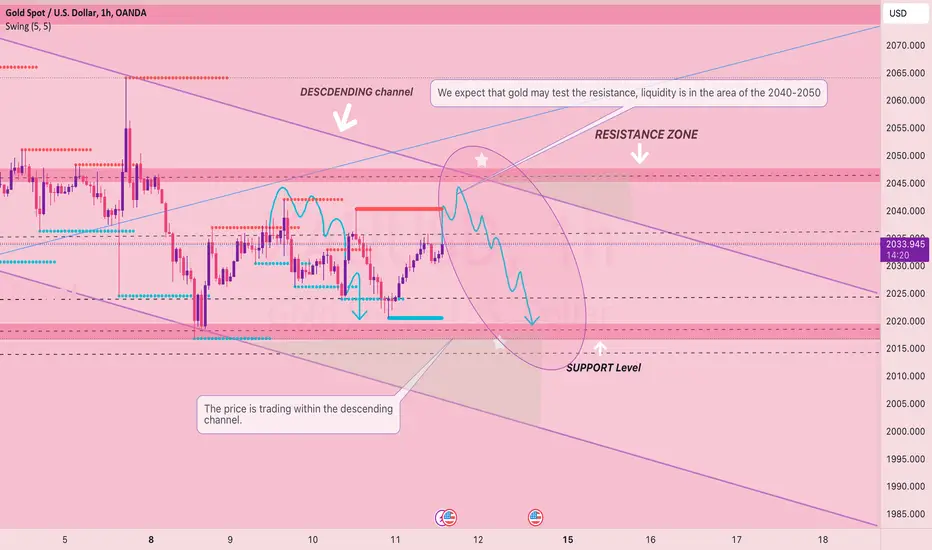
XAUUASD1HThe price is trading within the descending channel. I expect gold may test the resistance, liquidity is in the area 2040-2050. and rollback and go down to retest the support level.
MY goal is the support level at 2020-2015
AUDCAD LONG AND SHORT TERM ANALYSIS 1/7/24(Audcad long- and short-term analysis)
I wanted to show you guys my whole thought process through Audcad so you guys can watch how this plays out.
* as traders we cannot predict the market but we can take what its giving us and run with it.

PayPal to $76PayPal is signaling bullish reversal at a great value. After a two-year long hemorrhage in stock value, multiple indicators and patterns forecast a recovery. A descending wedge can be found on the 1D chart and as we are nearing the final squeeze of the wedge, an inverse head and shoulders has formed.
Utilizing Fibonacci retracement levels supported by bullish trading patterns and indicators (OBV & MFI), the ascent to $76 appears both realistic and only the beginning of a long awaited rally. Should my projections prove accurate, I believe there will be one more opportunity to profit from put options as the right shoulder peaks around the $57-$59 range.
NASDAQ:PYPL

The most important rule in trading, is to respect you plan 🧠Hello Traders!
Risk management primarily involves minimizing potential losses without sacrificing upside potential. This is often borne out in the risk/reward ratio, a type of cost-benefit analysis based on the expected returns of an investment compared to the amount of risk taken on to earn those returns.

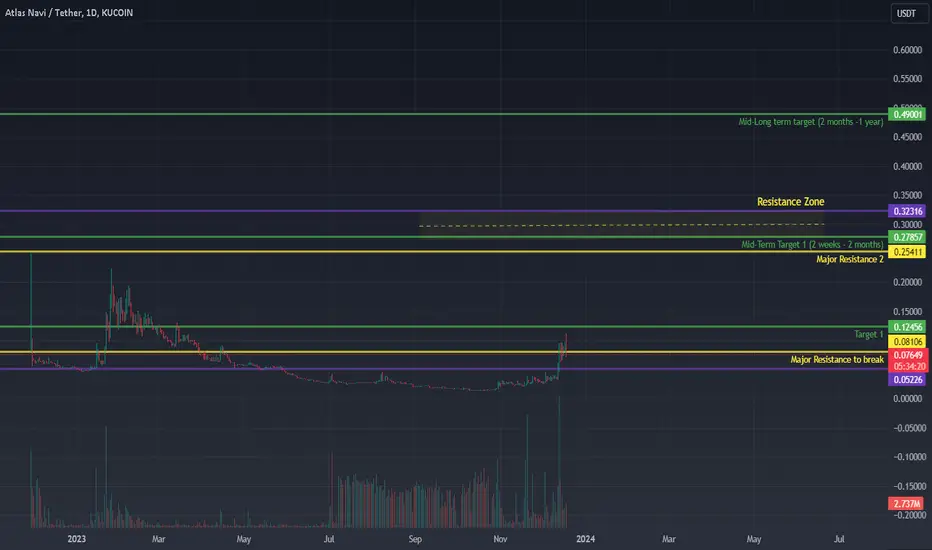
NAVI - Low-Cap High Potential Play - 50x Potential Long termExtremely undervalued token, I would like it to break the first outlined resistance before allocating capital towards this asset.
This is a high risk play, I wouldn't recommend investing more than you are willing to throw in the trash can, That being said the growth potential is huge at a market cap of just below 2 million USD This easily has the potential to 50X in a bull market scenario.
Here are my Initial Targets / Supports / Resistances
Support Level 1: $.05226
Major Resistance to break: $.07649
Target 1: $.12456
Major Resistance 2: $.25411
Mid Term Target 1 (2 weeks - 2 months) : $.27857
Major Resistance Zone (Chop potential): $.27857 - $.32316
Mid - Longterm Target (2 months - 1 Year) : $.49001
What is Atlas Navi (NAVI)?
Atlas Navi is the first Drive to Earn navigation app that uses A.I. and the smartphone camera to avoid traffic by detecting road conditions, accidents, traffic in each lane, available parking spaces, police vehicles and rerouting drivers to avoid problematic roads.
It features licensed 3D NFT vehicles and a sustainable Drive to Earn mechanism and in-app economy that rewards users for each mile driven.
Atlas Navi has received a $1,200,000 grant from the European Union to develop its technology over the course of 2 years, starting in December 2019.
With over 12 years of transportation software experience, the team and company behind Atlas Navi are among the best in the industry and well positioned to disrupt the navigation app market with A.I. and blockchain technologies.
Atlas Navi is available to download for free on the Apple App Store and Google Play or by going to www.AtlasNavi.com Join over 400,000 drivers already using it to navigate and earn whilst driving.

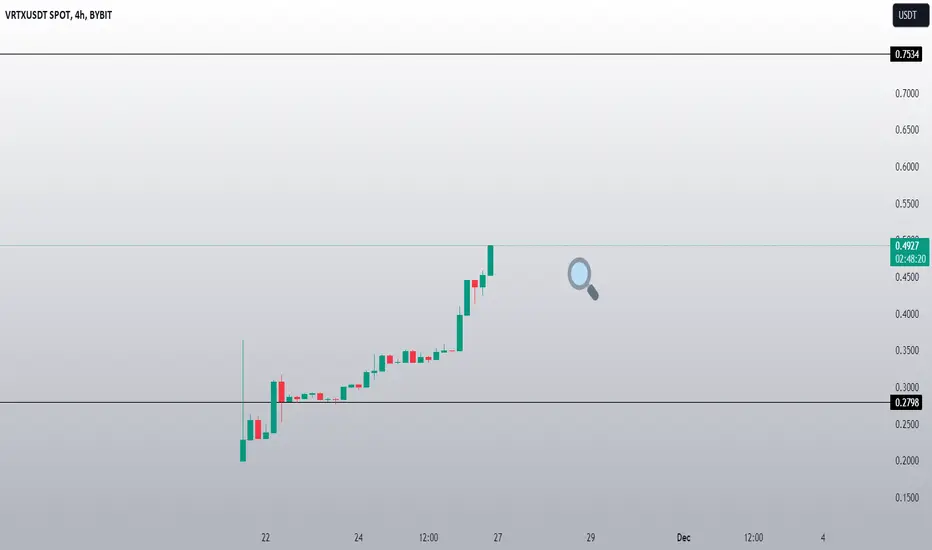
VRTX NEW VOLUME STARTThank you for reading this update.
Depending on our study we see that VRTX has a good chance of volume increase.
This updates depending on day trade, And the market should confirm with time the right market way.
#Nottradingadvice
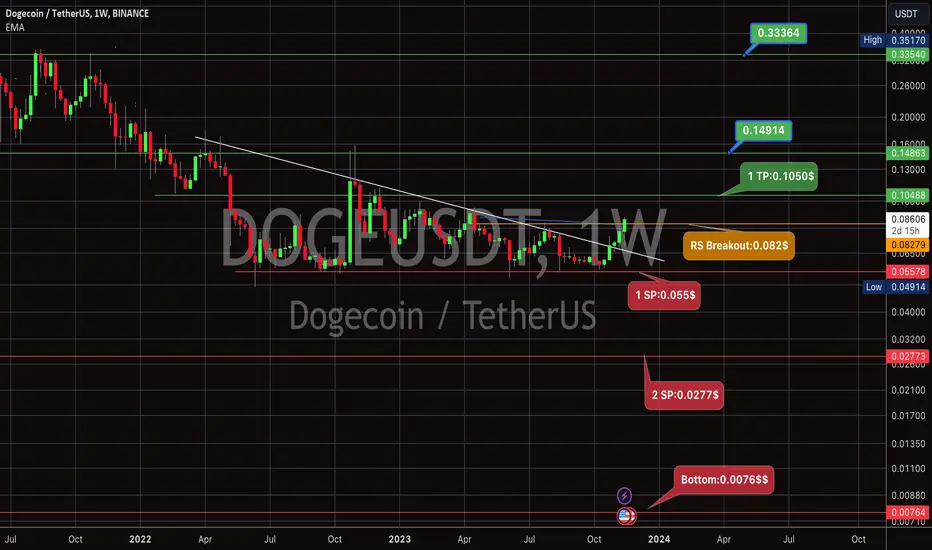
DOGE COIN 2024 $ Target we have a good breakout on the weekly chart , show a strength on the bullish side .
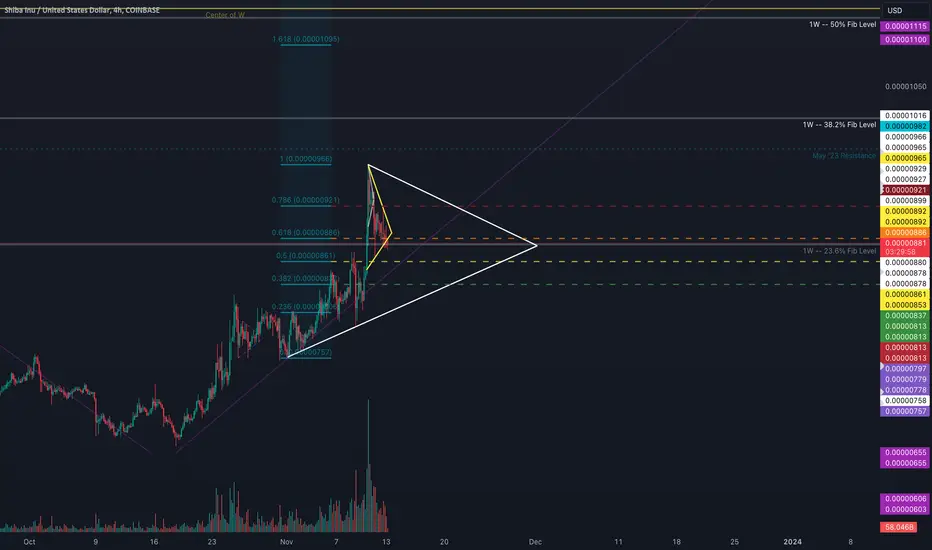
SHIB Pennant IncomingOn the journey to a complete W pattern at the $0.000015 price tag there will be a few, if not more, periods of consolidation. After a hot run up to the 0.00000970 range, Shiba Inu is beginning to consolidate into what may be a week long, or slightly longer, pennant formation. Buying opportunities may present themselves around the Fib Retracement Levels with a potential bottom near the 38.2% level.
A breakout from the projected pennant could take Shib's value to the 1W (1 week) 38.2% Fib Retracement Level with the 1W 50% level being the next stop if this ceiling is blown through with significant volume. However, more consolidation should be expected in my opinion. As always, a breakdown is also possible which could hemorrhage Shib's value to prior lows.
At the time of this article I am still confident on a pending completion of the W pattern (see my other idea linked at the bottom) but macroeconomic factors can accelerate or derail this formation. Stop-losses should be utilized and traders should be cognizant of any significant changes in the climate of the market.
COINBASE:SHIBUSD
GERMANY 30Pair : Germany 30
Description :
Bearish Channel as an Corrective Pattern in Short Time Frame with the Breakout of the Upper Trend Line and Completed the Retracement. If it Breaks the Daily Descending Trend Line and Retest then Buy otherwise it will Complete its " 5th " Impulsive Wave
Entry Precautions :
Wait for the Breakout or Retest

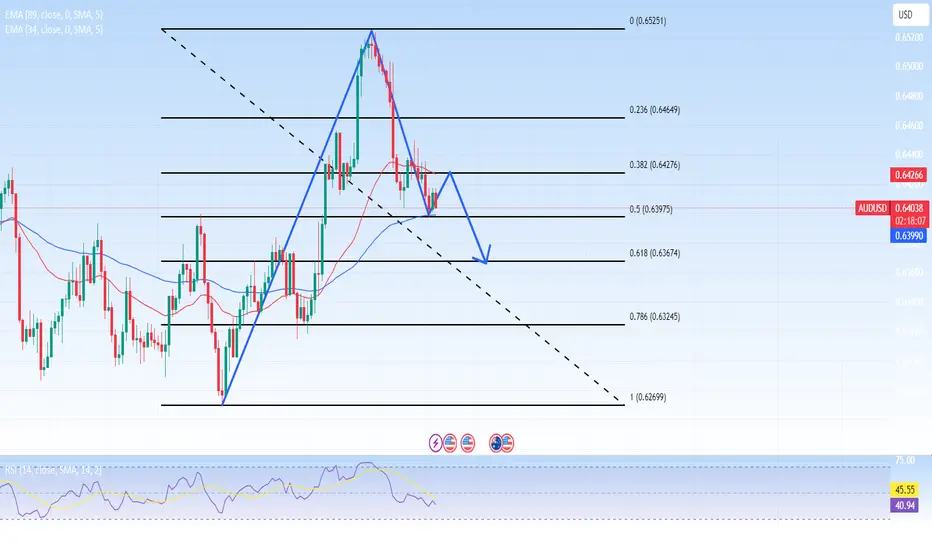
AUDUSD: Asian foreign exchange market is quiet, USD recoversWednesday saw limited movement in the majority of Asian currencies, but the dollar continued its recent upward trend as several Federal Reserve officials cautioned against placing bets that the central bank would stop rising interest rates.
Due to the markets' desire for additional clues regarding US monetary policy, Fed Chairman Jerome Powell's next speech will be the main event of interest.
Because traders are still wary of any aggressive signals from the Fed, sentiment toward Asian markets is still muted. Regional markets have become less appealing to traders due to indications of China's ongoing economic difficulties.
The Australian dollar rose 0.1%, recovering slightly after dovish signals from the Reserve Bank of Australia sent the currency down nearly 1% on Tuesday.
Next HDFC AMCThis is my opinion please consider your due diligence before investing.
This is an analysis of technical or financial , Understanding of business
