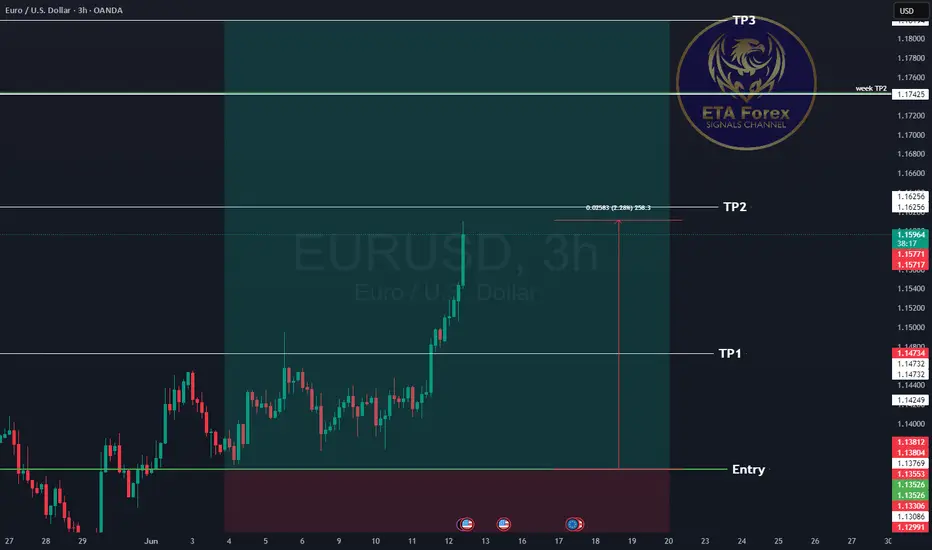
EURUSD LongHere is our EUR USD Signal that we posted
As you can see it's running nicely at 258 Pips.
EURUSD Buy
📊Entry: 1.13538
⚠️SL: 1.12594
✔️TP1: 1.14732
✔️TP2: 1.16256
✔️TP3: 1.18194
We have 5 big swing trades running at present, all of which comes from our trading strategy that is solely based on pure maths. So far in 2025 we have hit 1 stop loss from over 100 trades.
My point to this post is to encourage you all to keep trying, don't give up. It took us over 2 years to perfect this strategy, and we know it works.
If you want any help just ask me, and I will help you.
Tradingsignals
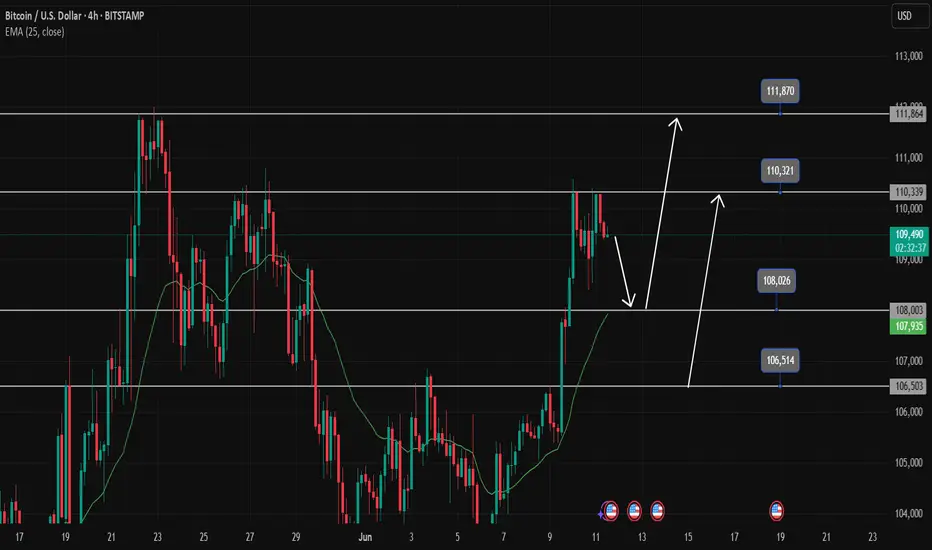
BTC is reviving for a new bull runBTCUSD is correcting to 108000 as it hits the sell zone at 101200. At 108000 it is quite clear to set up BUY signals. Another area to watch for BUY is 106500. BUY SL points are not above 700 price for BTC. Currently the uptrend is still going to continue so any pullback to support is considered a buying opportunity.
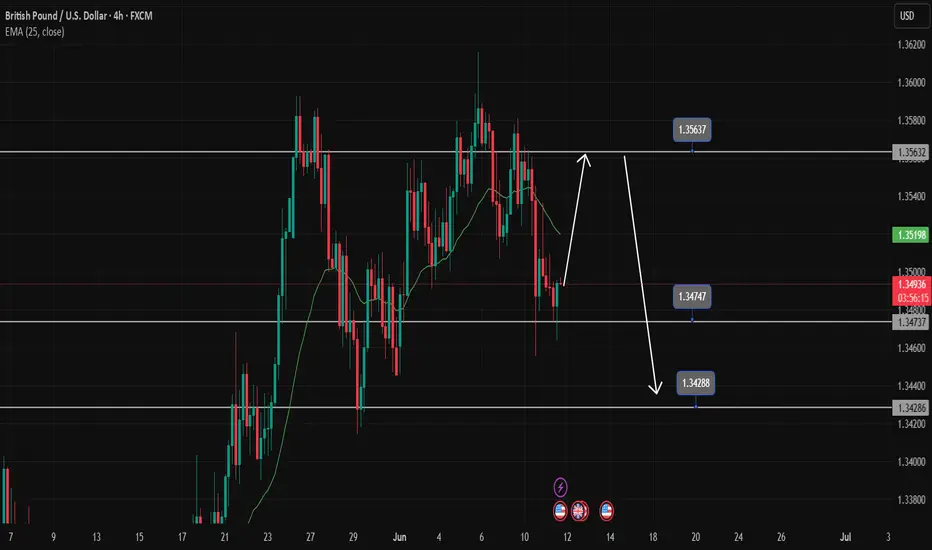
GBPUSD is rising towards the resistance zone of 1.35600GBPUSD is heading towards 1.35600. If the gold price closes around this area, it confirms that the buyers have entered the market. You can set up a BUY signal now with SL placed below the candle wick. After touching 1.356, we can wait for the price reaction and set up a SELL signal again following the sideways border.
Do you agree with our view of buying 1.34900 and SL 1.34600?
Leave a comment
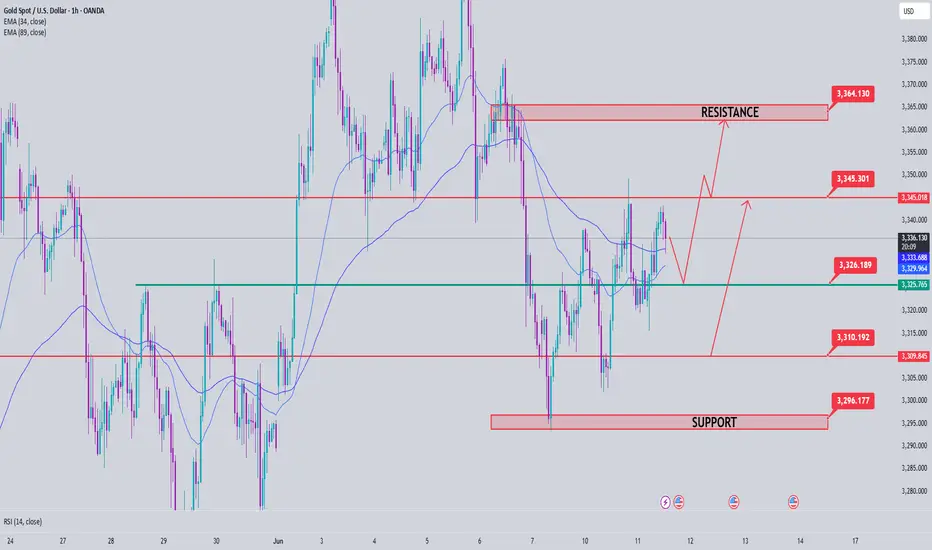
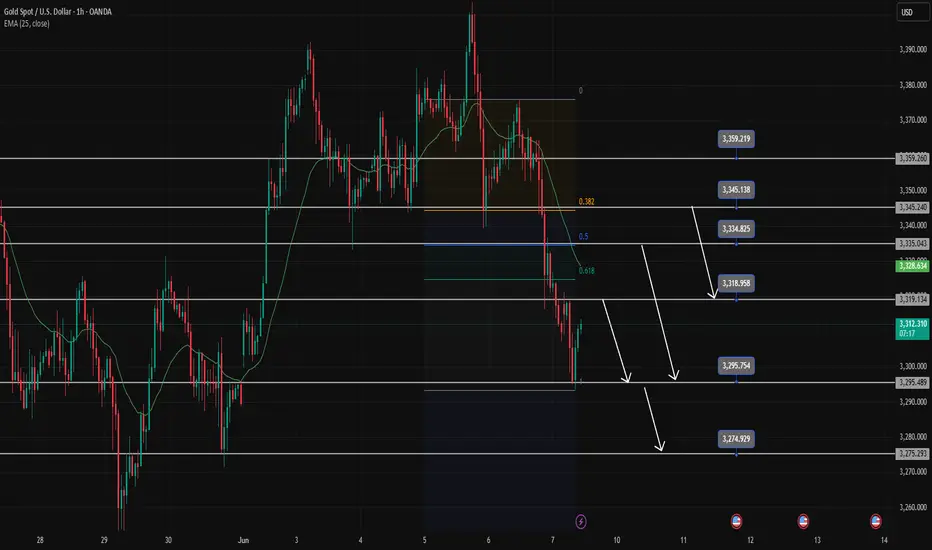
Gold Trading Strategy June 11Yesterday's D1 candle was still a balance candle closing below the important breakout zone 3347. Today's Asian session, strong buying pressure pushed the price back close to the important resistance zone in shaping the trend.
3326 is also worth noting in the European session, so wait for price reaction to BUY, but in the US session, there is CPI news, this zone will be difficult to maintain. The breakout zone 3310 is also very important to wait for price reaction for BUY scalping points. 3295 is an important daily support zone. If there is a price slide from 3295, do not BUY until it touches the support zone 3275.
In the opposite direction of today's Break 3345, wait for 3363-3365 to SELL. The 3345 zone is considered a Breakout zone when broken to trade BUY.
Support: 3310-3295-3275
Resistance: 3364-3380

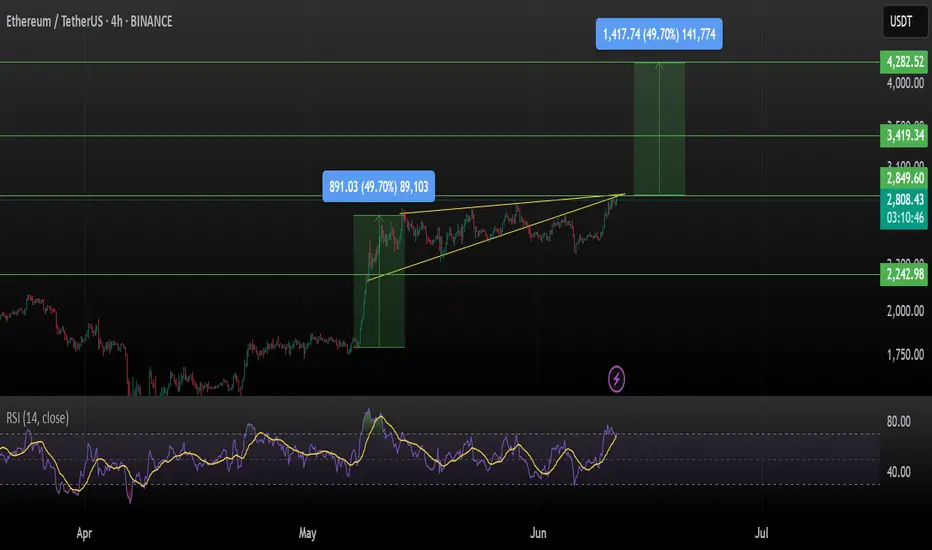
Ethereum (ETH/USDT) – Ascending Triangle Breakout Incoming?ETH is pressing against the upper resistance of a long-forming ascending triangle on the 4H chart — historically a bullish continuation pattern.
Previous Move:
Last breakout saw a +49.7% move, and the structure suggests we could see a similar surge again!
Key Levels:
Support: $2,242.98
Breakout Zone: $2,850
Resistance/Target 1: $3,419
Major Target 2: $4,282 (+49.7%)
RSI: 70.5 — strong momentum, near overbought but in breakout territory.
Volume seems to be increasing near resistance, a breakout could be imminent.
Potential Upside: +49.7% if triangle breaks cleanly.
Bias: Bullish
Timeframe: 4H
Watch for: Rejection at $2,850 or breakout retest for entry confirmation.
This is not financial advice, please do your research before investing, as we are not responsible for any of your losses or profits.
Please like, share, and comment on this idea if you liked it.
#ETH #Ethereum #ETHUSDT
Gold Price Analysis June 11Yesterday's D1 candle was still a balance candle closing below the important breakout zone 3347.
Today's Asian session saw strong buying pressure pushing the price back close to the important resistance zone in shaping the trend. At the end of the Asian session, it failed to break 3342, giving a SELL signal to 3327
The breakout zone 3310 is also very important to wait for price reaction for BUY scalping points. 3295 is an important daily support zone. If there is a price slide from 3295, do not BUY until it touches the support zone 3275.
In the opposite direction of today's Break 3345, wait for 3363-3365 to SELL. The 3345 zone is considered a Breakout zone when broken to trade BUY.
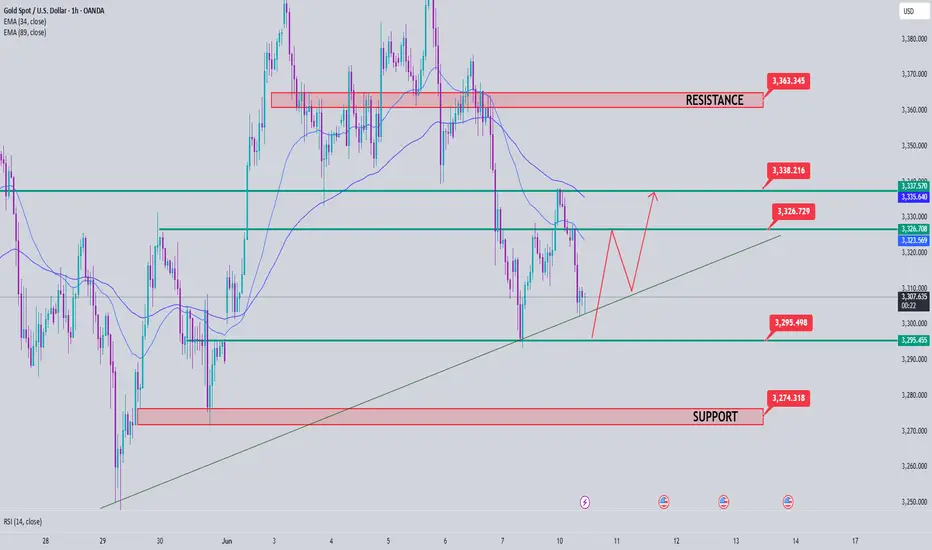
Gold Trading Strategy June 10Gold price in D1 frame reacted at EMA and Trend zone yesterday and bounced back but at the end of the day still closed below the 3335 breakout zone. The downtrend can still continue as long as 3335 remains stable today.
Looking at H1, it is still in a fairly clear downtrend. 3327 is the area that is currently in dispute. 3310 is the resistance zone that Gold broke through in the Asian session. To BUY this area, you must wait for price reaction and confirmation from the candle. Breaking 3309, Gold will head towards today's important support 3295. This is a good zone for BUY signal. The daily support zone around 3275 will prevent any excessive price slide of Gold.
On the other hand, when the buyers push the price strongly through 3327, you must wait for the US session resistance around 3338 yesterday for a SELL signal. (H1 does not break through 3328, we can set up SELL with the confirmation of selling force) Breaking 3338, the bearish structure will no longer exist, the market will switch to a short-term uptrend towards 3364.
Resistance 3337-3364-3374
Support 3310-3295-3275
Wish you successful trading. If you do not understand the strategy clearly, you can contact me for support.

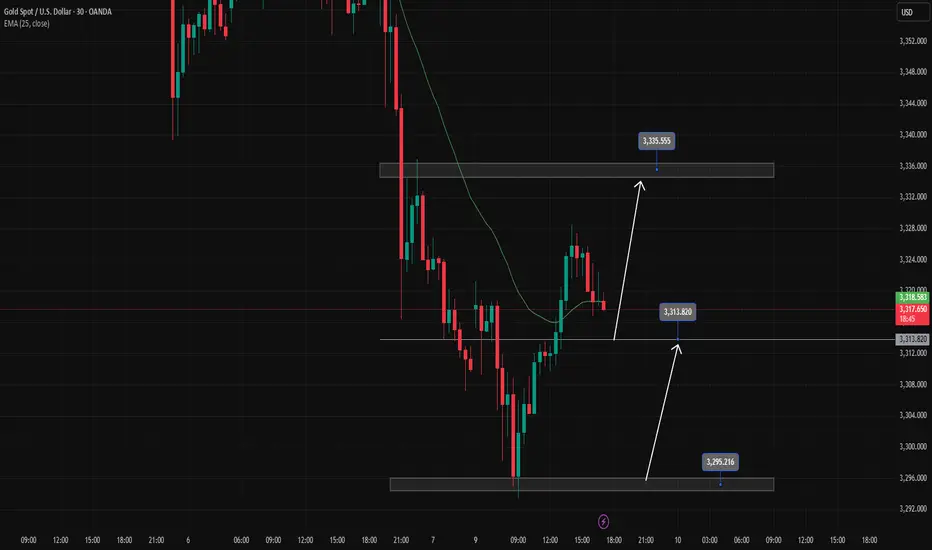
Gold Price Late LonDon Session Trading StrategyGold is looking for support at 3314 in the late European session. If Gold breaks 3314, it will look for a daily trading plan around 3295. Note that 3314 will give a BUY signal if there is a reaction from the buyers. Target for BUY signals 3335 today
Gold Price Analysis June 10Gold price reacted at the Trenline and EMA 34 yesterday and bounced back but still closed below the breakout zone of 3335.
The downtrend can still continue as long as 3335 remains strong today.
H4 shows the provincial port area at 3295 and 3275 in the opposite direction of the provincial port at 3339 and 3365.
H1 is still forming a clear downtrend. 3309 is the immediate resistance zone. is the price zone that can scalp breakout if it closes above this zone. break 3309 Gold will head to 3327 in this zone, if you want to SELL, you have to wait for confirmation from the selling candle. When the buyers push the price strongly through 3327, you have to wait for the US session resistance around 3338 yesterday. Resistance and support during the day are noted around 3275 and 3365
Gold price analysis on June 9The D1 candle on Friday broke the sideways structure and confirmed the downtrend for Gold prices.
Gold prices pushed up quite high in today's Tokyo trading session after touching the Gap zone around 3395.
With this upward force, 3319 will be available at the end of the Asian session. This zone can wait for a reaction and SELL can return because this is the zone where the Sellers pushed the price down at the beginning of the session. The European session will pay more attention to the 3334 zone with a break out point that is also quite important. The upward force will be stopped by the Sellers at the daily resistance level around 3345.
SELL is following the trend and can sustain the profit far away, while the BUY points are considered to find the reaction wave to increase and correct. The first zone is 3295, the second zone is around 3275.
Wishing you a successful trading day

Gold Trading Strategy June 9The D1 candle cluster on Friday broke the sideway structure near the AHT peak and confirmed the downtrend for Gold price by breaking through 50% of the main bullish candle on June 2.
After touching the Gap zone around 3395. Gold price pushed up quite high in Tokyo trading session today and headed towards the first resistance levels around 3319. This area can wait for reaction and SELL to return because this is the area where the Sellers accumulated quite strongly at the beginning of the session.
The European session will pay more attention to the 3334 area with a breakout point also quite important on Friday. If from 3334 the gold price falls, it will form a strong fall according to the downtrend structure and head towards 3275 soon.
SELL is following the trend and can sustain profits far away, while BUY points are considered to find a corrective reaction wave, so narrow expectations.
Support: 3295, 3275
Resistance: 3319, 3334, 3345, 3359
Wish you a successful trading day
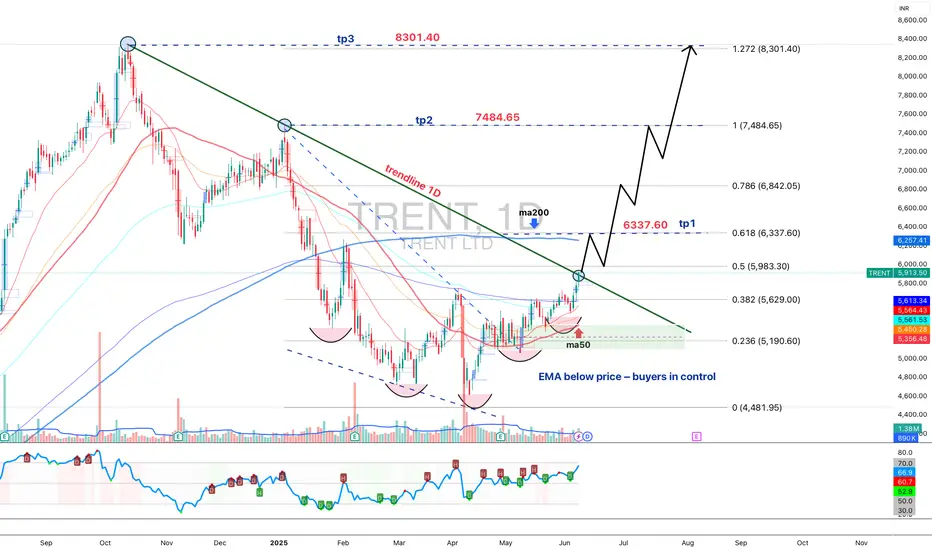
Trent Ltd: Breakout or Fakeout?Trent Ltd: Breakout or Fakeout? Someone’s positioning — the question is which side.
Trent Ltd remains one of the more resilient players in India’s retail landscape. While broader consumer sentiment remains mixed, the company continues expanding its footprint, especially through its Westside stores and fashion vertical. Recent earnings have been stable, and institutional interest appears to be creeping back in — confirmed by a steady rise in volume.
Technically, we’re at a decision point. Price is testing a major descending trendline drawn from the all-time highs. So far, no breakout — but signs of accumulation are building. All major EMAs (50/100/200) are below the price, putting buyers firmly in control. Volume is rising on bullish candles, with no signs of distribution. RSI is holding above 50, climbing steadily, and showing a healthy impulse without overheating — plenty of room left for upside.
The key setup: wait for a confirmed breakout above the trendline, then a retest, and only after that consider entering. Targets, based on Fibonacci levels, line up cleanly:
tp1: 6337.60 (0.618)
tp2: 7484.65 (1.0)
tp3: 8301.40 (1.272)
Until then — this is a watching game, not a trading one. Momentum is building, the structure is clean — but confirmation is king.
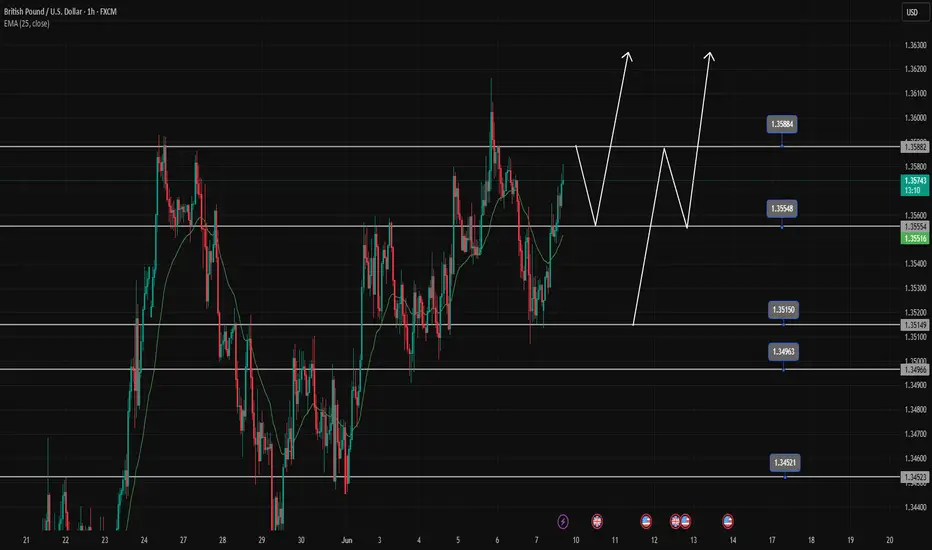
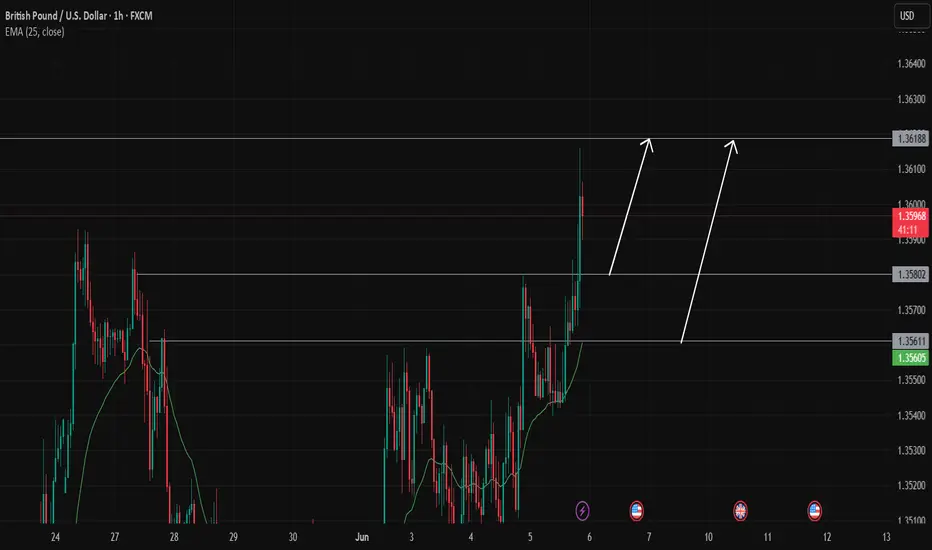
Buy opportunity when price retraces to break the topGBPUSD encounters resistance at 1.358, there is a high possibility that there will be a price reaction to 1.35500 to create a Dow break 1.358 towards higher levels.
GBPUSD is increasing very strongly again in the main trend, we wait for a retracement to the support zones, which is a strong buying opportunity.
1.358-1.355-1.351-1.345 are BUY zones when the price has a reaction of buying force at these price zones.
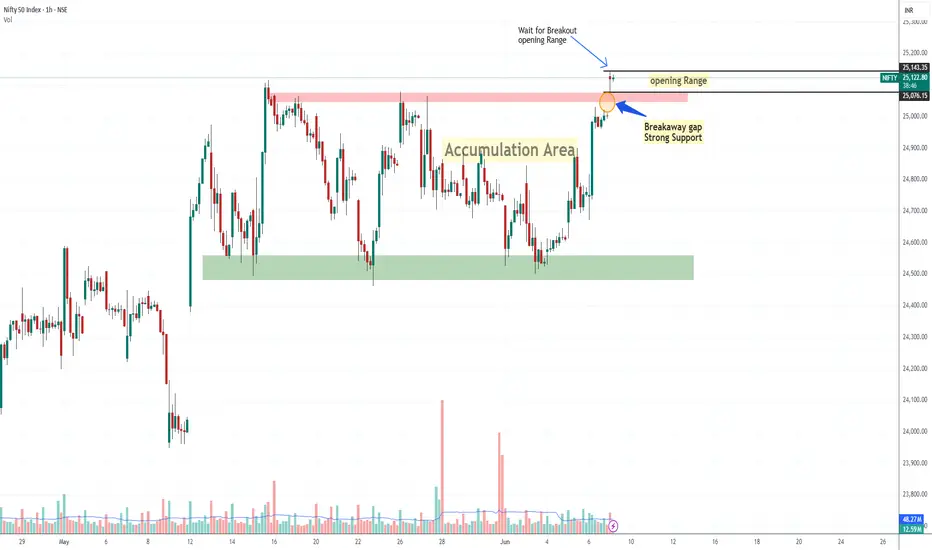
Nifty Gave Breakaway Gap Strong Bullish SignalWhat is Breakaway GAP?
A breakaway gap refers to the situation in the market where there is a strong price movement that crosses support or resistance. Breakaway gaps are formed after substantial periods of consolidation of prices in the market. It signifies a break from the previous trading range or pattern, and it suggests that a new trend or direction is emerging.
Nifty was trading in a range for 5 days and today 6/09/2025 it gap up and sustained above 25000 crucial level, the importance of break-away gap is that it's very strong sign of bullishness in market this also strong support too so if nifty come to retrace it would become support around 25000 level,
if nifty break today opening rang then it's very likely that it will go further so there are possibly Two entry Sign for Long: - first, OR breakout, second: -retracement on 15 Min chart near 20 Ema -50 Ema. Thats My opinion
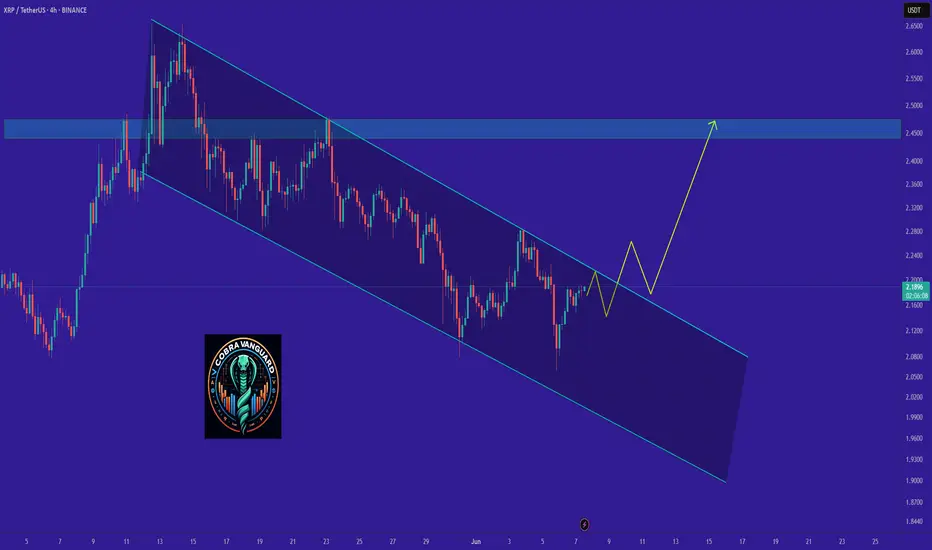
Ripple Analysis - What Shall we Expect !!!If the price can break through this channel's resistance, I expect it to reach $2.5 in a short time.
Stay Awesome , CobraVanguard
SHREE DIGVIJAY CEMENET AT LONG TERM SUPPORT ZONEThis is the Weekly chart of SHREDIGCEM.
SHREDIGCEM is trading near it's long term support zone at 60-70 range.
stock has been moving within a long-term parallel channel, with a well-established support zone in the range of ₹65–₹70.
Currently, the stock is forming a broadening pattern near its support zone, with the pattern support range between ₹70–₹75.
If this level is sustain then,we may see higher prices in SHREDIGCEM.

Gold Overview Strategy June 6The 3-candle D1 cluster did not close above 50% of the main bullish candle on Friday last week. Today's main view will be to BUY to 3413.
Today's resistance is around 3413 for the SELL strategy of the US Session. The Asian-European session is looking for a BUY point. There was just a nice BUY wave around 3363 where the price swept liquidity to 3359.
3382 is the target for the BUY order and this area can SELL Scalp in today's Asian-European session for a recovery wave because today's target is up to 3413 according to the bullish structure.
In the direction of Gold Down, contrary to our analysis, the support zone 3341 and support 3324 will support the upward force of gold prices.
The breakout boundary zone 3382 and 3341. Pay attention to breaking out from important resistances, then do not trade against the trend.
Resistance: 3373-3382-3399-3413
Support: 3357-3341- 3325

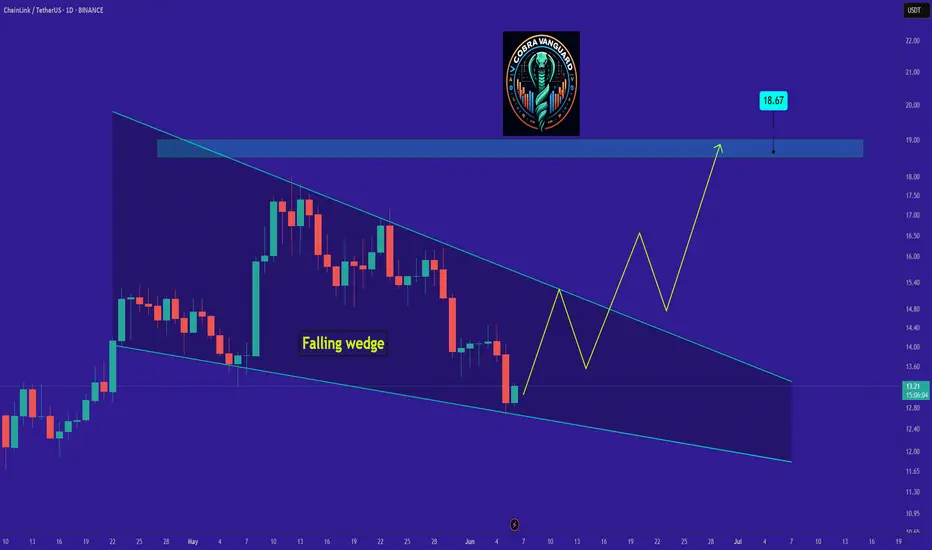
LINK's situation+ Target PredictionSo if you pay attention to the LINK chart you can see that the price has formed a Ascending wedge which means it is expected to price move as equal as the measured price movement.( AB=CD )
NOTE: wait for break of the WEDGE .
Give me some energy !!
✨We spend hours finding potential opportunities and writing useful ideas, we would be happy if you support us.
Best regards CobraVanguard.💚
_ _ _ _ __ _ _ _ _ _ _ _ _ _ _ _ _ _ _ _ _ _ _ _ _ _ _ _ _ _ _ _
✅Thank you, and for more ideas, hit ❤️Like❤️ and 🌟Follow🌟!
⚠️Things can change...
The markets are always changing and even with all these signals, the market changes tend to be strong and fast!!
Gold Price Analysis June 63 D1 candles closed without breaking through 50% of the previous bullish main candle. Today's main view will be BUY up to 34xx
Today's resistance is around 3413 for the SELL strategy of the US Session. The Asian and European Session is looking for a BUY point. There was just a nice BUY beat around 3363 where the price swept liquidity to 3369.
3382 is the target for the BUY order and this area can SELL Scalp in today's Asian and European session because today's target is up to 3413.
In the direction of Gold Down, contrary to the analysis, the support zone 3341 and support 3324 will support the upward force of gold prices.
Breakout boundary zone 3382 and 3341. Note that the break out does not block the train
Gold Price Analysis May 6D1 Frame
It is not surprising that the price has increased again. If this momentum continues, the 3408 level can be reached today.
H1 Frame
The uptrend is clear, heading towards the area above 3400.
3363 is a good support zone, suitable for BUY orders in the Asia - Europe session.
3344 is an important level. If broken, the short-term uptrend will be broken and we need to wait for a new wave.
Resistance to watch
3382 is the nearest resistance zone in today's session.
3397 is an area prone to false breaks (old peaks). The price may react slightly here before reaching the 3408 level.
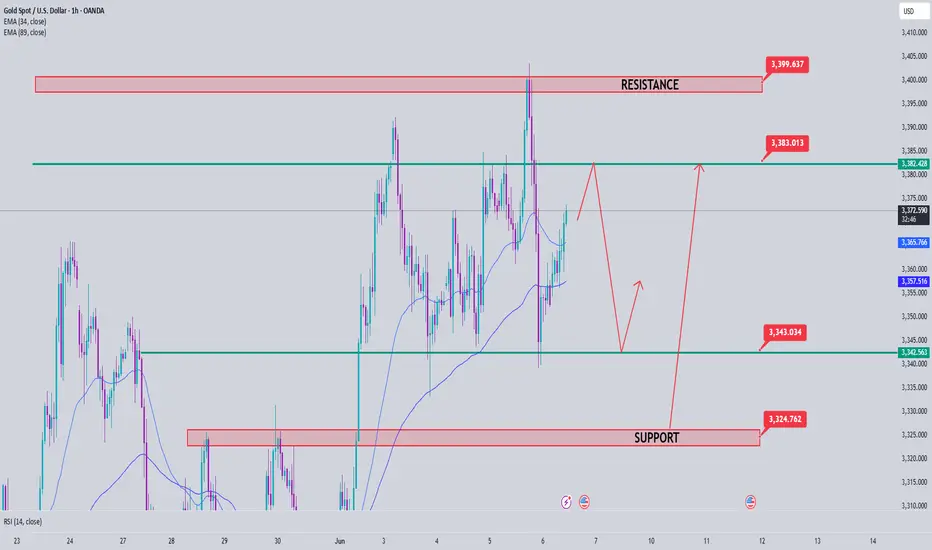
Trading strategy in US sessionGold price in the short term of the US session. The pulling of the h1 candle's wick creates an important liquidity zone of 3373. When h1 closes above this zone, it confirms that the US session will be a bullish session and can reach 3398 at the end of the session. If it closes below 3373, the BUY zone will be noticed at the support reaction in the European session around 3362.

EURUSD short term analysis in US sessionEURUSD is trading in the price range of 1.161 and 1.158. It is unlikely that there will be a breakout through this price range today. If the pair retreats slightly to 1.156, it is considered a good buy signal. Let's wait and see what the next short-term developments of EURUSD are.
I will send you the long term analysis of the pair tomorrow.
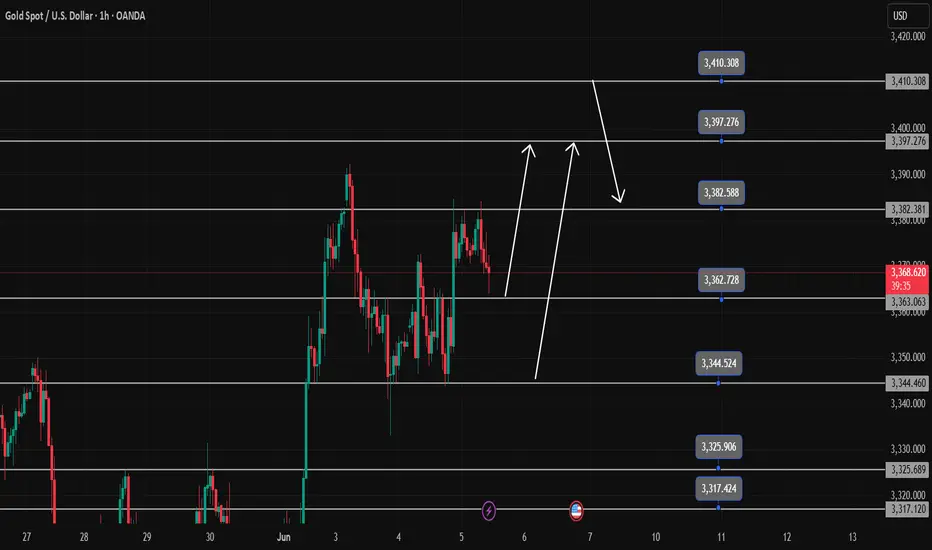
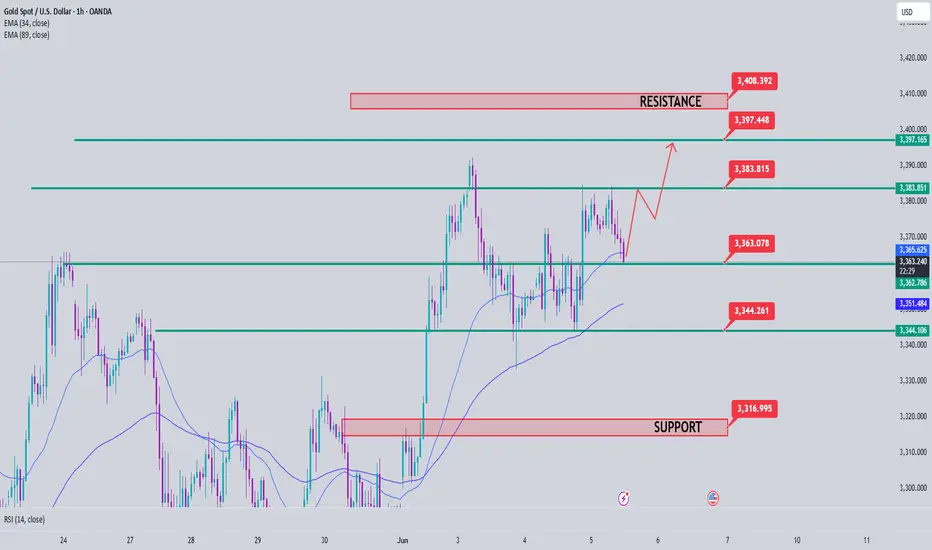
Gold Trading Strategy Overview June 5There is not much surprise with the D candlestick having increased again. The increase can completely reach 3408 today.
The H1 wave structure also shows that the trend is increasing strongly and heading towards above 3400. 3363 is considered the first BUY support zone in the Asian and European sessions today.
3344 is the most important boundary zone of the trend, breaking this zone will cause the uptrend to break to 3400 in the short term and must wait for new uptrend waves.
In the opposite direction, 3382 is the resistance zone of the Asian and European sessions today and is also the breakout zone, this zone will reach above 3400 but before that there will be a reaction around 3397, which is a very likely flash break zone of the previous peak.
Resistance: 3382-3397-3410
Support: 3363-3344-3325-3317
Pay attention to trading at support and resistance zones when there is confirmation