Simple yet effective strategy for the American sessionHello everyone. Also a long-time trader who has just joined the tradingview platform. Hope you are interested and interact with me.
Gold is reacting in the candlestick area of the US session. The possibility of a bounce from this 3352 area is quite high.
And in the US session, if it breaks 3361, it can reach 3375. If this 3352 area is broken, the possibility of a corrective downtrend will continue and we will wait for a sell break of 3352, the target can reach 3325.
Tradingsignals

EGLD Analysisno need to say something , chart is speaking it self .Remember Ride the wave of the trend and let it guide you.
Best regards CobraVanguard.💚

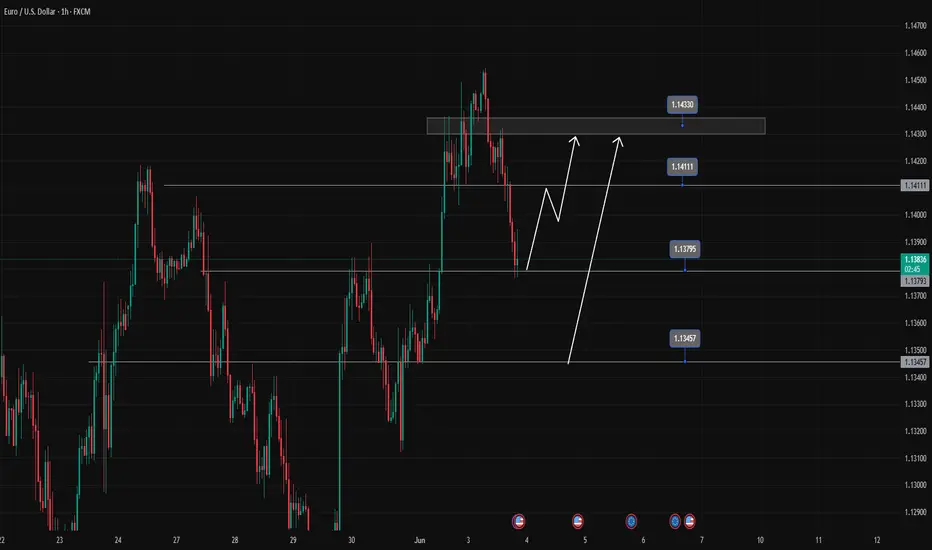
EURUSD is looking for price reactionEURUSD is facing the support zone of 1.138. The price reaction of the buyers is jumping into the market, you think this is a nice BUY signal.
You can set up a BUY signal for the pair towards the target of 1.141 in the short term.
In case the h1 candle closes below 1.138, you have to wait for the next BUY zone around 1.134 to be able to BUY and aim for the original target
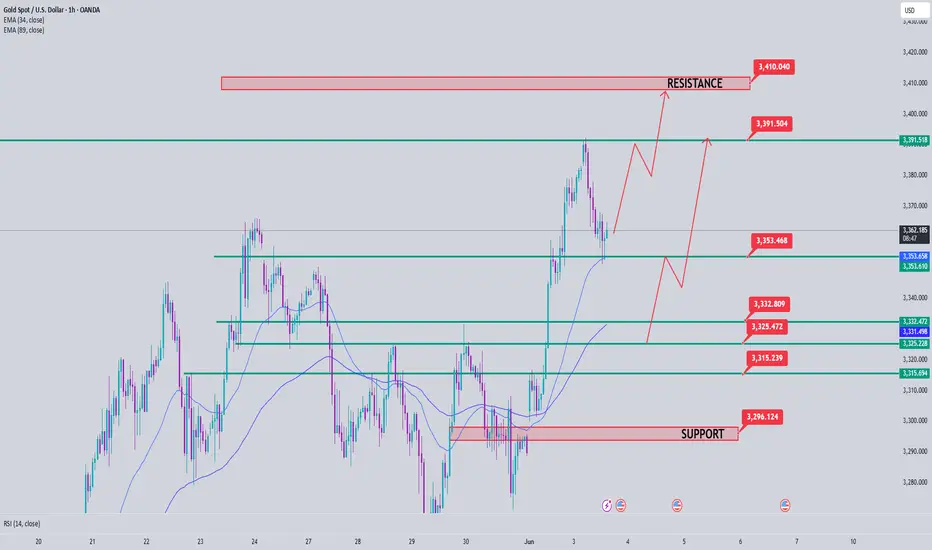
Gold Price Analysis June 3D1 candle confirms strong price increase by breaking the previous selling zone around 3365 and breaking the trendline structure
On the h4 time frame, it shows quite nice price increase waves. On h1, it shows that this morning's Asian session has profit-taking waves from sellers, leading to gold prices worth retesting important support zones.
3353 has reacted once, many zones are considered buying opportunities today. 3332, 3325, 3315 are considered price reactions for long-term BUY signals today, which can push up to 34xx
If 3353 remains stable, Gold will push up to 3390 to react once before touching the daily resistance zone around 3408
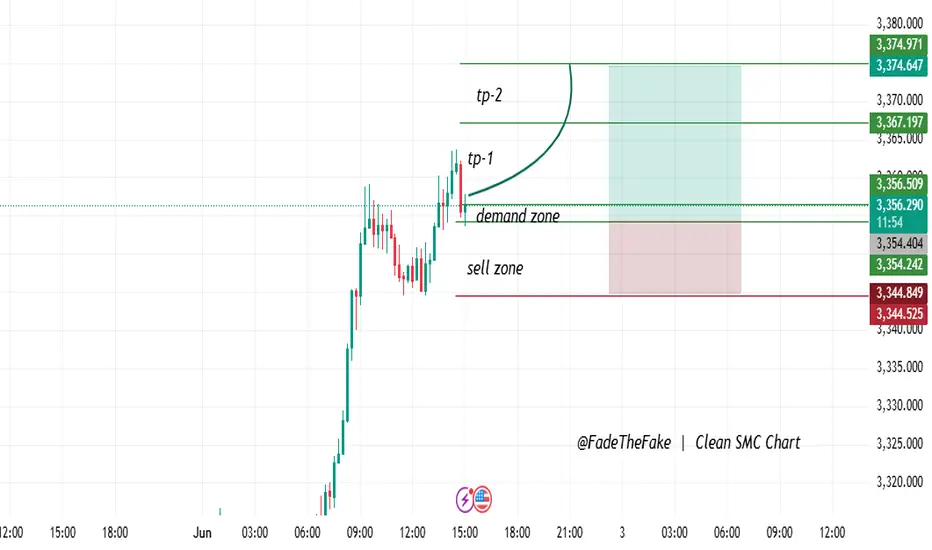
"Demand Zone Play – Targeting Fresh Highs!"Clean Buy Setup | Reaction in Demand Zone
- Price has touched a well-defined demand zone.
- Confirmed bullish reaction with good wick rejections.
- Placed entry just above the zone, stop loss below structural low.
- Targeting more liquidity zones as TP1 and TP2.
Entry: 3356.50
SL: 3344.50
TP1: 3367.20
TP2: 3374.97
This concept draws on a blend of Smart Money Ideas and Demand/Supply Zones
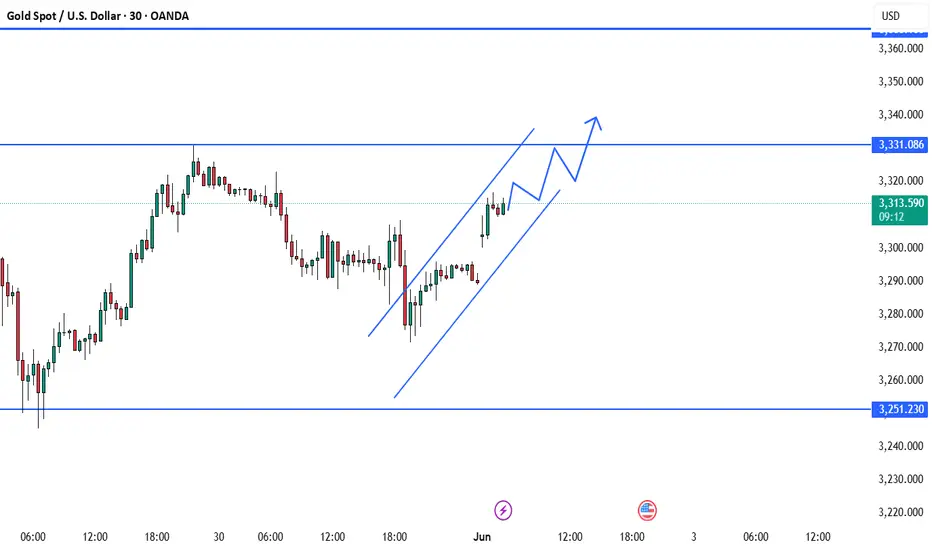
BEST XAUUSD M30 BUY SETUP FOR TODAY 📈 Gold (XAU/USD) is showing bullish momentum on the 30-min chart, trading within a rising parallel channel. Price has recently bounced from lower support and is aiming for the resistance zone near $3,331. 🔼 A breakout above this level could signal further upside, continuing the bullish wave structure. Traders should watch for pullbacks to the lower trendline as potential buying opportunities. 🧠💡 As long as price stays above the $3,251 support, the bullish bias remains intact. 📊✨
Gold Price Analysis June 2With the recovery waves of the D1 frame, the position of Gold returns to the wide Sideway near the ATH zone
3360 and 3260 sideway 100 price for the current trend. And today it is still possible to break this zone.
GOLD increased strongly in the European session, touching the upper border of the sideway model
The h1 wave is still a more bullish wave. With the support zone opening the GAP of the Asian session 3296 is still considered a strong support zone today. The breakout zone in the morning also becomes an important support zone
In the opposite direction of the break 3360, there is still a zone 3368 as the immediate resistance before the Gold price is on the way to ATH. Attention daily resistance 3396

"Demand Activated – Eyes on the Next Move"After a solid bullish move, the price has now retraced into a fresh demand zone between 3305 and 3298. This area is where the last significant impulsive move originated, breaking structure and sweeping up liquidity.
Here’s what we’re keeping an eye on:
✅ Look for bullish rejection candles or engulfing patterns forming within the demand zone.
✅ We need confirmation on lower timeframes (M1–M5) that shows a break of structure (BOS) or strong wick rejections.
✅ It’s crucial that the price doesn’t drop below 3298, as that would invalidate our bullish outlook.
If the demand holds up:
🎯 TP1: 3315
🎯 TP2: 3321 (This is close to the supply and imbalance fill zone)
This setup is a classic Smart Money strategy — it includes:
A liquidity sweep below the lows
A break of structure (BOS)
Filling the imbalance
Tapping into fresh demand
Execution needs to be precise — avoid chasing. Be patient and wait for the price to come to you, then react wisely.

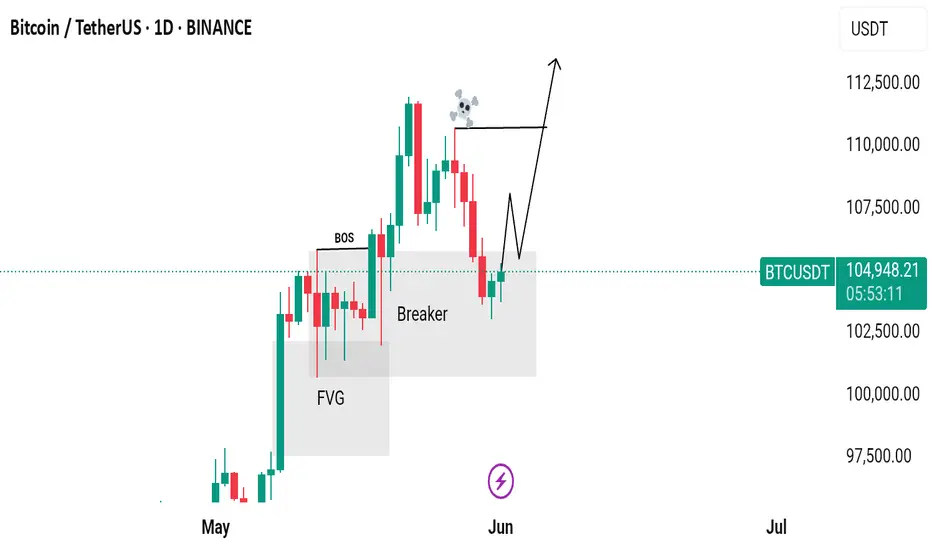
Can Potentially move upwards from here?Bitcoin just created an inducement and it has been hunted. Now the structure is also broken and the inducement is also taken out. The market is in a discount zone, and there's an overlap of a Breaker Block and FVG (Fair Value Gap), which indicates that the market can potentially move upwards from here.
Wait for bullish confirmations here, such as MSS (Market Structure Shift), CISD (Change in Character/Continuation of Internal Structure Dynamics), and failed selling PD Arrays!
Do Your Own Research (DYOR)! This is not financial advice.
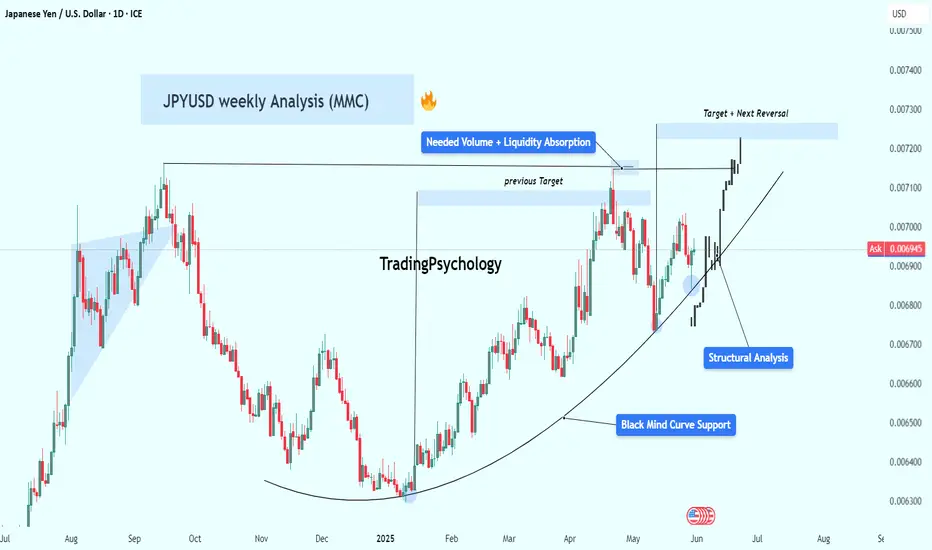
JPYUSD Weekly Analysis (MMC) – Smart Structure & Target Zones🧠 Market Sentiment & Technical Landscape
The JPYUSD currency pair has entered a decisive phase in its multi-week bullish run, driven by structural integrity, smart money behavior, and market psychology. This chart captures a strategic trade progression using the Mind Market Concept (MMC) approach — a hybrid strategy blending curve dynamics, volume imprints, and structural flow to track institutional intent.
We're seeing a powerful alignment of structure, momentum, and volume signals, all pointing to a potential high-probability completion near the upper target/reversal zone.
🔍 In-Depth Technical Breakdown
🔹 1. Curve Support Foundation – The Psychological Bedrock
At the heart of this bullish move lies the Black Mind Curve Support — a dynamic, rounded trendline support based on momentum cycles and structural lows. This curve is not arbitrary; it’s a reflection of where smart money has repeatedly absorbed sell-side liquidity before marking up the price.
Multiple rejections from this zone around 0.00640 – 0.00650 provided confirmation of intent.
The rounded nature of this curve support mimics market accumulation patterns — think of it as a “loading zone” before explosive movement.
🔹 2. Structural Breakout – A Clean Bullish Sequence
Price respected a multi-month resistance line and finally broke out in April–May 2025. The breakout wasn't just technical — it occurred after:
A liquidity sweep below the February-March higher low
A retest of the curve
A sharp bullish engulfing formation on the weekly chart
This combination confirms a high-confidence shift in market structure — transitioning from ranging accumulation to directional markup.
🔹 3. Volume Imprints – Institutional Footprints
The chart highlights a Needed Volume area — this is where previous institutional order blocks likely existed. The strong bullish move into that zone confirms:
Buyers were active and aggressive
The area served as both resistance and a breakout retest
This volume footprint now acts as a supportive launchpad, reaffirming trend continuation logic.
🔹 4. Target + Next Reversal Zone
As price continues climbing, it’s now approaching a critical confluence zone around 0.00720 – 0.00725. This zone is projected using:
Fibonacci extension of the last impulse
Measured move symmetry
Historical supply and resistance (Q3 2024 highs)
This is not just a target — it’s a high-probability reversal area. Expect:
Potential exhaustion candles
Momentum divergence
Institutional profit-taking
📊 MMC Strategy Approach – Trade Blueprint
Parameter Detail
Bias Bullish (until reversal confirmation)
Current Price ~0.00694
Buy Zone 0.00685–0.00690 (pullback entry)
Target Zone 0.00720–0.00725
Curve Support 0.00650–0.00660
Invalidation Clean break below curve or engulfing bear momentum
This MMC-based setup emphasizes patience, psychological precision, and proper confirmation for both entry and exit. The idea is to buy smart (on structure), and exit smarter (at institutional interest zones).
⚠️ Key Trader Insights
Don’t chase — wait for clean entry signals near structure (curve or trendline retest).
Use volume confirmation — don’t trade against low-volume rejections at resistance.
Watch emotional extremes — FOMO at targets often precedes reversal.
Plan for both scenarios:
Continuation → scale partial profits at target
Reversal → shift bias if bearish confirmation aligns with momentum loss
🔖 Summary Outlook
✅ Trend: Bullish continuation, respecting structure
🎯 Immediate Focus: Reaching the 0.0072 Target + Next Reversal Zone
🔄 Actionable Tip: Monitor for rejection/absorption candles in the upper blue zone
💼 Risk Management: Use curve break or engulfing reversal as an exit trigger
This setup reflects high technical confluence and fits into a longer-term institutional roadmap. Whether you're swing trading or intraday scaling within this wave — the logic remains powerful.
USDJPY Analysis week 23Fundamental Analysis
Tokyo's core CPI (excluding fresh food) - a key inflation gauge - rose 3.6%, higher than forecast and last month. This increases the possibility that the Bank of Japan (BoJ) will continue to raise interest rates this year, although most experts predict the BoJ will keep rates unchanged until September.
Meanwhile, the USD rose sharply after a US appeals court overturned the decision to remove most of the tariffs imposed by Mr. Trump. However, the Yen still appreciated slightly against the USD.
Technical Analysis
After consecutive declines on Friday, the pair is sideways waiting for the next development. 142.900 is the next support zone that the pair faces, this is the breakout zone and also the trendline meeting. Break this price zone must wait 141,200 for weekly support zone
145,900 last week's peak resistance zone acts as resistance for the pair's price reaction towards this week's resistance peak around 148,000

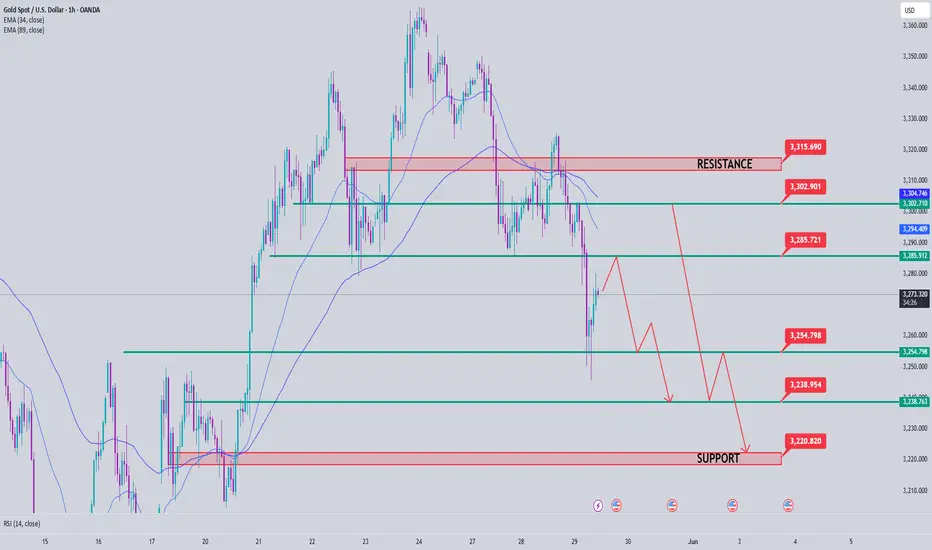
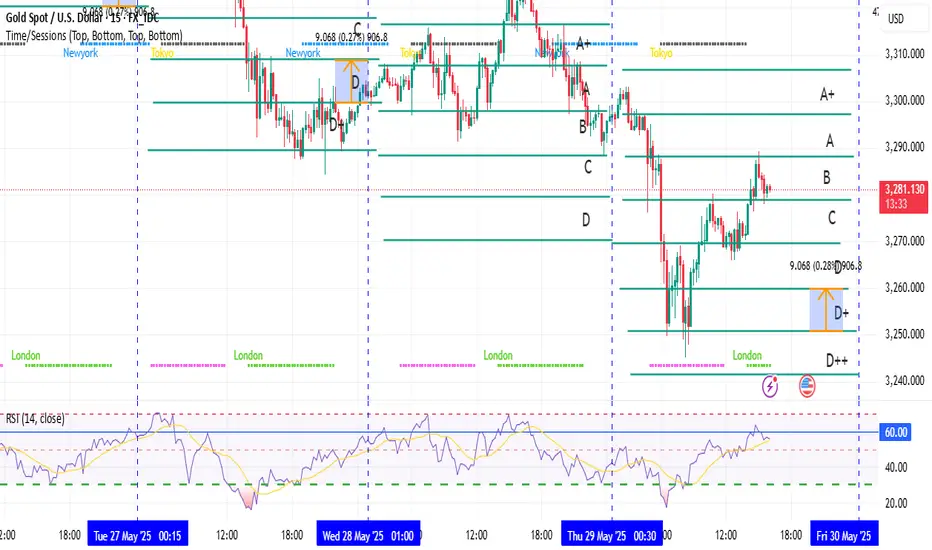
Gold Price Analysis May 30Candle D shows strong buying power on Thursday, most likely today Asia and Europe will decrease and the US session will return to the uptrend.
The bearish wave structure is heading towards 3280. This zone can be bought in Asia and Europe. In the US session, wait for the price reaction to break this zone, limit buying until the bottom of 3254.
Break 3254 confirms the downtrend and heads towards the two support zones 3238 and 3211
When the support zones bounce up, a nice bullish wave is formed and do not SELL Scalp until the 3320 zone. If you break, keep the BUY order up to 3343.

Gold price analysis on May 29Not beyond the previous analysis of the D candle confirming the decrease and maintaining the trend of the candle on May 27
After touching the breakout zone of 3257, Gold is reacting to increase again and there is a high possibility that there will be buying force in the market today
3275 is the reaction zone that Gold is facing in front of this increasing force when breaking 3275 will head to 3285 and this is an important breakout zone with a large number of sellers accumulating in this zone. Breaking 3285 is considered a temporary break of the downtrend and waiting for the next reaction zones for SELL strategies around 3302 and 3314
The support zones with a tendency to react to prices and are also targets for SELL signals are noted in the resistance zone of this morning's Asian session around 3256. Two notable support zones today for bottom-probing signals are noted around 3238 and 3220.
BEST XAUUSD M30 BUY & SELL SETUP FOR TODAY 📉📊 Gold (XAU/USD) Technical Outlook – Key Decision Zone Incoming! ⚠️📈
Gold prices are currently testing a crucial support zone around 3,251, following a strong bearish momentum. As shown on the M30 chart, the market is now at a make-or-break level, where two potential scenarios could unfold: either a bullish reversal toward the 3,280–3,300 area if price holds and confirms support ✅, or a bearish continuation if the level breaks, pushing price lower toward 3,220 or beyond ❌. Traders should watch for price action signals and wait for a clear breakout or strong bounce confirmation before entering any trades 🧠🔍. This is a high-volatility reaction zone — trade smart! 🎯📉📈

Trading harian Plan 29/05/2025
XAUUSD will only take a BUY position, we will enter at Area B and Area D and exit at A, also looking at the RSI.
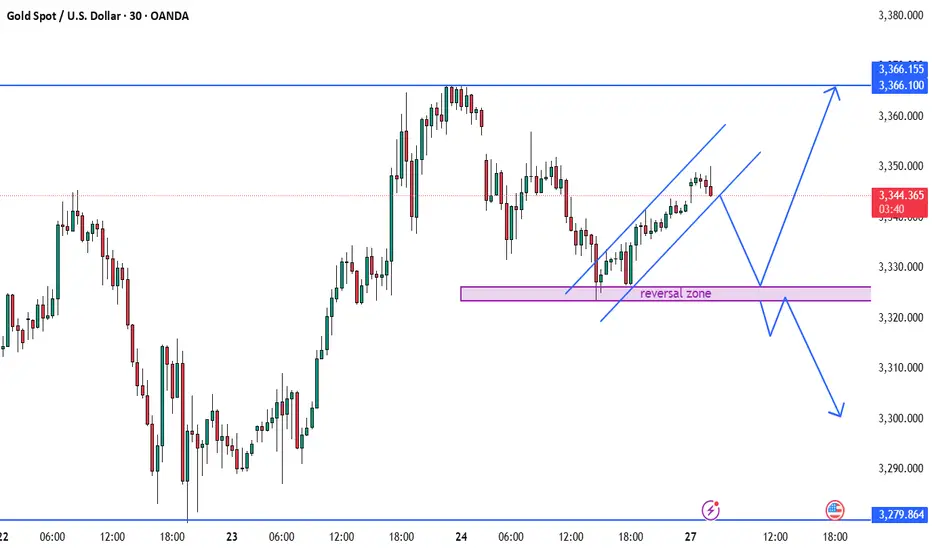
BEST XAUUSD M3 BUY AND SELL SETUP FOR TODAY 📊✨ Gold (XAU/USD) Technical Outlook – 30-Min Chart ✨📉
Price is currently trading within a rising channel after a bounce from the marked reversal zone 💜, suggesting a short-term bullish trend 📈. However, the chart outlines two key scenarios: if price breaks out upward, we may see a move towards the 3,366 resistance zone 🔼. Conversely, if the channel fails and price breaks downward, a retest of the reversal zone could trigger a deeper bearish move 📉, potentially targeting the 3,300 area or lower. Traders should watch for confirmation at key levels and react accordingly — not predict impulsively. 🧠⚖️📍
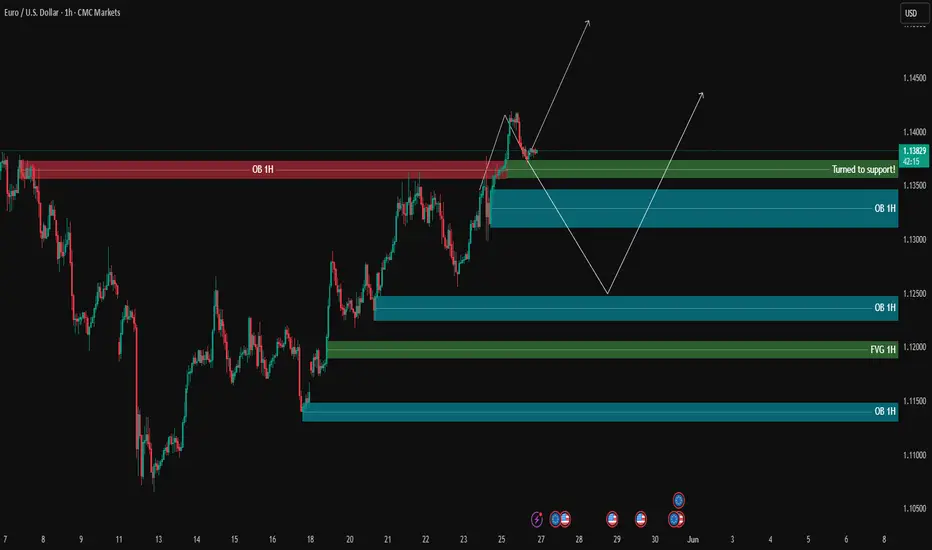
EURUSD Analysis - Waiting for movement
EURUSD has broken above the 1H resistance and has retested it, which is now acting as temporary support.
🔄 If price starts ranging around this level, we could see a short-term bearish move of a few dozen pips, targeting the buy-side liquidity and unfilled orders highlighted on the chart.
📈 However, if price gains bullish momentum from here, there's a potential for a 100-pip upward move.
We’re currently watching how price interacts with the supply and demand zones, to align our entries with it on the lower timeframes.
🔍 Insight by ProfitaminFX
If this outlook aligns with your bias, or if you see it differently, feel free to share your perspective in the comments. Let’s grow together 📈
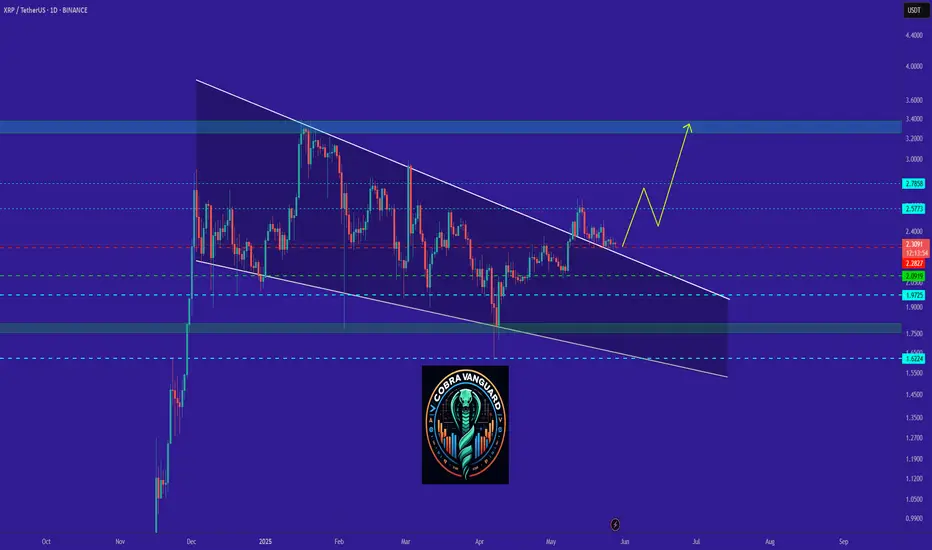
XRP Ready for PUMP or what ?Ripple has successfully broken out of the falling wedge pattern and retested the breakout zone,the price is holding firmly above previous resistance, which now acts as strong support.
Continued strength could lead to upward movement toward targets at $2.65, $2.95, and $3.35
Stay Awesome , CobraVanguard

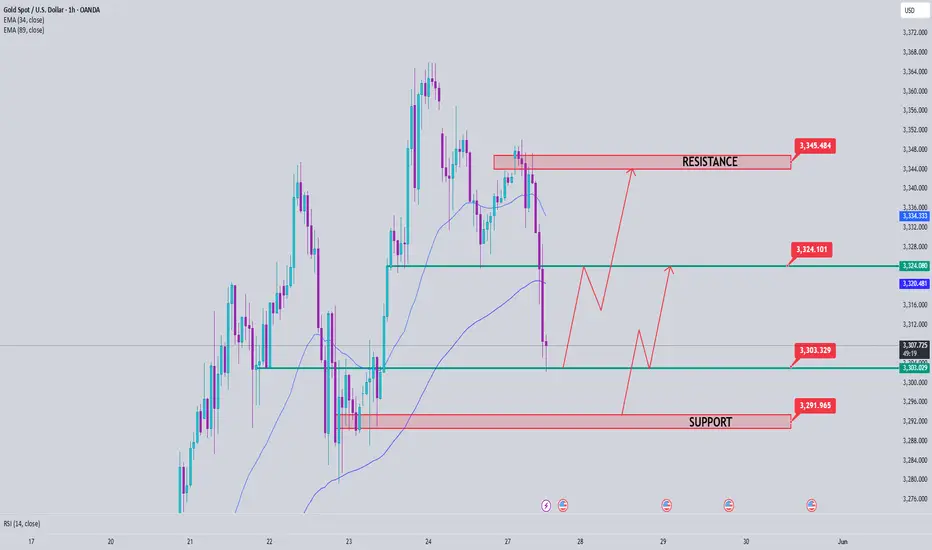
Gold Price Analysis May 27The price increase at the end of the day was expected to push the price up today, but surprisingly, at the end of the Asian session and the beginning of the European session, gold fell sharply.
After the liquidity sweep to 3305.
The immediate support level that Gold is facing is 3303. This border is still used for trading in the European and American sessions. Pay attention to the daily support level around 3292.
3323 is an important resistance zone when it breaks out, you can SELL scalping here for a round and then the Asian session resistance around 3345 is considered a stable area for gold prices in the uptrend of the American session.
Note that breaking 3303 breaks the uptrend and the recovery will be weak, so consider TP for reasonable buy entries.
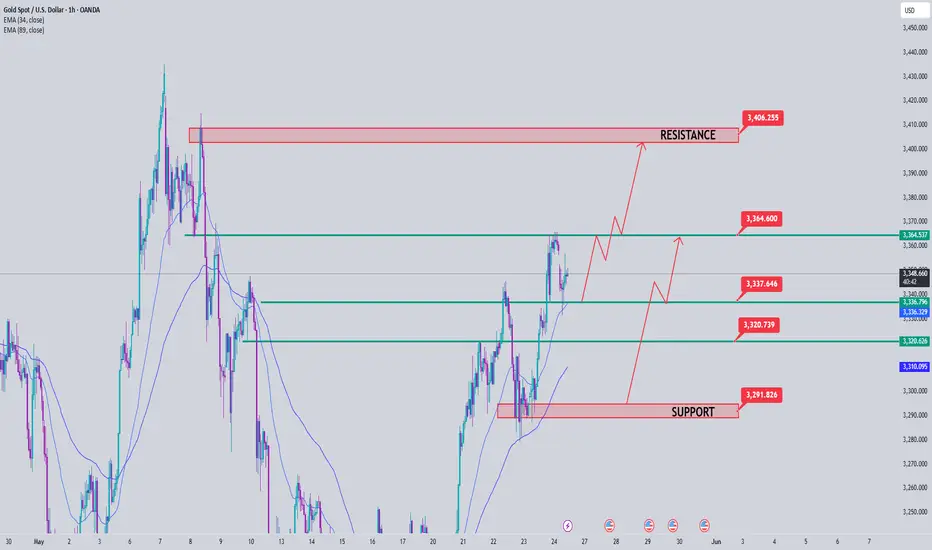
Gold Price Analysis May 26After a correction, the D candle on the following day confirmed a strong price increase towards ATH in the near future
The barrier to reach the all-time peak is not much and it is difficult to have a downtrend at the present time
The gold price increase in the early Asian session met with a price reaction at the Gap opening zone around 3356. With the candle's force, it is completely possible to push the price up to 3364 in the late Asian session or early European session. The nearest lower border is noted around the Asian session resistance zone this morning at 3335-3336. If 3364 does not break in the European session, it can give a pretty good SELL signal with a target of 333x and deeper at 321x. If it breaks 3264, it confirms a strong uptrend and only BUYs and does not look for a SELL point. The resistance until the target of 3405. 3191-3292 still plays a daily support role for any prolonged price decline of Gold
HCCHCC is on the verge to give triangle breakout provided that it sustains and closes above 31.5. I observed increased market participation. It may face bit of resistance near 36 level and above that it has a potential to go up to 45 levels. But closes below 28.5 may change my view for the stock. Again I'm saying that sustaining above 31.5 is very crucial. Keep a closer watch on how it reacts near this levels.

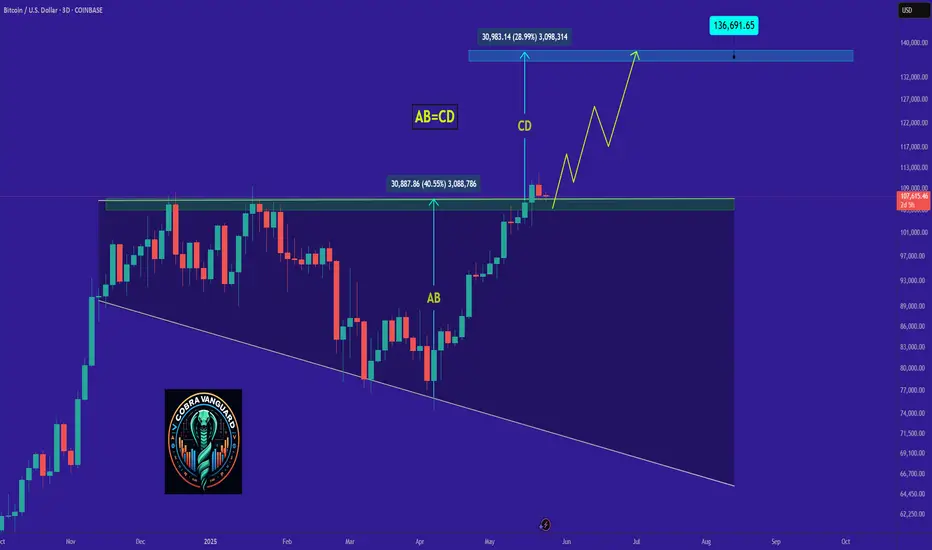
"BTC - Time to buy again!" (Update)As mentioned in the previous analysis, the price reached the top of the wedge and broke out with a price increase. Now that Bitcoin's price is above the wedge, it can be said that with a slight price correction, it could follow the pattern and make a measured move where AB = CD.
PREVIOUS ANALYSIS
Give me some energy !!
✨We spend hours finding potential opportunities and writing useful ideas, we would be happy if you support us.
Best regards CobraVanguard.💚
_ _ _ _ __ _ _ _ _ _ _ _ _ _ _ _ _ _ _ _ _ _ _ _ _ _ _ _ _ _ _ _
✅Thank you, and for more ideas, hit ❤️Like❤️ and 🌟Follow🌟!
⚠️Things can change...
The markets are always changing and even with all these signals, the market changes tend to be strong and fast!!