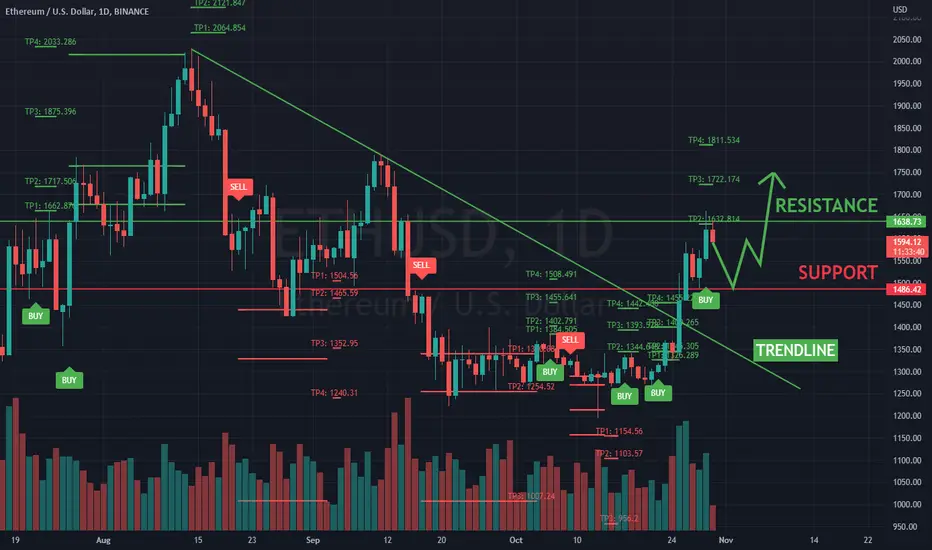
ETHUSD Breaking Trendline To Test ResistanceETH has made a bullish price action movement with good volume over the past few days and importantly breaking a 3-month period trendline.
However, ETH finding resistance at 1630 level, if it fails to break will reverse to find support at 1480 level for continuation of bullish movement upward next resistance level 2000.
Please support if you like my idea and do not forget to press the ✅BOOST BUTTON✅ 🙏😊 & Share it with your friends. Have a good trade.
DISCLAIMER:
This idea is for information and educational purposes only and should not be construed as a solicitation to buy or sell any of the stocks mentioned herein. The speakers or his staff may have positions in some of those stocks
Trading involve risks, including possible loss of principle and other losses
If investment and other professional advice are required, the services of a licensed professional personal should be sought.
Tradingstrategies
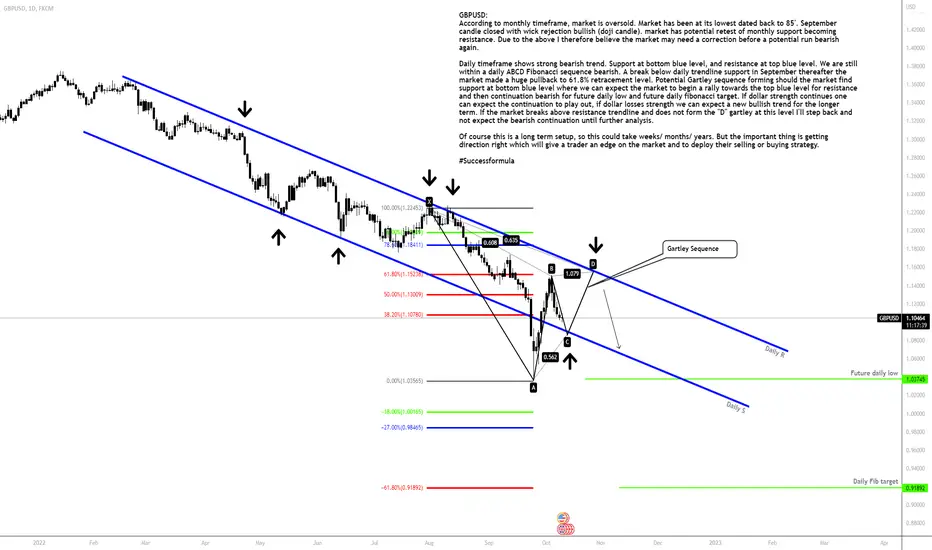
GBPUSDGBPUSD:
According to monthly timeframe, market is oversold. Market has been at its lowest dated back to 85'. September candle closed with wick rejection bullish (doji candle). market has potential retest of monthly support becoming resistance. Due to the above I therefore believe the market may need a correction before a potential run bearish again.
Daily timeframe shows strong bearish trend. Support at bottom blue level, and resistance at top blue level. We are still within a daily ABCD Fibonacci sequence bearish. A break below daily trendline support in September thereafter the market made a huge pullback to 61.8% retracement level. Potential Gartley sequence forming should the market find support at bottom blue level where we can expect the market to begin a rally towards the top blue level for resistance and then continuation bearish for future daily low and future daily fibonacci target. If dollar strength continues one can expect the continuation to play out, if dollar losses strength we can expect a new bullish trend for the longer term. If the market breaks above resistance trendline and does not form the "D" gartley at this level I'll step back and not expect the bearish continuation until further analysis.
Of course this is a long term setup, so this could take weeks/ months/ years. But the important thing is getting direction right which will give a trader an edge on the market and to deploy their selling or buying strategy.
#Successformula
2400+ PIPS INTO THE FUTUREThis pair firstly respect round number,A range that started since 08 June till 22 Sept 2022 that the market gave a clear direction.
A repeat of 22 June 2015 price level is likely to play out bring an overall price target to $195.00.
A very massive BULLISH is eminent based on the confluence with over 3 technical indicators especially the third bounce on the trendline.i am rooting for a long while i take out 50% of my profit at $175.00
GOOD LUCK SWING TRADERS

MTF Wave Stochastic RSI full wave example JASMY/USDTA good example for a full MTF Wave Stoch RSI full wave on the 12h time frame with clear entry and exit on the MTF. Although it is an old PA for JASMY, I find this one of the best case studies on how to read the Stoch waves on the MTF for precision entries, from which we can learn from. Don't hesitate to ask if you have any questions!

Learn How to Trade Wedge Pattern Formation | Full Guide 📚
Learn my wedge pattern trading strategy.
In this video you will learn:
How to spot the pattern
Meaning of the pattern
Trading entries
Stop loss
Take profit
Real market example
❤️Please, support this video with like and comment!❤️

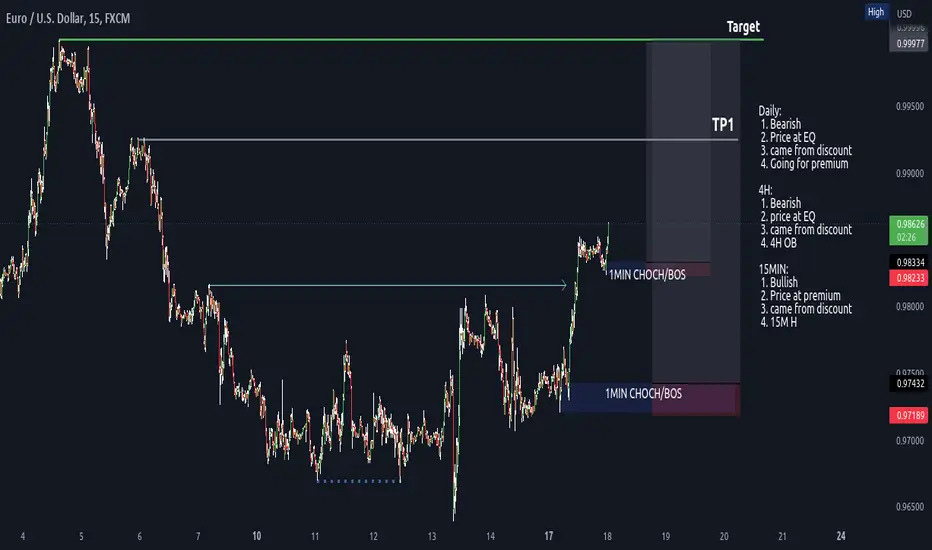
EURUSDDaily:
1. Bearish
2. Price at EQ
3. came from discount
4. Going for premium
4H:
1. Bearish
2. price at EQ
3. came from discount
4. 4H OB
15MIN:
1. Bullish
2. Price at premium
3. came from discount
4. 15M H
Wait for 1MIN BOS/CHOCH before entering the trade
2 TradingView Strategies for trading GoldTradingView offers a great deal of built-in and community-led features, including Indicators and Strategies. It is the latter feature that I will discuss in this trading guide in relation to trading one of our clients' favourite instruments to trade, gold.
Strategies are programmes, written in the Pine Script language, which can execute, modify, and close buy and sell orders. The Strategies are programmed to perform these actions automatically when certain conditions are met as it relates to a tradeable asset. You can think of Strategies as automated trading robots.
TradingView has thousands of Strategies that you can run on your charts. Strategies are typically created to work best with certain instruments and certain time frames. But bear in mind, that not all Strategies are created equal, and you should be very careful with what Strategies you select and ensure that you back tested them before deciding to implement them in a live trading environment.
With the cautions out of the way, lets now dive into two TradingView Strategies that are popular with gold traders.
Buy - Take Profit OR Stop Loss % Based (BTP/SLB)
The BTP/SLB Strategy will enter sell trades when the price of gold closes above the look-back period’s 200 SMA. Once the script enters a trade, the BTP/SLB will hold the trade until it hits its percentage-based stop loss or take profit level.
Using TradingView’s Beta ‘Deep Backtesting’ feature, we can see that the 30-minute time frame appears to be one of the most successful periods to apply this Strategy on. It might pay to alter the Stop loss percentage from the default 2% in order to maximise the Strategies win rate.
A note caution: the Strategy appears to disregard the trend direction of the SMA. We can see that the Strategy frequently enter losing trades when the market is in a longer-term upwards trend (see the candles around late-July to early-August). To overcome this limitation, it might be wise to simply apply the Strategy to your chart without activating it, so that you can manually enter a trade after the Strategies conditions are met, but you can also eye a general downtrend over a longer-term timeframe.
XAU/USD RSI EMA 1hour strategy
The XAU/USD RSI EMA 1hour Strategy follows some simple rules using data from an RSI and an EMA. When the price of gold is above the EMA and the RSI indicates high oversold conditions, then the Strategy enters a long trade. Conversely, when the price of gold is below the EMA and the RSI indicates low oversold conditions, then the Strategy enters a short trade.
I would suggest that you ignore the name of this Strategy and explore the use of this Strategy on lower, especially if you are interested in entering and exiting trades frequently. However, the accuracy of the Strategy may change on these different time frames, but an exploration could prove fruitful under the right conditions.
NASDAQ US100 Long IdeaLooks like the last day or so has produced a bullish triangle in the Nasdaq.
We're just waiting for confirmation of a breakout

FREE 12 WEEKS INTENSIVE TRADING PROGRAM 📚
Hey traders,
For those who just started to trade, I suggest a 12 weeks intensive training program. Each week will be dedicated to a specific topic. Starting from the basics you will gradually mature and by the end of the intensive you will have a complete trading strategy.
✔️Week 1 - Practice market trend identification
Learn to identify the direction of the trend. Master the recognition of a bullish trend, bearish trend and sideways market.
✔️Week 2 - Practice support and resistance.
Learn to identify key levels. Master support & resistance recognition.
✔️Week 3 - Learn candlestick pattern.
Study classic candlestick formations and practice their recognition.
✔️Week 4 - Learn price action patterns.
Study classic price action patterns: trend-following patterns, reversal patterns and consolidation pattern and learn to recognize them.
By the end of the first month, you will mature the basics of candlestick chart analysis.
✔️Week 5 - Practice supply and demand zones.
Learn to identify supply and demand zones. Learn to combine candlestick analysis with support and resistance to identify the potential reversal zones.
✔️Week 6 - Practice multiple time frame analysis.
Master top-down analysis. Learn to apply all the techniques studied previously on multiple time frames.
✔️Week 7 - Learn different entry strategies.
With all the knowledge being obtained, you can practice different entry techniques. You can try trading candlesticks patterns or price action patterns, or simply key levels. Search what works for you.
✔️Week 8 - Learn risk management.
Of course, entry strategies are not enough for profitable trading. Learn how to set stop loss and how to manage your risks properly.
By the end of the second month, you will have a foundation for a strategy building.
✔️Week 9 - Practice trade management.
Knowing how to enter the trade and how to manage the risks, the next step is to learn how to manage the active position (stop loss trailing, position protection, manual closing, etc.)
✔️Week 10 - Create a trading plan.
Combine all the knowledge that you gained in a structured trading plan.
✔️Week 11 - Follow the strategy.
Be disciplined and follow your rules. Test them and learn to be consistent.
✔️Week 12 - Review your plan.
Following your strategy, you will inevitably find its flaws. Learn to constantly improve it.
By the end of the third month, you will have a complete rule-based trading strategy. Of course, that won't be a perfect strategy, but you will have broad knowledge in technical analysis.
The next 3 months alone should be sacrificed on polishing and improvement of your trading plan.
Try this intensive, traders. I strongly believe that you will see a dramatic improvement in your trading upon its completion.
❤️If you have any questions, please, ask me in the comment section.
Please, support my work with like, thank you!❤️

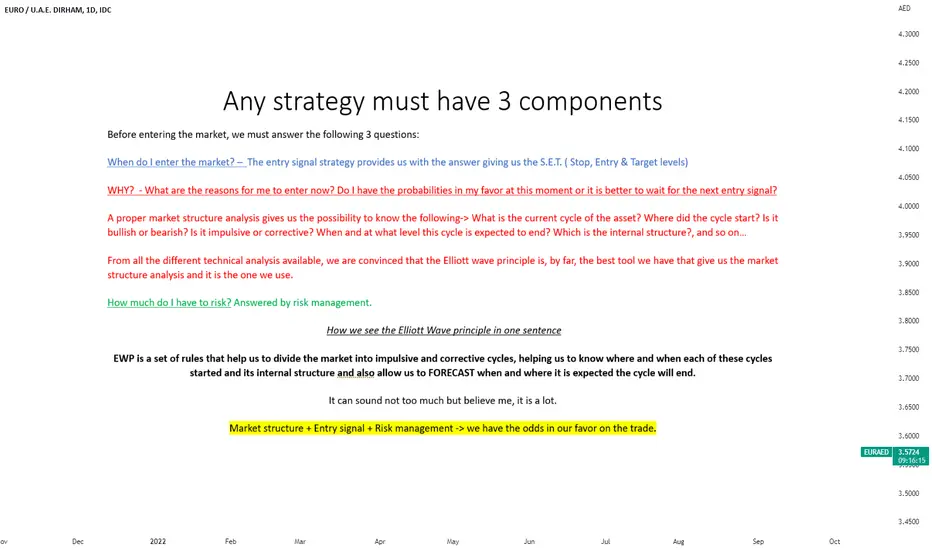
Market Structure: The analysis we use to skip (and we shouldn't)Hi traders, today we want to explain why market structure analysis is as important as a good entry signal strategy.
Note: For this article, we differentiate the entry signal from the market structure analysis. In some cases, the entry signal considers also the market structure but in these cases, we could easily split the set of rules into rules to define the market structure, and the rules to enter the market (entry signal). So we will consider it as two steps or phases.
One of the most common mistakes (which I did a lot in my trading early years) is that traders tend to focus on finding the best entry signal, the SL level, and the target, which is great but is only half of the work.
Only with this part and with proper risk management, you can be profitable. However, this is only the mechanical part of the trading strategy which, in most cases and especially if the entry signal is based on indicators, could perfectly be automated as these are only a set of rules (based on indicators or other technical analysis tools) that trigger the entry signal.
What it is as important as the SET (Stop, Entry & Target) is the analysis of the market structure of each asset. By that we mean that we should know:
- What is the current cycle of the asset? Where did the cycle start?
- Is it bullish or bearish?
- Is it impulsive or corrective?
- When and at what level this cycle is expected to end?
- Which structure this cycle has?
- and so on…
This is the part that was tougher for me to learn, and it is the part that requires more time and experience. Detect the subtle difference that very similar market structures can have and differentiating them will take you time. Do not misunderstand me, it is not rocket science, but it can be tricky.
The market does not use to move on perfect defined structures we can easily identify, most of the time it can be difficult to detect these structures.
We use the Elliot Wave principle mainly (but not only) to help us “find” the right market structure of each asset.
How we see the Elliott Wave principle (EWP) in one sentence would be:
It is a set of rules that help us to divide the market in impulse and corrections to know where and when each of these cycles has started and also to forecast when AND WHERE it is expected the cycle will end. It can sound not too much but believe me it is a lot.
Even though the Elliot Wave principle (EWP) rules are perfectly defined, to apply them on the chart would be not 100% objective and, therefore, the same rules can be applied differently by each trader on the chart. This is why it takes more time to identify the right way to interpret and apply the EWP rules to the chart and this is the reason why it is the part that used to take more time for the trader to be proficient in.
We see and use the EWP as a guideline or a map structure of the asset we are analyzing, (VERY IMPORTANT) we do not use EWP alone to enter the trade. We use it to know the structure of the asset and to infer the most probable direction that the price will take in the future. With EWP as the base of our trading strategy, we will use other analysis tools like the correlation between the different asset groups or the market dynamics to refine the assets that give us the maximum options of having a winning trade (after applying the entry signal strategy).
Another very important point we want to make clear from the beginning is that we should be flexible in our predictions. We do have a clear view of the structure that we think the market is having at this moment for each asset. However, we need to be prepared to be wrong, by that we mean that we need to know and be aware of what are (if any) the other potential structure the cycle we are analyzing can have. This is why we will not enter a trade based on the wave count only and we need the other tools we mentioned before.
Therefore, and to wrap it up for this lesson, EWP gives us a lot of crucial information that is the base of all our trading strategies. To summarize it and make clear how we use the EWP, we use EWP to:
- Know the Right side of the market for each asset (Long or Short)
- Detect whether the asset is in an impulsive or on a corrective cycle and its internal structure
- Project the zone where the asset is expected to end the correction (to apply there the entry signal strategy)
- Project the level where the impulse wave is expected to end (which would be different depending on the wave we are in) (Target)
All these will help us to find zones where we can apply our S.E.T. (Stop-Entry-Target) rules to maximize the overall return of our strategy as it will increase a lot our Winning percentage.
Have an amazing and successful trading day
TRS team
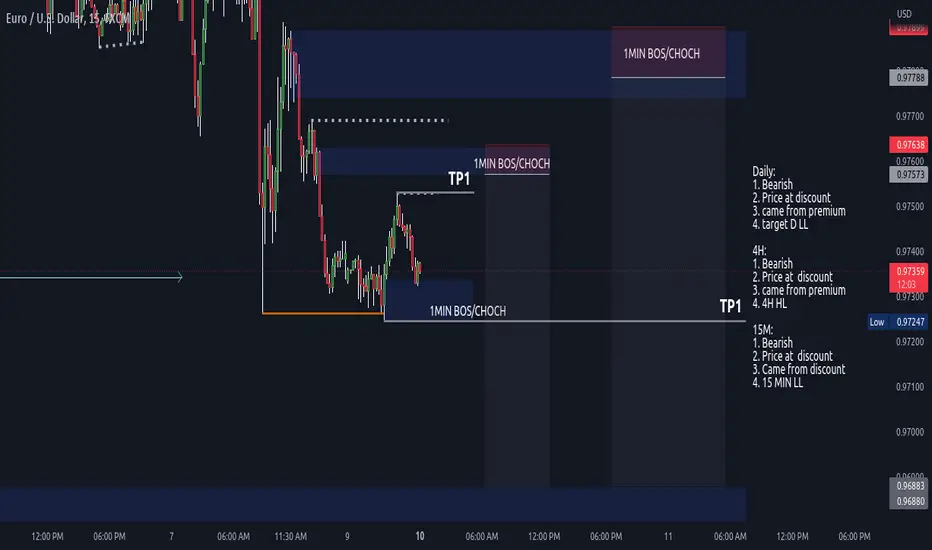
EURUSD Daily:
1. Bearish
2. Price at discount
3. came from premium
4. target D LL
4H:
1. Bearish
2. Price at discount
3. came from premium
4. 4H HL
15M:
1. Bearish
2. Price at discount
3. Came from discount
4. 15 MIN LL
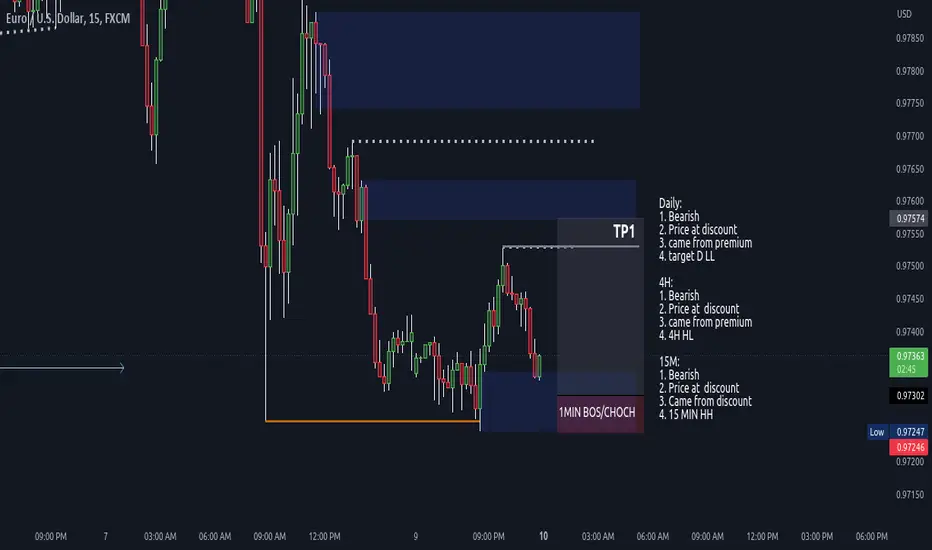
EURUSD SHORT TERM BUYDaily:
1. Bearish
2. Price at discount
3. came from premium
4. target D LL
4H:
1. Bearish
2. Price at discount
3. came from premium
4. 4H HL
15M:
1. Bearish
2. Price at discount
3. Came from discount
4. 15 MIN HH
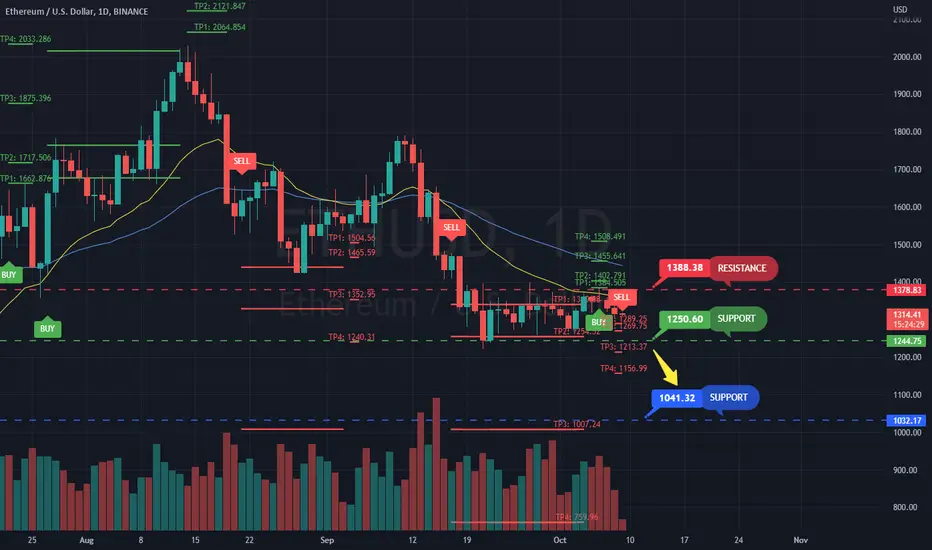
ETHUSD - DOWNTREND REJECT EMA20 ETH is failing to break EMA20 line 3 times, it is possible correction, selling momentum persist and heading down to test support level 1250, and if it fails to hold at that level it will further fall to 1050 support level. VP ALGO indicator has given SELL signal.

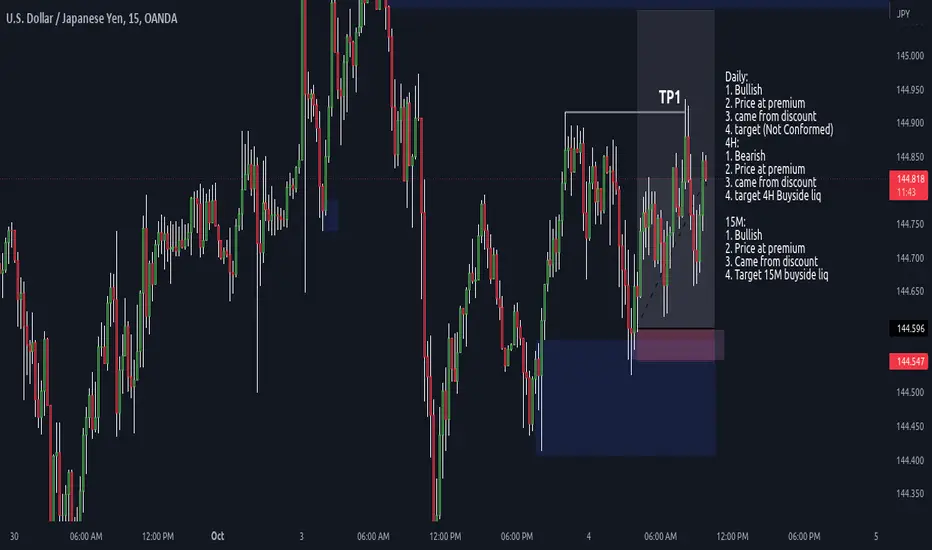
USDJPYcouldn't took this trade because of sleep, and when i wokeup and saw this.
Daily:
1. Bullish
2. Price at premium
3. came from discount
4. target (Not Conformed)
4H:
1. Bearish
2. Price at premium
3. came from discount
4. target 4H Buyside liq
15M:
1. Bullish
2. Price at premium
3. Came from discount
4. Target 15M buyside liq
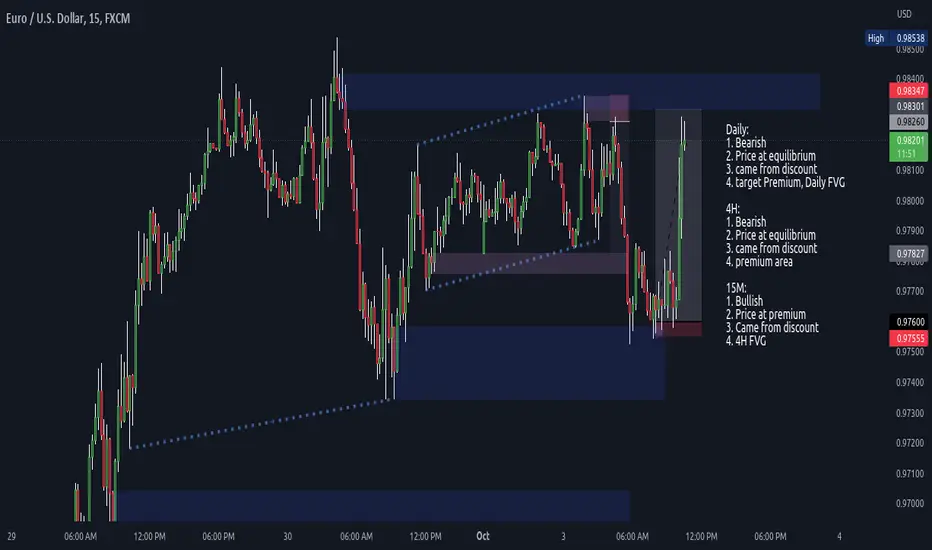
EURUSDDaily:
1. Bearish
2. Price at equilibrium
3. came from discount
4. target Premium, Daily FVG
4H:
1. Bearish
2. Price at equilibrium
3. came from discount
4. premium area
15M:
1. Bullish
2. Price at premium
3. Came from discount
4. 4H FVG
Couldn't took these trades as of i was not on the charts. But the good thing is the direction was right
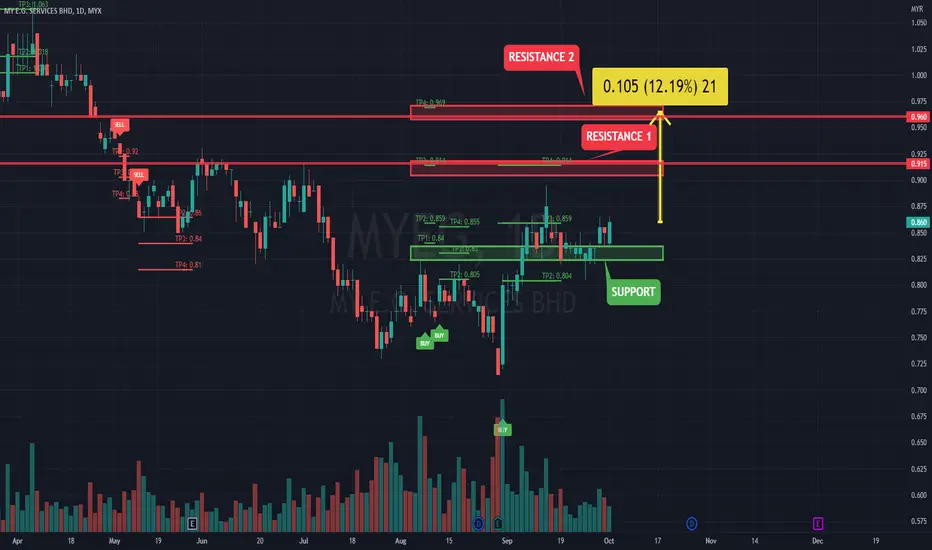
MYEG: POTENTIAL UPWARD PROFIT 12%MYEG is forming a nice HH and HL and finding support level at 0.83, however volume is still low, if next bar show better volume can potential for an upward breakout to reach 1st resistance level at 0.91 and 2nd resistance level at 0.96.
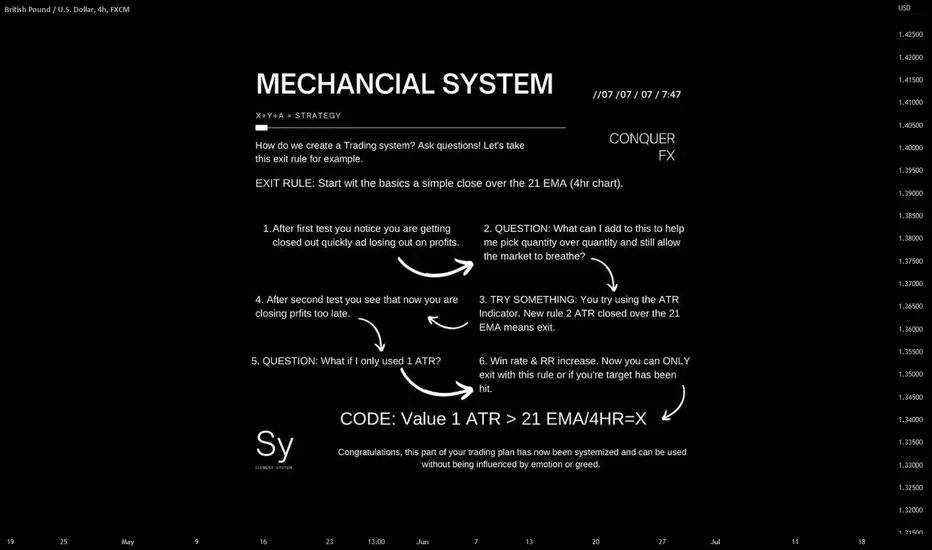
How to build a Mechanical Trading strategy? Building a mechanical strategy is usually overcomplicated. As long as your system contains simple but well defined and detailed rules it allows the strategy and the trader to execute with as little friction as possible. Take a look at the example included in the photo as we diagnose problems and optimze the trading plan to it's full potential.
BTCUSD - DOWN TO TEST 16700 & SIDEWAYSBTCUSD will test support level 17500 and move sideways in months to come until there is a clear signal for pivot and breaks 25000 level.

NIKE: Continuation of Bearish Movement Ahead, Short Opportunity?Hello Fellow Global Stock Investor/Trader, Here's a Technical outlook of NIKE!
NIKE has broken out of Ascending Broadening Wedge. Furthermore, The MACD indicator created a Death cross, indicating potential bearish movement ahead.
All other explanations are presented on the chart.
The roadmap will be invalid after reaching the target/Resistance area.
"Disclaimer: The outlook is only for educational purposes, not a recommendation to put a long or short position on the Stock"

NZDJPY: Your Detailed Trading Plan 🇳🇿🇯🇵
NZDJPY is stuck on a key horizontal structure resistance.
To catch a bearish move from that, watch 81.7 - 81.9 area.
It is a horizontal neckline of a double top pattern.
To sell with a confirmation, we need an hourly candle close below the neckline to confirm a breakout.
Then shorting on a retest, our target will be 80.7
Remember, that the price may respect a neckline. If the pair sets a new high, the setup will be invalid.
❤️If you have any questions, please, ask me in the comment section.
Please, support my work with like, thank you!❤️

S&P: No Bottom Yet - To Test SupportS&P still IN downtrend and have not found bottom yet, to test support at 3600 level before it rise to test resistance at 3900.
Disclaimer
This information only serves as reference information and does not constitute a buy or sell call. Conduct your own research and assessment before deciding to buy or sell any stock.

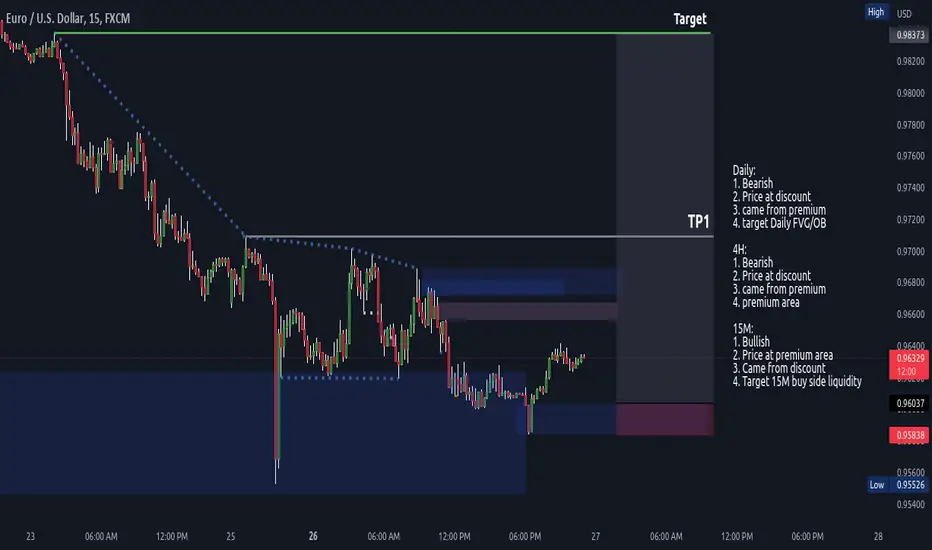
EURUSDDaily:
1. Bearish
2. Price at discount
3. came from premium
4. target Daily FVG/OB
4H:
1. Bearish
2. Price at discount
3. came from premium
4. premium area
15M:
1. Bullish
2. Price at premium area
3. Came from discount
4. Target 15M buy side liquidity
Note: Need 1MIN BOS/CHOCH before entering the trade.