BTC thesis with RAG AI by Titan_KarmaThe current market conditions for Bitcoin (BTC) present a compelling case for entering a long position, especially given the absence of open positions at this time. Recent bullish trends, including Bitcoin's approach to the $100K milestone and a significant increase in hashrate, indicate a strong upward momentum. Additionally, the growing institutional interest in Bitcoin, evidenced by its innovative applications in traditional financing, suggests that BTC is gaining traction across various sectors. As we assess the market over the next four hours, it is crucial to monitor technical indicators and market sentiment closely to identify optimal entry points.
From a financial perspective, BTCUSDT is currently trading at $97,501.40, with a trading volume of 28,787.55. The mixed long-short ratios among traders indicate a cautious sentiment, suggesting that while some traders are bullish, others are hedging against potential downturns. This mixed sentiment reinforces the need for a careful approach, particularly as the market may experience volatility. Setting stop-loss orders is advisable to protect against potential downturns, especially if the price approaches critical resistance levels.
Technical analysis reveals a high daily RSI of 79.29, indicating that BTC may be overbought, which could lead to a price correction. However, the 1-hour and 15-minute charts show lower RSI values (45.73 and 36.09, respectively), suggesting potential for short-term recovery. Resistance levels are identified at $98,924.61 and $100,321.24, while support levels are at $96,626.73 and $95,725.48. Monitoring these levels will be essential for making informed trading decisions.
Historically, BTC has shown strong upward trends, with significant price increases observed over the past few days. The latest data indicates a high of $98,988.00 on November 21, 2024, followed by a slight pullback. Given the overall bullish sentiment and recent price action, entering a long position appears favorable, particularly if the price holds above the support level around $97,000. Volume trends will also provide further confirmation of the strength of this upward movement.
In terms of risk management, it is essential to set appropriate stop-loss orders based on historical performance and volatility. The recent trades indicate that confidence levels of 85% and 87% have previously resulted in no profit trades, necessitating a reassessment of confidence scoring. Implementing a mechanism to penalize no-profit trades will help refine future trade recommendations and improve overall profitability.
In conclusion, the current market conditions for Bitcoin suggest a favorable environment for entering a long position. By closely monitoring technical indicators, market sentiment, and historical performance, traders can make informed decisions to capitalize on potential price movements.
TRADE RECOMMENDATION
json { "OUTCOME": "OPEN_LONG", "STOP_LOSS": "$96,626.73", "TAKE_PROFIT": "$100,321.24", "CONFIDENCE_LEVEL": "80%", "EXIT_POINT": "$98,924.61", "ENTRY_CRITERIA": { "TIMEFRAME": "1h", "RSI": "below 70", "MACD": "above 0, 15m" }, "CURRENT_OPEN_LONG_POSITIONS": 0, "CURRENT_OPEN_SHORT_POSITIONS": 0 }
Tradingstrategies
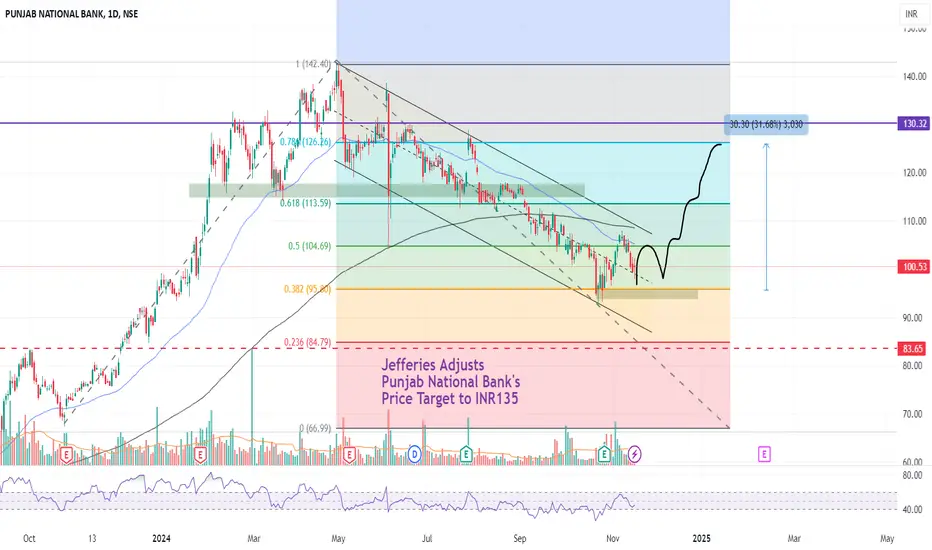
Punjab National Bank (PNB) Technical Outlook📌 Current Price: ₹100.53 (+1.05%)
📌 Sector: Banking
📌 Timeframe: Daily
Key Observations:
1.Descending Channel:
PNB has been trading in a well-defined descending channel since its peak of ₹142.40. The current trend remains bearish, with lower highs and lower lows.
2.Fibonacci Retracement:
Major Levels:
0.618 (₹113.59) : Key resistance.
0.5 (₹104.69): Immediate resistance.
0.382 (₹95.80): Current support.
0.236 (₹84.79): Next critical support if the stock breaches ₹95.80.
3.Support and Resistance Levels:
Support: ₹95.80 (holding strong for now).
Resistance: ₹104.69, followed by ₹113.59.
4.Volume Analysis:
Declining volume suggests indecision among traders, indicating a potential consolidation phase.
5.RSI (Relative Strength Index):
RSI shows the stock is moving out of oversold territory, which could trigger a short-term bounce.
Jefferies Target 🎯:
Revised Target: ₹135
This aligns with the 0.786 Fibonacci level (₹126.26) , a crucial point where PNB would need to break out of the descending channel and confirm a trend reversal.
Potential Scenarios:
Bullish Case:
Bounce from ₹95.80 and breakout above ₹104.69.
Sustained buying could push the stock to ₹113.59 and eventually to ₹126.
Bearish Case:
A breakdown below ₹95.80 could lead to a retest of ₹84.79.
Failure to hold ₹84.79 might push the stock to its next support zone around ₹80.
Trading Strategy:
1.Short-Term Traders:
Watch for a breakout above ₹104.69 for a quick target of ₹113.59.
Stop-loss: ₹95.
2.Long-Term Investors:
Accumulate near ₹95.80 or ₹84.79, keeping ₹80 as a long-term stop-loss.
Final Thoughts:
The stock's long-term prospects remain aligned with its sector growth and broader market recovery. A breakout from the descending channel could attract significant buying interest, aligning with Jefferies' bullish target of ₹135.
Waiting for market structure to become more obvious Hello friends, hope you are well
On the higher time frames, there seems to be a little work that needs to be done
On the lower timeframes we are DOMINATING
If you'd like to be a front runner, speak to me and lets do this!
#MarketDomination
#TradingSuccess
#TimeframeAnalysis
#TradeSmart
#FrontRunner
#MarketOpportunities
#CryptoJourney
#WinningTrades
#HigherTimeframes
#LowerTimeframes
#TradingStrategies
#ProfitPursuit
#FinancialFreedom
#MarketMoves
#TradeWithConfidence
#UnlockSuccess
#TraderLife
#CrushTheMarket
#LetsDoThis
#DominateTheCharts

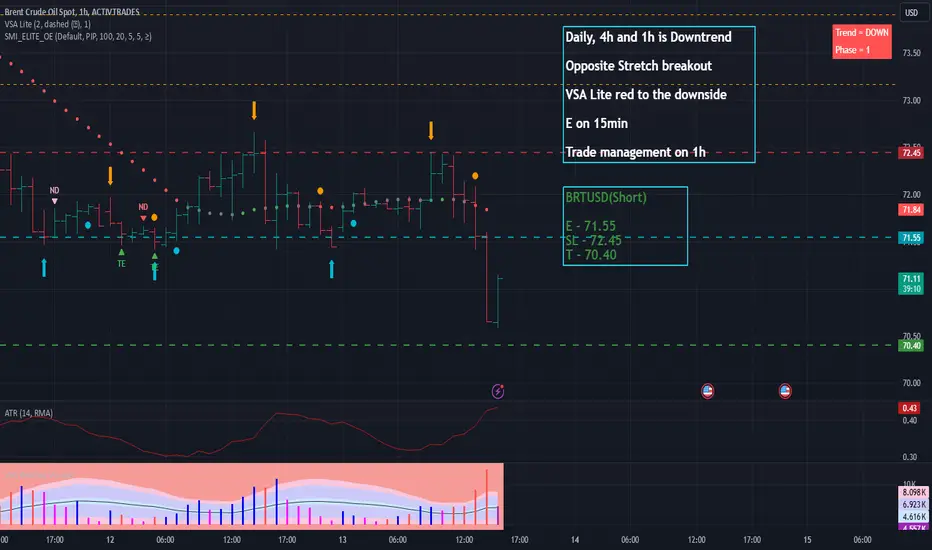
Potential trade setup on BRTUSDWe are looking at a short trade on BRTUSD based on the stretch strategy. There is trend and direction alignment with this trade. Trade has taken out the upper stretch but higher timeframes trend and direction is to the downside. We will take the trade with a higher probability towards opposite stretch level being taken out. We will exit the trade once range has been achieved.
Trader Order Details:
BRTUSD(Short)
E - 71.55
SL - 72.43
T - 70.40
We will be tracking this move and updating the post as we go along on the charts and on video. Keep a look out for it traders.
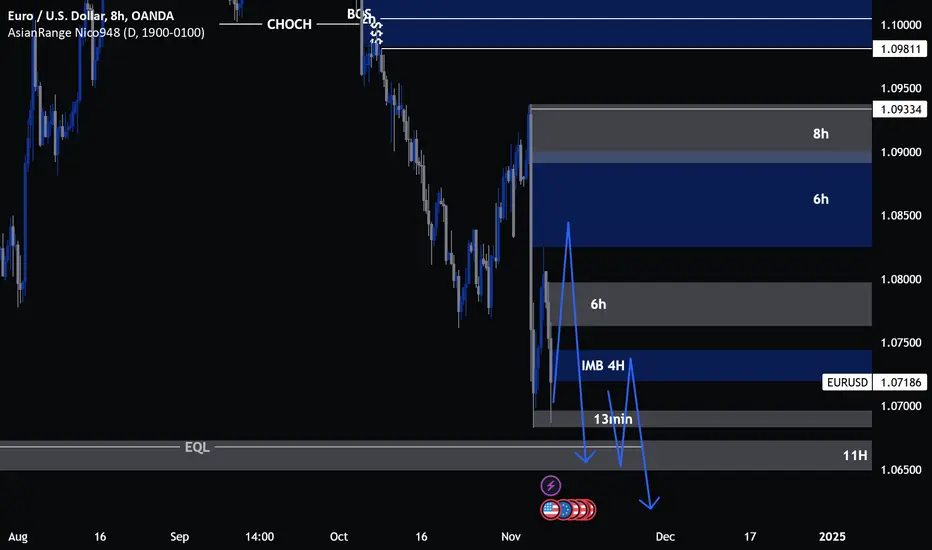
EUR/USD Crash????We can a clear downtrend forming with pairs like the euro and the pound that go against the dollar. The Euro has shown clear signs of bearish downfall through the vast number of bos to the downside and the vast amount of liquidity below that needs to be taken.
In the first scenario we see the possibility that price may move up to fill the IMB taking out any early sellers before continuing in the downtrend targeting the EQL liquidity below.
In the second scenario which I believe to be more likely, we see the Euro drop taking out the EQL liquidity before having enough momentum to retrace into 4H IMB or fill the IMB and push up towards the 6H supply and then crash at least until the bullish momentum on the dollar dies down and markets begin to form clean market structure rather than such euphoric price action
What October 25th's Options Portfolio Tells Us About the YenOur analysis of options portfolios from October 25th revealed a Straddle setup on the Japanese yen futures, with a short expiration date set for November 1, 2024. Now, this isn’t exactly a rare sight for the yen; these Straddle portfolios pop up pretty regularly, especially when we’re looking at short expiration periods.
From what we've seen, in about 4 out of 5 cases, the quotes tend to hang around the Straddle boundaries and often bounce off them. A recent example? August 5th—prices hit the upper limit at 149.20 (that’s the spot quote) and then bounced back nicely, giving savvy traders a sweet opportunity to jump into a short position on the dollar with a solid risk/reward ratio.
So, what's the takeaway here? Use those Straddle boundaries to open positions in the spot/forex market. It makes sense to trade in the direction of the main trend, which means looking for a drop in the yen against the dollar when prices hit that upper boundary—check out #1 for a visual.
Now, I can hear the skeptics asking: what's the rationale behind these price movements at the Straddle boundaries? After all, a Straddle is just a straightforward strategy that involves buying volatility and betting on price movement. True, that’s the textbook definition, but it’s just scratching the surface. The real insights and "battle-tested applications" of this strategy are way more intricate than they seem.
Stay tuned for our updates, and you’ll definitely uncover the hidden meanings and value of options analysis for the everyday forex trader. Trust me, these insights can give you a real edge in the market. It’s worth your time and effort!

Adani Power at SupportThe strongest Adani Group company with sound financials and comfortably manageable debt along with sound current ratio.
Stock P/E - 14.8
ROCE 5Yr - 16.6 %
ROE 5Yr - 39.2 %
Debt to equity - 0.80
Current ratio - 1.60
The technical chart pattern suggest an entry.
Note: The idea is intended to spread awareness regarding the ratios that you should consider before investing and the chart reading done.
Any financial commitment will solely be your risk and should be done after thorough research.

Top 11 Popular and Effective Crypto Trading Strategies for BeginTop 11 Popular and Effective Crypto Trading Strategies for Beginners
Cryptocurrency trading can be a lucrative but volatile venture, especially for beginners. To navigate the highs and lows of the market successfully, it's important to adopt well-tested strategies that help manage risk and improve your chances of success. Whether you’re looking to trade actively or passively, this list of the top 11 crypto trading strategies will guide you in the right direction.
1. HODLing (Buy and Hold)
HODLing is a term derived from a misspelled "hold" in a Bitcoin forum that became iconic. This long-term strategy involves buying and holding onto cryptocurrencies for an extended period, regardless of short-term market fluctuations. It's popular among beginners due to its simplicity.
Best For: New traders who believe in the long-term potential of assets like Bitcoin and Ethereum.
Pros: Easy to implement, less stressful, low maintenance.
Cons: Requires patience, may result in short-term losses.
2. Dollar-Cost Averaging (DCA)
Dollar-Cost Averaging (DCA) is a straightforward strategy where you invest a fixed amount of money into a cryptocurrency at regular intervals, regardless of its price. By spreading out your investments over time, you reduce the impact of market volatility.
Best For: Beginners who want to invest consistently without timing the market.
Pros: Minimizes the risk of investing a lump sum during a market peak.
Cons: May miss out on large gains if the market takes off quickly.
3. Day Trading
Day trading involves buying and selling cryptocurrencies within a single trading day. The goal is to capitalize on short-term market movements and make multiple trades throughout the day.
Best For: Active traders who have time to monitor the market closely.
Pros: High profit potential in a short period.
Cons: High risk due to volatility; requires significant time and attention.
4. Swing Trading
Swing trading is a strategy where traders hold onto assets for days, weeks, or even months to take advantage of price "swings" or momentum in the market. It aims to capture medium-term trends rather than short, daily fluctuations.
Best For: Traders who can dedicate time to analyzing market trends but don’t want to trade daily.
Pros: Less stressful than day trading, potential for good profits.
Cons: Markets can move against you quickly, requires technical analysis.
5. Scalping
Scalping is a fast-paced strategy where traders make numerous small trades over short time frames, such as minutes or hours. The goal is to accumulate many small profits that add up over time.
Best For: Experienced traders or beginners who enjoy fast-paced trading.
Pros: Quick profits, low exposure to market risks.
Cons: Requires intense focus, high transaction fees can eat into profits.
6. Arbitrage Trading
Arbitrage trading involves taking advantage of price differences between different exchanges. You buy a cryptocurrency on one exchange where it's priced lower and sell it on another exchange where it's priced higher.
Best For: Traders who are quick to spot price differences across exchanges.
Pros: Low-risk if executed correctly, straightforward profits.
Cons: Requires quick execution and capital in multiple exchanges, fees can reduce profits.
7. Trend Trading
Trend trading, also known as "position trading," is a strategy where you identify the direction of the market trend (either bullish or bearish) and trade in the same direction. Trend traders often use technical indicators to confirm trends and make informed decisions.
Best For: Traders comfortable with technical analysis.
Pros: Can be highly profitable if the trend is strong.
Cons: Trend reversals can lead to losses; requires constant monitoring.
8. Copy Trading
Copy trading allows beginners to mimic the trades of more experienced traders. Many platforms, offer copy trading features where users can follow and replicate the strategies of successful traders automatically.
Best For: Beginners who lack trading experience but want to trade like professionals.
Pros: No need for deep market knowledge; can learn while following experts.
Cons: Performance is tied to the skill of the trader being copied.
9. Moving Average Crossover Strategy
The Moving Average Crossover strategy uses two different moving averages (usually a short-term and long-term average) to identify trends. When the short-term average crosses above the long-term average, it signals a buy. When it crosses below, it signals a sell.
Best For: Beginners who are learning technical analysis.
Pros: Simple and widely used, helps to identify trends.
Cons: May lag behind price movements, leading to late entries or exits.
10. Relative Strength Index (RSI) Strategy
The RSI strategy is based on the Relative Strength Index, a momentum oscillator that measures the speed and change of price movements. RSI values range from 0 to 100, with readings above 70 indicating overbought conditions (potential sell) and readings below 30 indicating oversold conditions (potential buy).
Best For: Traders who prefer using technical indicators.
Pros: Easy to use, widely available on most trading platforms.
Cons: Can generate false signals in volatile markets.
11. Breakout Trading
Breakout trading involves entering the market as soon as a cryptocurrency breaks out of a previously established support or resistance level. Breakouts often signal the start of a new trend, and traders look to capture profits as momentum builds.
Best For: Traders who are comfortable with technical analysis and chart patterns.
Pros: High profit potential if a new trend forms.
Cons: Risk of false breakouts leading to losses.
Conclusion
For beginners stepping into the world of cryptocurrency trading, choosing the right strategy is crucial. Each of the strategies mentioned above caters to different risk tolerances, time commitments, and levels of expertise. Whether you prefer the slow and steady approach of HODLing or the fast-paced world of day trading, it’s essential to thoroughly understand each strategy before applying it in the market. Over time, you can experiment with various approaches and find the one that best suits your trading style and goals.
As always, it’s important to stay informed, manage risks, and continue learning as you navigate the dynamic and exciting world of crypto trading.
Hope you enjoyed the content I created, You can support with your likes and comments this idea so more people can watch!
✅Disclaimer: Please be aware of the risks involved in trading. This idea was made for educational purposes only not for financial Investment Purposes.
---
• Look at my ideas about interesting altcoins in the related section down below ↓
• For more ideas please hit "Like" and "Follow"!

EURUSDWe expect the euro to rise against the dollar after the trend breaks and retests it and we set the goals. Confirm the rise of the euro when the 1.08736 point breaks and then confirm.
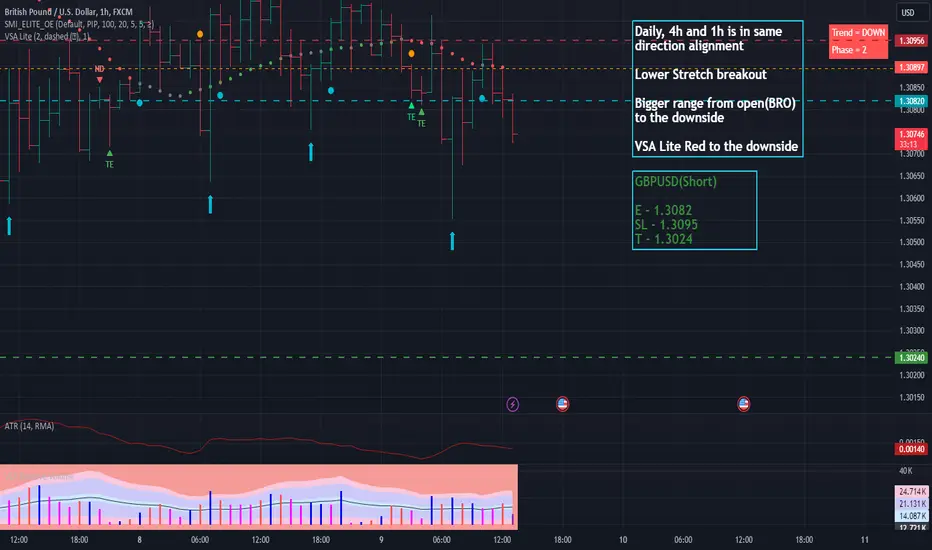
Potential trade setup on GBPUSDWe are looking at a short trade on GBPUSD based on the stretch strategy. There is direction alignment with this trade, though the trend is still uptrend phase 2. Trade has taken out the lower stretch. We will exit the trade once range has been achieved.
Trader Order Details:
GBPUSD(Short)
E - 1.3082
SL - 1.3095
T - 1.3024
We will be tracking this move and updating the post as we go along on the charts and on video. Keep a look out for it traders.
EUR GBPTHIS IS MY SETUP FOR EUR GBP
I use Fibonacci to get these extreme points and my preferred one is 75% retracement, with a risk-reward of 1:3.
Trade carefully
This is not financial advice, DYOR.
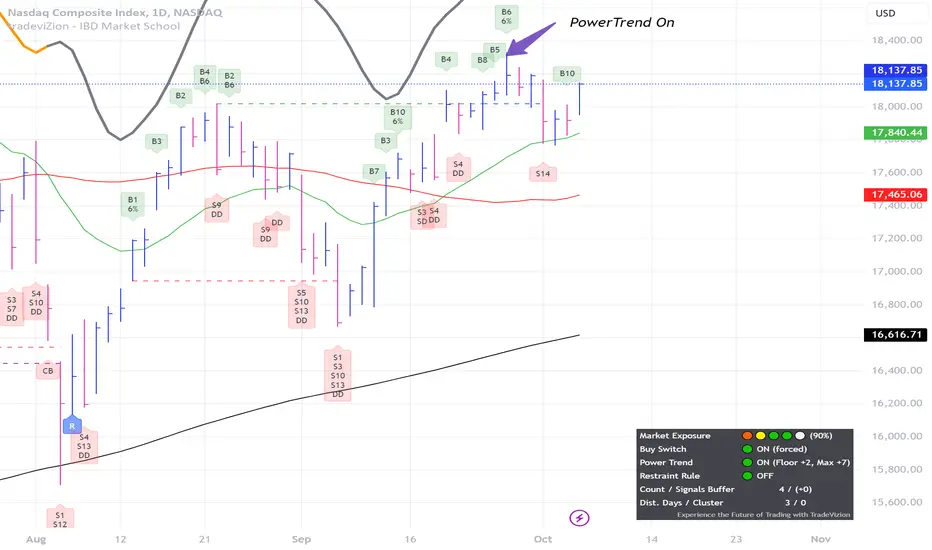
Nasdaq Composite: Market Exposure and Industry InsightsThe Nasdaq Composite is currently in a confirmed uptrend . As of October 4th, there are 3 distribution days , which implies mild pressure in the market, but conditions remain favorable overall. Our market exposure is suggested at 90% , indicating confidence with some caution.
Key Points:
Market Condition:
The Nasdaq's current uptrend is intact, with support holding above the 21-Day Moving Average (DMA) . This level is crucial and should be watched closely in the upcoming sessions for any changes in market sentiment.
Industry Strength:
Technology remains a leader, with notable strength in Software and Semiconductors . Leisure Gaming also shows promise.
On the other hand, sectors like Solar , Specialty Retail , and Auto Manufacturers have underperformed, trading below their 50-DMA and 200-DMA , which suggests ongoing weakness.
Opportunities:
We see actionable opportunities in Software and Networking . Stocks like Arista Networks (ANET) and Apple (AAPL) are showing promising setups, either forming bases or trading near pivot points.
Arista Networks (ANET): ANET has shown consistent strength, breaking past its recent pivot at $364.15. Quarterly earnings have surpassed estimates consistently, with positive growth in gross margin and return on equity. With the RS line rising and price nearing highs, ANET continues to be a leader in the Networking sector, offering an opportunity for potential gains.
Apple Inc. (AAPL): Currently consolidating near the upper pivot range of $233.09. Earnings projections remain positive, with a growth estimate of 12% for the upcoming quarter. The stock is supported well above its 21-DMA, indicating healthy momentum. Market interest remains strong despite mixed earnings surprises in previous quarters, positioning AAPL as a potential breakout candidate.
The key takeaway is to maintain exposure in leading industry groups, focusing on sectors demonstrating strength. Narrow pullbacks are a positive sign for further gains. It’s advisable to avoid exposure to weaker segments that are struggling below key moving averages.
Let us know—do you see strength in the tech sector, or are you focusing on other opportunities?
Disclaimer:
The information provided here is for educational purposes only and should not be construed as financial advice. Trading involves significant risk, and you could lose some or all of your investment. Always do your own research and consult with a professional financial advisor before making any trading decisions. Past performance is not indicative of future results.
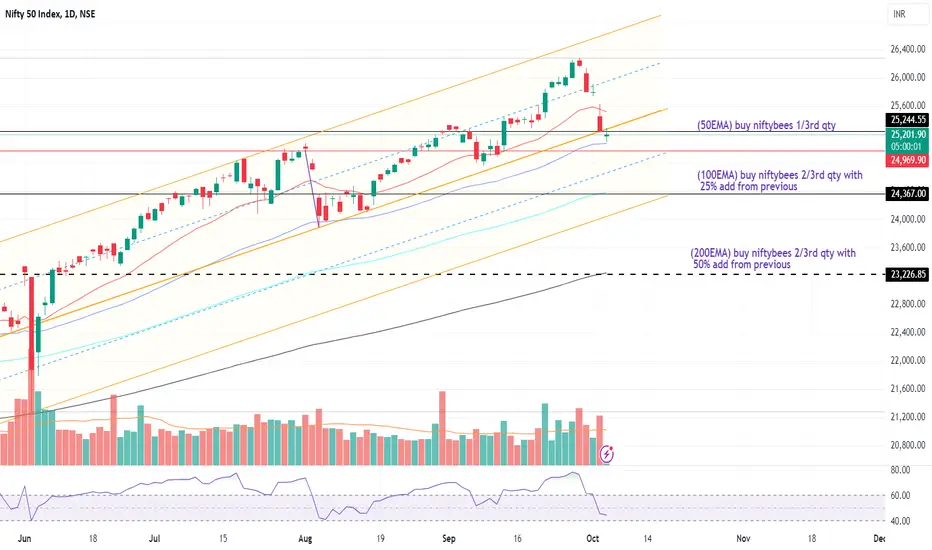
NiftyBees Trading Strategy Using EMA LevelsObjective:
This strategy outlines a simple approach to buying NiftyBees based on 50EMA, 100EMA, and 200EMA levels, and how to gradually increase your position.
Key Steps:
50EMA Buy:
Buy 1/3rd of your total planned investment when the price hits the 50EMA.
Reason: Signals short-term bullish momentum.
Example: If your total budget is ₹90,000, buy ₹30,000 worth at 50EMA.
100EMA Buy:
Buy 2/3rd of your total planned investment at the 100EMA.
Add 25% to your previous 50EMA position.
Reason: Shows stronger medium-term momentum.
Example: Buy ₹40,000 at 100EMA and add ₹10,000 (25% more from 50EMA purchase).
200EMA Buy:
Buy 2/3rd of your total planned investment at the 200EMA.
Add 50% to your previous 100EMA position.
Reason: Indicates potential long-term reversal.
Example: Buy ₹60,000 at 200EMA and add ₹20,000 (50% more from 100EMA purchase).
Conclusion:
This strategy helps you build your position in stages, reducing risk and improving your average price over time. It uses key EMA levels to guide when and how much to invest, helping you benefit from market dips while maintaining a disciplined approach.
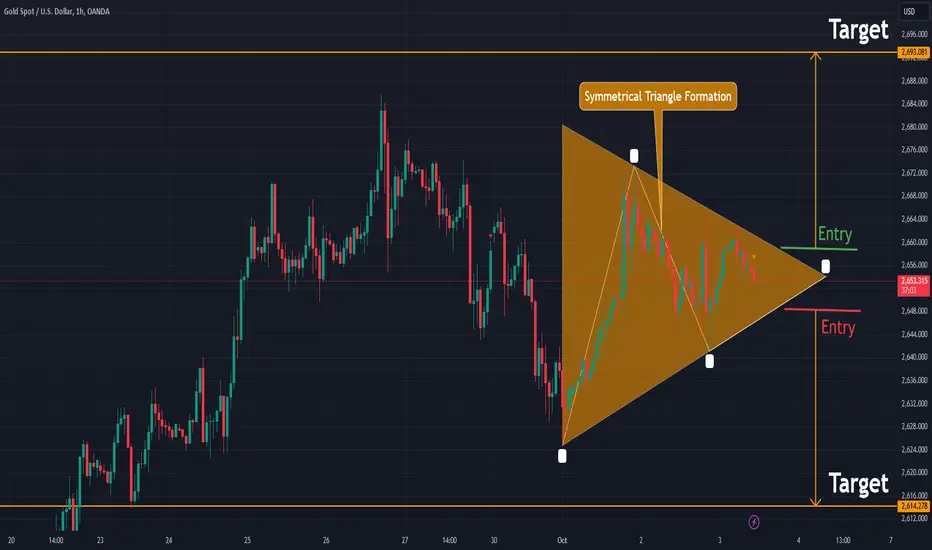
Gold Price Analysis: Symmetrical Triangle Formation Signals $$##📈 Gold Price Analysis: Symmetrical Triangle Formation Signals Potential Breakout
Gold trades within a symmetrical triangle formation on the H1 timeframe, and traders are closely monitoring for a potential breakout. This technical pattern, known for its converging trendlines, often signals an impending price breakout, either upward or downward. Here's what to watch for:
🔺 What is a Symmetrical Triangle?
A symmetrical triangle is a continuation pattern in which the price forms lower highs and higher lows , creating two converging trendlines 📊. The market's indecision builds tension, often leading to a significant breakout in either direction as the price consolidates.
🚀 Key Breakout Levels for Gold
As gold continues to move within this symmetrical triangle, there are two potential breakout scenarios:
📈 Upside Breakout Target – $2,693:
If gold breaks out above the upper trendline of the symmetrical triangle, we can expect bullish momentum to push the price toward the $2,693 level. This would indicate a continuation of the upward trend, attracting buyers and potentially setting the stage for further gains.
📉 Downside Breakout Target – $2,614:
On the other hand, a break below the lower trendline would signal a bearish move, with the next potential target around $2,614 . This downside breakout would indicate a reversal or pause in the recent bullish trend, likely driving selling pressure.
🔍 Factors to Watch
Several factors may influence gold’s price action and the potential breakout direction:
🌍 Geopolitical tensions and market uncertainty drive safe-haven gold demand, potentially pushing prices higher.
💵 US Dollar strength: A stronger dollar could weigh on gold, increasing the likelihood of a downside breakout.
📉 Interest rates and inflation expectations also play a role, as rising rates could limit gold’s appeal as a non-yielding asset.
🛠 Trading Strategy
Traders should consider waiting for a clear breakout above or below the symmetrical triangle before entering a position. A decisive move beyond these key levels— $2,693 for an upside breakout or $2,614 for a downside breakout—could offer strong trading opportunities with defined risk levels.
💡 Conclusion
The symmetrical triangle formation on the H1 timeframe indicates that gold is on the verge of a significant move. Monitoring key breakout levels, market sentiment, and external factors like the dollar and interest rates will be crucial in navigating this potential opportunity. Whether gold breaks out to the upside or downside, traders should be prepared for a substantial price move towards $2,693 or $2,614.
🔔 Stay updated with the latest prices and market developments to capitalize on this technical pattern.
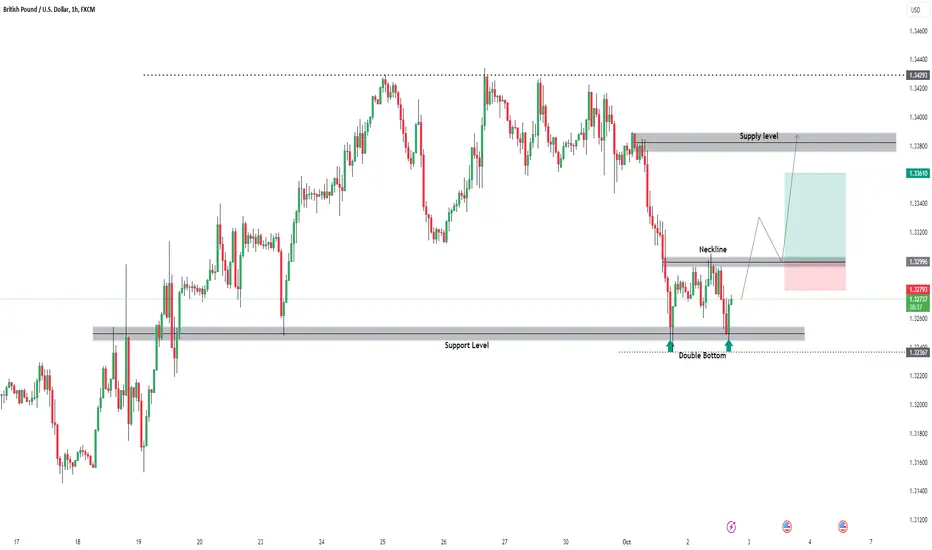
GBP USD Trade Setup 1-Hour TimeframeOn the 1 hour timeframe, GBP USD has formed a Double Bottom at the Daily + 4 Hour support level.
For a more conservative entry, we need to wait for a breakout of the neckline, followed by a retest.
We’ll then look for candlestick confirmations at the retest level before entering a buy position.
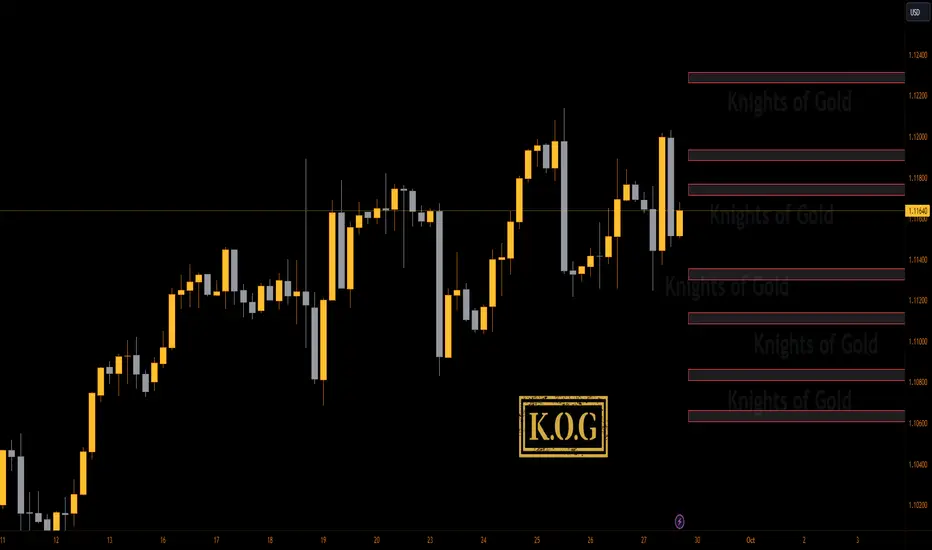
KOG's RED BOXES - GBPUSD
GBPUSD – 4H
1.3144 break above for 1.35080
1.33263 break below for 1.32153
Have a look at the previous pinned posts on Red boxes to familiarise yourself with how they are so effective in keeping traders the right side of the markets.
Please do support us by hitting the like button, leaving a comment, and giving us a follow. We’ve been doing this for a long time now providing traders with in-depth free analysis on Gold, so your likes and comments are very much appreciated.
As always, trade safe.
KOG

KOG's RED BOXES - EURUSD EURUSD – 4H
1.1182 break above for 1.12265
1.11360 break below for 1.1061
Have a look at the previous pinned posts on Red boxes to familiarise yourself with how they are so effective in keeping traders the right side of the markets.
Please do support us by hitting the like button, leaving a comment, and giving us a follow. We’ve been doing this for a long time now providing traders with in-depth free analysis on Gold, so your likes and comments are very much appreciated.
As always, trade safe.
KOG
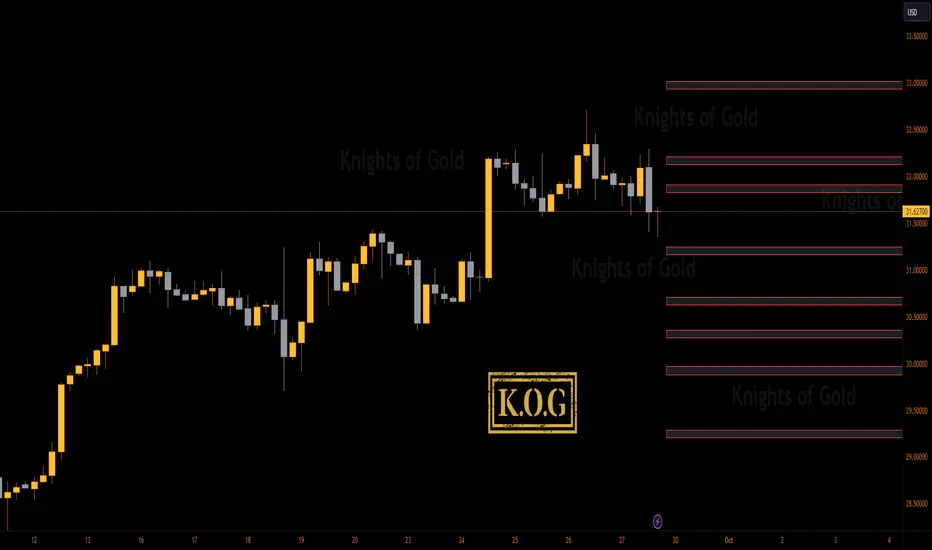
KOG's RED BOXES - SILVERSILVER – 4H
31.88 break above for 32.22 / 32.58 / 33.00
31.19 break below for 30.99 / 30.71 / 30.38
Please do support us by hitting the like button, leaving a comment, and giving us a follow. We’ve been doing this for a long time now providing traders with in-depth free analysis on Gold, so your likes and comments are very much appreciated.
As always, trade safe.
KOG
BITCOIN PRICE ANALYSIS FOR RETAIL INVESTOREntry price and Target already marked in the chart itself FYI.
Stoploss as per your risk mgmt
Guys pls like, share and follow my ideas .
Thank You All

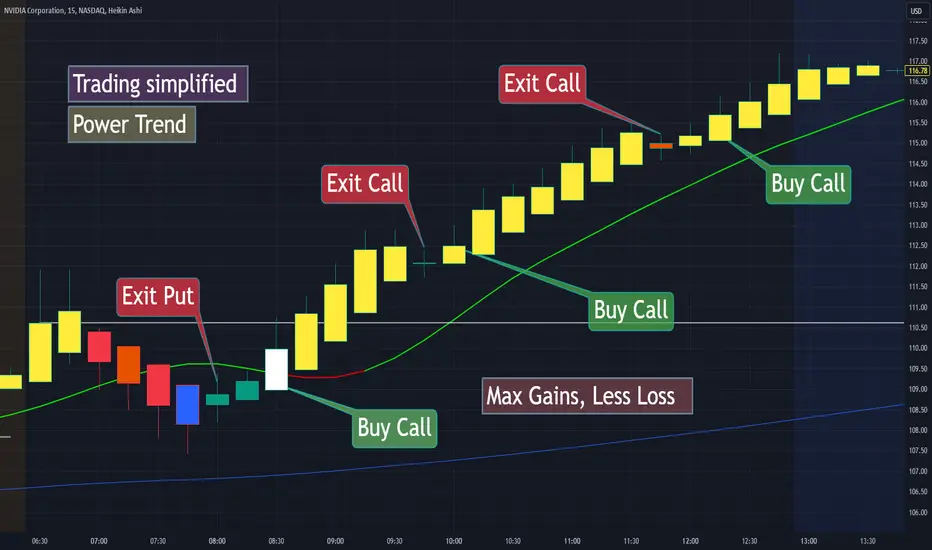
Simplified Options Trading Strategy of Power Trend and HeikinAshHey Traders,
If you're looking for a simple yet effective options trading strategy, this one's for you. Let’s break down how to use Heikin Ashi candles combined with moving averages to identify clear trends and maximize profits while minimizing losses.
Why Heikin Ashi?
Heikin Ashi candles are great for filtering out the noise and helping you focus on the bigger picture. They smooth out the price action so you can see whether the market is trending up or down without getting caught in false signals.
Yellow Candles = Bullish Trend: When these appear, it’s a sign that the market is gaining momentum.
Red Candles = Bearish Trend: Red candles indicate the market is losing steam and a potential downtrend.
The Power Trend Setup
This strategy revolves around following the trend using two simple moving averages:
Green Line: Shorter-term moving average (reacts quickly to price changes).
Blue Line: Longer-term moving average (gives you the bigger trend picture).
When to Buy and Exit Calls
Buy Call: When the Heikin Ashi candles turn yellow, and the price crosses above the green moving average, you can enter a call option. This is your signal that the bulls are in control.
Exit Call: When the trend starts to show signs of weakness or the candles start losing momentum, you exit your call option and lock in those gains. This helps avoid holding through a potential reversal.
When to Exit Puts
Exit Put: If you were in a put option during a downtrend (indicated by red candles), you’d want to exit once you see a reversal forming and yellow candles appear. This prevents you from holding through a bullish reversal and losing your profits.
Max Gains, Less Loss
The beauty of this setup is its simplicity: maximize your gains when the trend is strong, and minimize your losses by getting out at the right time. You’re always following the flow of the market, entering and exiting at points that are more likely to bring profits.
Final Thoughts
By sticking to this straightforward approach, you can avoid emotional decision-making and ride the trend with confidence. Whether you’re trading options or just looking for better entries and exits in your stock trades, the Power Trend strategy is all about keeping it simple and staying on the right side of the market.
Let me know in the comments — do you use Heikin Ashi candles or a similar trend-following strategy in your trading? Would love to hear your thoughts!
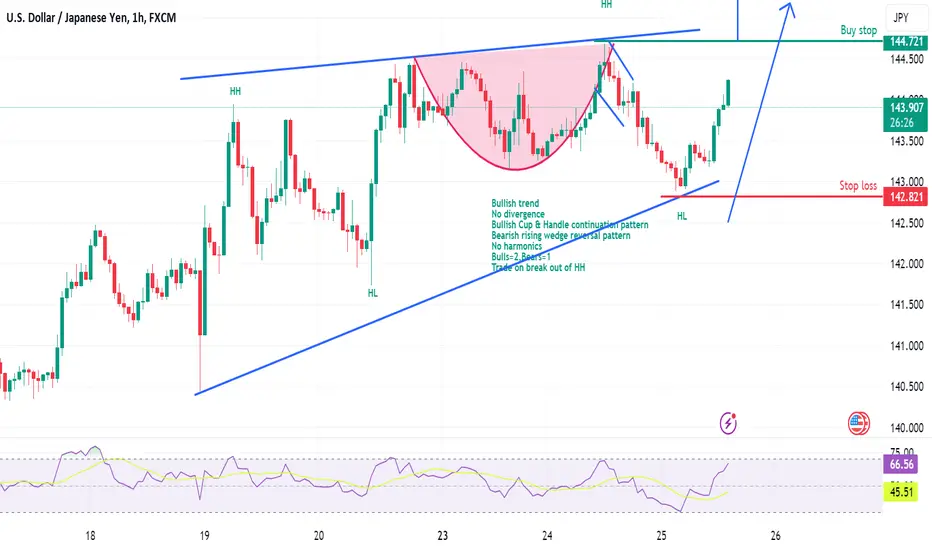
Anticipating tradesApplying following trade strategy:-
Bullish trend
No divergence
Bullish Cup & Handle continuation pattern
Bearish rising wedge reversal pattern
No harmonics
Bulls=2,Bears=1
Trade on break out of HH
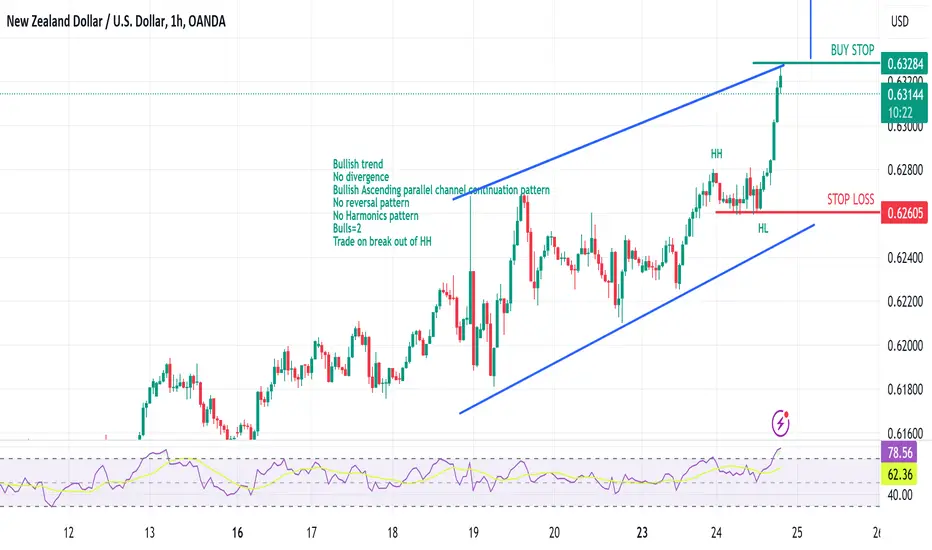
Anticipating tradingApplying following trading strategy:-
Bullish trend
No divergence
Bullish Ascending parallel channel continuation pattern
No reversal pattern
No Harmonics pattern
Bulls=2
Trade on break out of HH
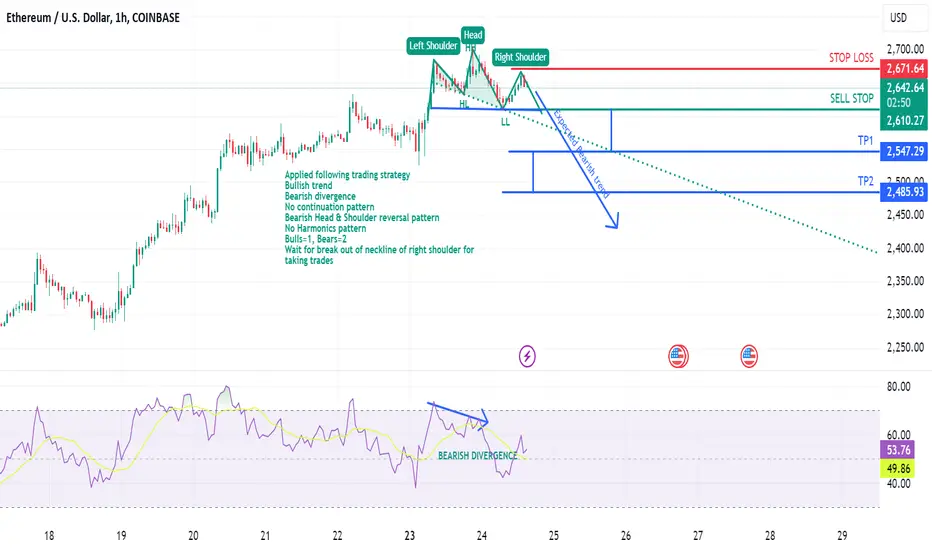
Anticipating trades through trading strategyApplied following trading strategy
Bullish trend
Bearish divergence
No continuation pattern
Bearish Head & Shoulder reversal pattern
No Harmonics pattern
Bulls=1, Bears=2
Wait for break out of neckline of right shoulder for taking trades