Trading as a Probabilistic ProcessTrading as a Probabilistic Process
As mentioned in the previous post , involvement in the market occurs for a wide range of reasons, which creates structural disorder. As a result, trading must be approached with the understanding that outcomes are variable. While a setup may reach a predefined target, it may also result in partial continuation, overextension, no follow-through, or immediate reversal. We trade based on known variables and informed expectations, but the outcome may still fall outside them.
Therefore each individual trade should be viewed as a random outcome. A valid setup could lose; an invalid one could win. It is possible to follow every rule and still take a loss. It is equally possible to break all rules and still see profits. These inconsistencies can cluster into streaks, several wins or losses in a row, without indicating anything about the applied system.
To navigate this, traders should think in terms of sample size. A single trade provides limited insight, relevant information only emerges over a sequence of outcomes. Probabilistic trading means acting on repeatable conditions that show positive expectancy over time, while accepting that the result of any individual trade is unknowable.
Expected Value
Expected value is a formula to measure the long-term performance of a trading system. It represents the average outcome per trade over time, factoring in both wins and losses:
Expected Value = (Win Rate × Average Win) – (Loss Rate × Average Loss)
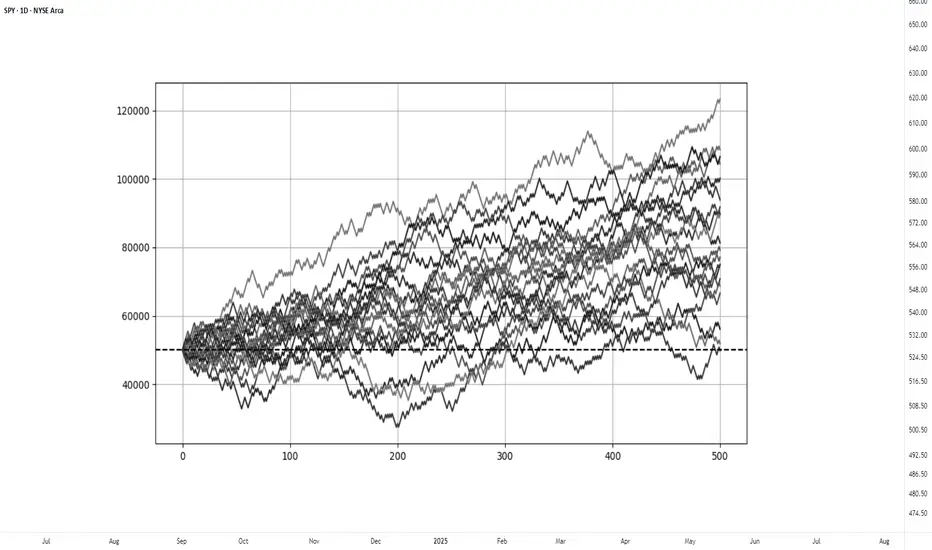
This principle can be demonstrated through simulation. A basic system with a 50% win rate and a 1.1 to 1 reward-to-risk ratio was tested over 500 trades across 20 independent runs. Each run began with a $50,000 account and applied a fixed risk of $1000 per trade. The setup, rules, and parameters remained identical throughout; the only difference was the random sequence in which wins and losses occurred.
While most runs clustered around a profitable outcome consistent with the positive expected value, several outliers demonstrated the impact of sequencing. When 250 trades had been done, one account was up more than 60% while another was down nearly 40%. In one run, the account more than doubled by the end of the 500 trades. In another, it failed to generate any meaningful profit across the entire sequence. These differences occurred not because of flaws in the system, but because of randomness in the order of outcomes.
These are known as Monte Carlo simulations, a method used to estimate possible outcomes of a system by repeatedly running it through randomized sequences. The technique is applied in many fields to model uncertainty and variation. In trading, it can be used to observe how a strategy performs across different sequences of wins and losses, helping to understand the range of outcomes that may result from probability.
Trading System Variations
Two different strategies can produce the same expected value, even if they operate on different terms. This is not a theoretical point, but a practical one that influences what kind of outcomes can be expected.
For example, System A operates with a high win rate and a lower reward-to-risk ratio. It wins 70% of the time with a 0.5 R, while System B takes the opposite approach and wins 30% of the time with a 2.5 R. If the applied risk is $1,000, the following results appear:
System A = (0.70 × 500) − (0.30 × 1,000) = 350 − 300 = $50
System B = (0.30 × 2,500) − (0.70 × 1,000) = 750 − 700 = $50
Both systems average a profit of $50 per trade, yet they are very different to trade and experience. Both are valid approaches if applied consistently. What matters is not the math alone, but whether the method can be executed consistently across the full range of outcomes.
Let’s look a bit closer into the simulations and practical implications.
The simulation above shows the higher winrate, lower reward system with an initial $100,000 balance, which made 50 independent runs of 1000 trades each. It produced an average final balance of $134,225. In terms of variance, the lowest final balance reached $99,500 while the best performer $164,000. Drawdowns remained modest, with an average of 7.67%, and only 5% of the runs ended below the initial $100,000 balance. This approach delivers more frequent rewards and a smoother equity curve, but requires strict control in terms of loss size.
The simulation above shows the lower winrate, higher reward system with an initial $100,000 balance, which made 50 independent runs of 1000 trades each. It produced an average final balance of $132,175. The variance was wider, where some run ended near $86,500 and another moved past $175,000. The drawdowns were deeper and more volatile, with an average of 21%, with the worst at 45%. This approach encounters more frequent losses but has infrequent winners that provide the performance required. This approach requires patience and mental resilience to handle frequent losses.
Practical Implications and Risk
While these simulations are static and simplified compared to real-world trading, the principle remains applicable. These results reinforce the idea that trading outcomes must be viewed probabilistically. A reasonable system can produce a wide range of results in the short term. Without sufficient sample size and risk control, even a valid approach may fail to perform. The purpose is not to predict the outcome of one trade, but to manage risk in a way that allows the account to endure variance and let statistical edge develop over time.
This randomness cannot be eliminated, but the impact can be controlled from position sizing. In case the size is too large, even a profitable system can be wiped out during an unfavorable sequence. This consideration is critical to survive long enough for the edge to express itself.
This is also the reason to remain detached from individual trades. When a trade is invalidated or risk has been exceeded, it should be treated as complete. Each outcome is part of a larger sample. Performance can only be evaluated through cumulative data, not individual trades.
Tradingsystem
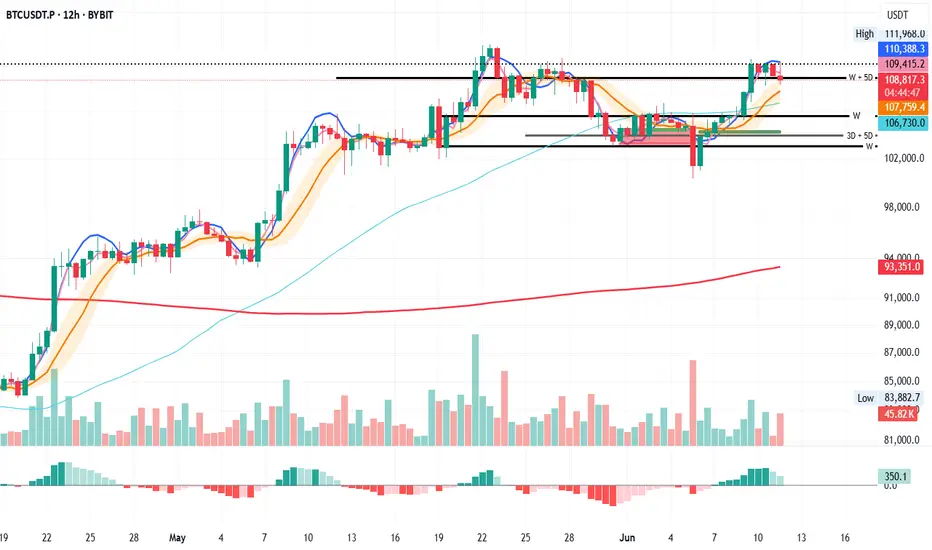
Bitcoin's Support in Focus: Stay Alert for Candle Closes
BTC on the 12H looks ready to close below the recently claimed W + 5D support.
It’s a signal to stay sharp and stick to a solid plan: but not a call to action just yet.
Let’s see how the next 3 to 5 candle closes unfold.
Always take profits and manage risk.
Interaction is welcome.
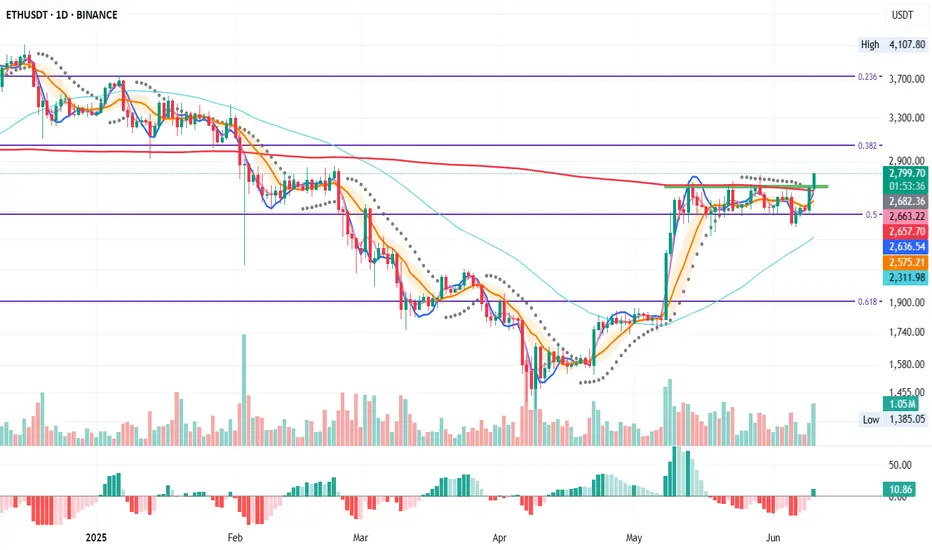
ETH Daily Close Signals Entry
On the daily, ETH is closing above both the 200MA and the previous tops. PSAR on the original system has flipped, though the free-to-use version hasn’t yet.
This is a trading idea. If you choose to allocate real capital, be prepared for the possibility of loss. But if you trust the system enough to allocate capital, trust that the PSAR has flipped and today’s close marks the entry.
It’s exactly how the system defines a valid setup:
Daily close above the 200MA, with MLR > SMA > BB center.
The 12H timeframe acts as confirmation from the lower TF, and the 4H is already green and ripping.
So buckle up—this could be a ride worth taking.
Always take profits and manage risk.
Interaction is welcome.
ETH – System Trigger Hit
ETH on the 12H has just reclaimed the green line: resistance from the previous tops.
This level sits roughly midway between the 0.5 and 0.382 Fib levels, with \$3000 now looking closer than \$2500.
PSAR has just flipped above the last tops, and price is now above MLR > SMA > BB center > 200MA.
All system conditions are met for a long entry on this timeframe.
This also comes as confirmation of the daily signal entry at today closing
Always take profits and manage risk.
Interaction is welcome.

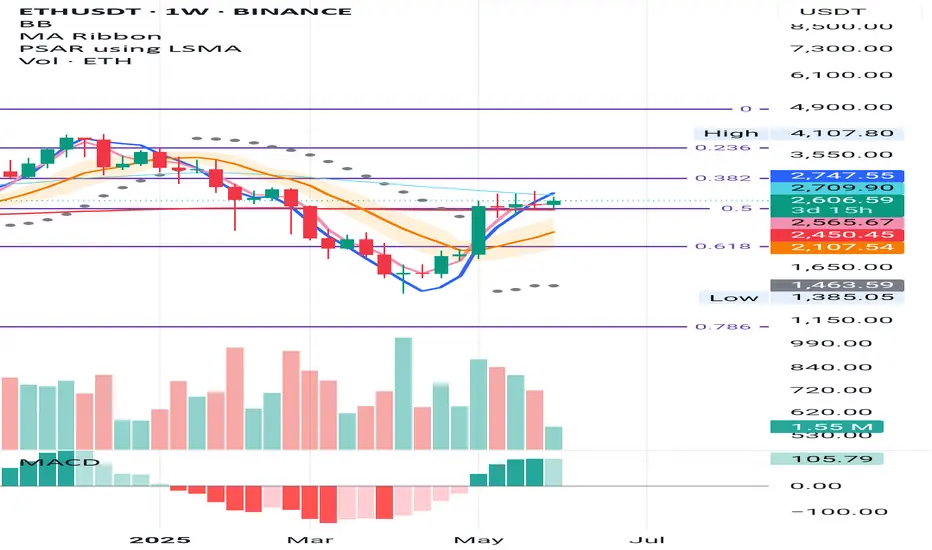
ETH Weekly – Signs Aligning for a Long Setup
ETH is forming subtle higher lows above the 0.5 Fibonacci level and the 200MA—both sitting near the same key support zone.
The 50MA is currently acting as resistance, but structurally we’re seeing MLR > SMA > BB center, and the PSAR flipped bullish since the week of May 12.
We now have all the signals needed for a valid long entry on this timeframe.
Feel free to drop your thoughts in the comments—good or bad, all engagement is appreciated.
Take profits. Manage risk. Stay sharp.
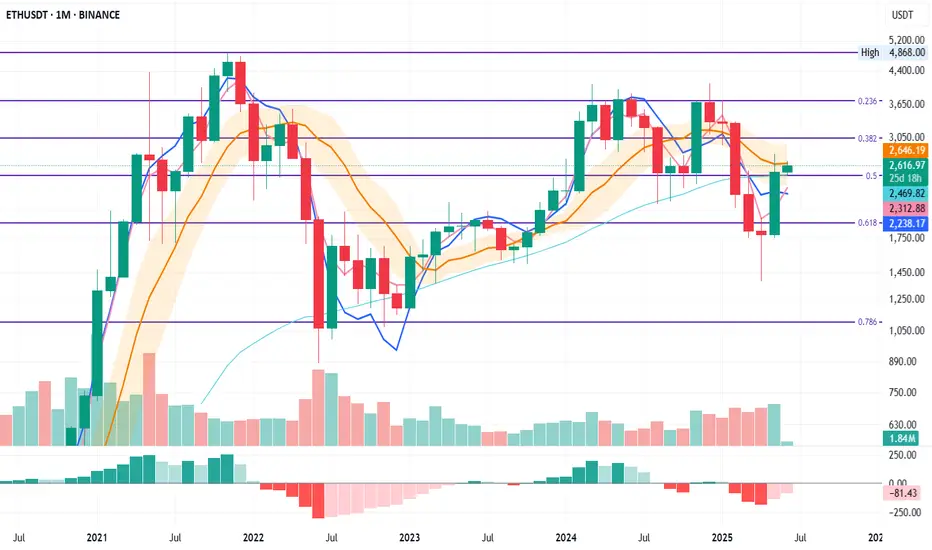
ETH Monthly – Fibonacci Structure in Play
ETH has been respecting the monthly Fibonacci levels with surprising precision.
There was a clear double top at the 0.236 Fib in May and November 2024, with a base forming at the 0.5 Fib. That same 0.5 Fib now acts as support, aligned with the 50MA.
The BB centre is currently stopping price, but for how long remains to be seen.
SMA is above MLR and rising, which supports a bullish bias.
If this structure holds, the next resistance zones may align with the higher Fib levels.
Feel free to drop your thoughts in the comments—good or bad, all engagement is appreciated.
Take profits. Manage risk. Stay sharp.
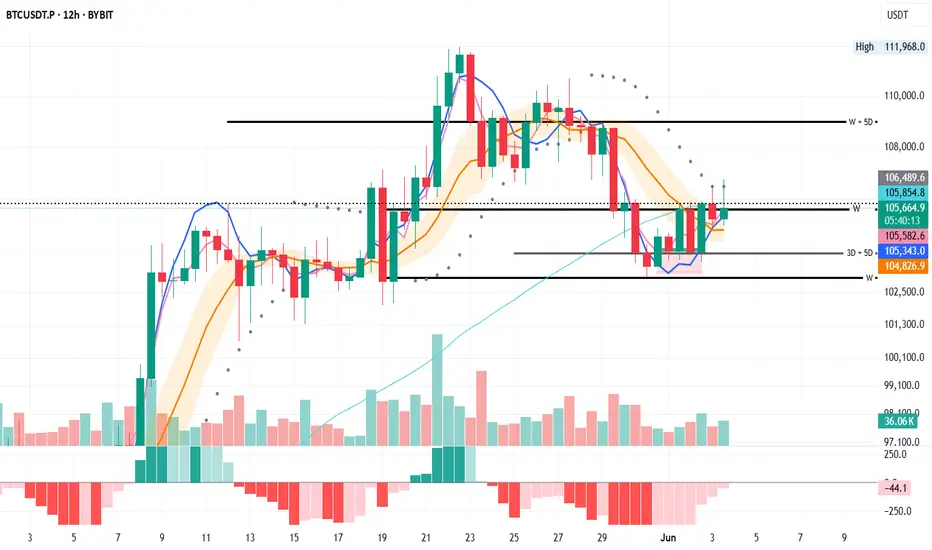
BTC 12H – Slightly Different Picture
The 12H chart tells a slightly different story.
From the PSAR point of view, price has tapped it twice, but that’s not enough for confirmation.
From the system perspective, price is trading above the BB center, with both MLR and SMA also above it—this could justify small scaling.
From the S/R view, price is currently testing weekly resistance and the dotted line marking the daily close. That’s a strong reason to apply proper risk management.
Let’s see how this unfolds.
Scaling in may be a valid option for those considering long exposure—if risk is managed properly.
Feel free to drop your thoughts in the comments—good or bad, all engagement is appreciated.
Take profits. Manage risk. Stay sharp.
BTC Daily – Mixed Signals, Patience Required
From the PSAR perspective, BTC remains in a bearish phase. We need to wait for a PSAR flip to green before considering new long entries.
From the second system view, we’re also still in bearish territory. The setup will shift once MLR crosses above the SMA and BB centre. Currently, price is holding the SMA as support and has paused at the BB centre.
Looking at S/R levels, we’ve seen a solid bounce from the 3D + 5D support and are now holding at the weekly support zone.
Let’s see how this unfolds.
Scaling in may be a valid option for those considering long exposure—if risk is managed properly.
Feel free to drop your thoughts in the comments—good or bad, all engagement is appreciated.
Take profits. Manage risk. Stay sharp.

BTC 3D – Key S/R Level in PlayBTC is currently trading below the black line, which marks the double top support/resistance level on the 3D chart.
Tonight’s 3D candle close will be important:
🔻 A close below could open the way for more downside.
🔼 A close above might invite continuation—but neither outcome is guaranteed.
🎯 The best approach? Stick to the system.
Place orders just below the last PSAR, stay disciplined, and avoid emotional decisions.
✅ Always take profits.
✅ Always manage risk.
These are the only two things we can truly control.
Thanks for reading—and if you found this helpful, feel free to react or leave a comment!

PENGU 12H – System Entry Triggered
PENGU just gave a system entry on the 12H time frame.
📌 The black line represents entry points from the 3D and 1W time frames. It has acted as a key level in the past and has now been flipped into support again.
📈 Price is currently pushing into the pink box, which may act as short-term resistance. Keep an eye on how long it takes to break through this zone—if it lingers too long, we might see a temporary rejection.
🟢 OBV is rising
🟢 MACD is turning bullish
🟢 Fundamentals look very strong
I believe PENGU still has upside potential from here.
✅ Stick to the system—no guessing tops. Let price action guide the decisions.

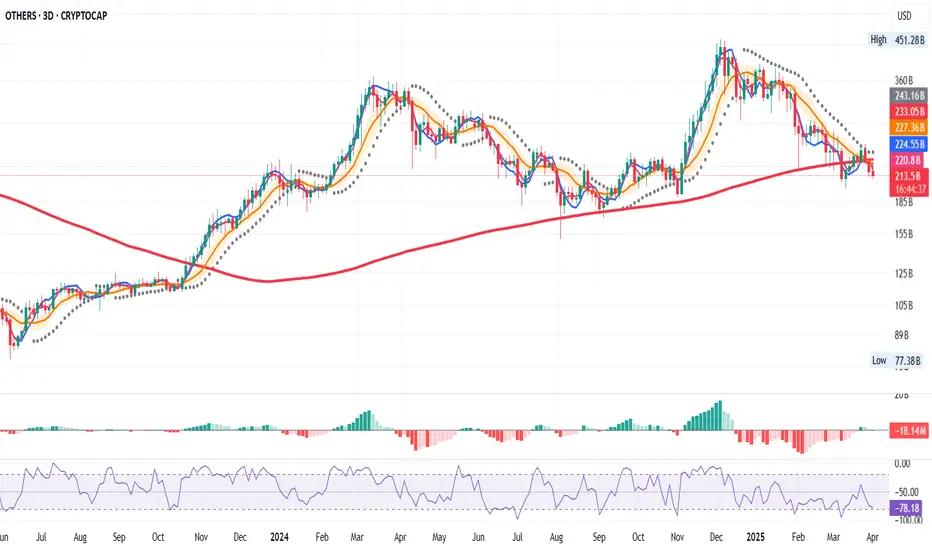
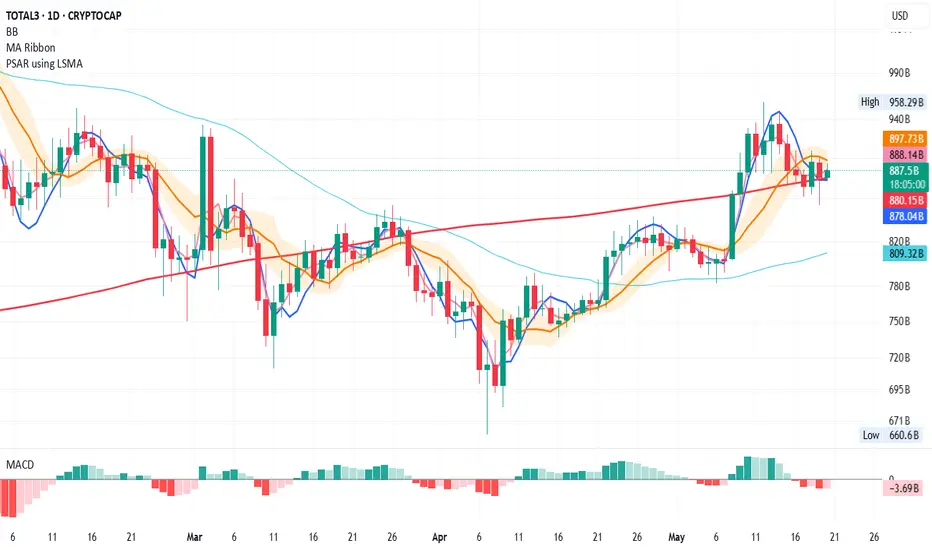
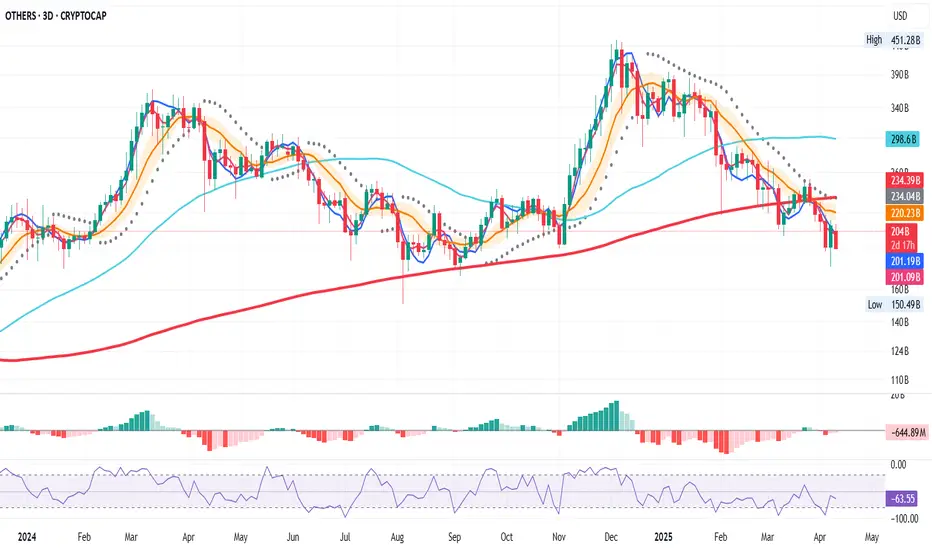
TOTAL3 Update: Potential Recovery on the Daily ChartLooking at TOTAL3 on the daily:
Yesterday, we saw a wick below the 200MA, but the price managed to close above it by the end of the day—a good sign for recovery. 🔄
Although the MLR < SMA < BB Center isn't ideal, we continue to monitor price action in relation to the 200MA. If we close above it again today, things might start to turn positive. 🌱
⚠️ Keep an eye on macro news and hope for no more downgrades from agencies like Moody’s.
Thanks for reading! Stay safe and manage your risk. 📊
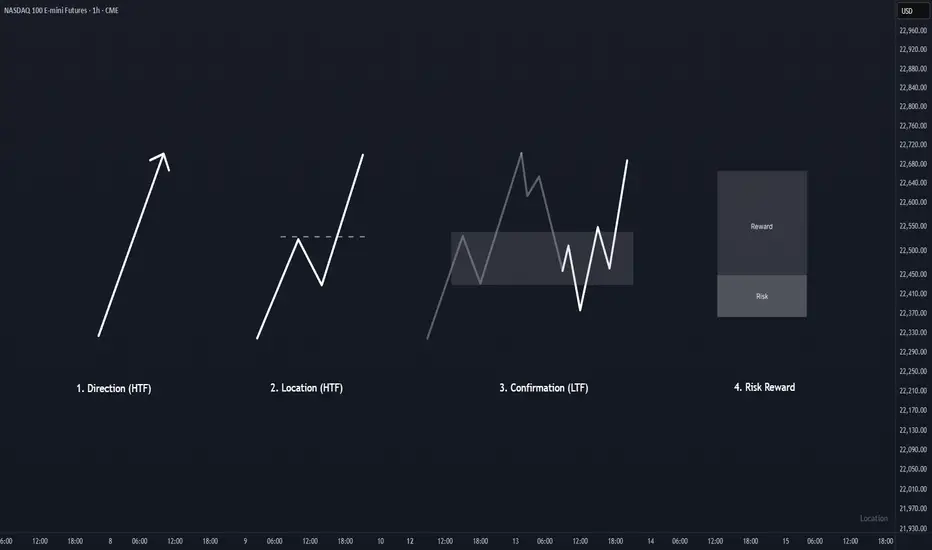
KISS Trading SystemOverview :
Trading process should be as simple as possible. One of the simple method to trade is primarily identify direction, find a good location to entry, wait for confirmation in the location, and finally execute the trade when the risk reward ratio is good.
1. Direction
To identify direction, follow the market structure. Higher high and higher low indicates price is in a bullish trend (uptrend), while lower high and lower low indicates the price is in a bearish trend (downtrend). If there is no clear structure higher high and higher low or lower and high lower low, price is in sideways mode. Best is to avoid trade under this condition until clear trend is formed.
2. Location
Every time price create a new breakout structure, mark the the structure as our potential location for entry. There are some occasion where price does not pullback to the location and continuing the trend by creating a new breakout structure. Do not FOMO, just wait for the next location and confirmation within the location to entry and minimize your risk.
3. Confirmation
Patience is the key. Wait for price to pullback at higher time frame location, and focus for confirmation in lower time frame to entry and reduce risk. Time is fractal, the structure pattern is same on all timeframes. Choosing the right timeframe pair is crucial. Refer to table in the notes below for timeframe pairing.
4. Risk Reward
This is the main essence in trading, controlling risk and preserving capital. Entry without doubt when the risk reward are good. Execute, and trust your setup.
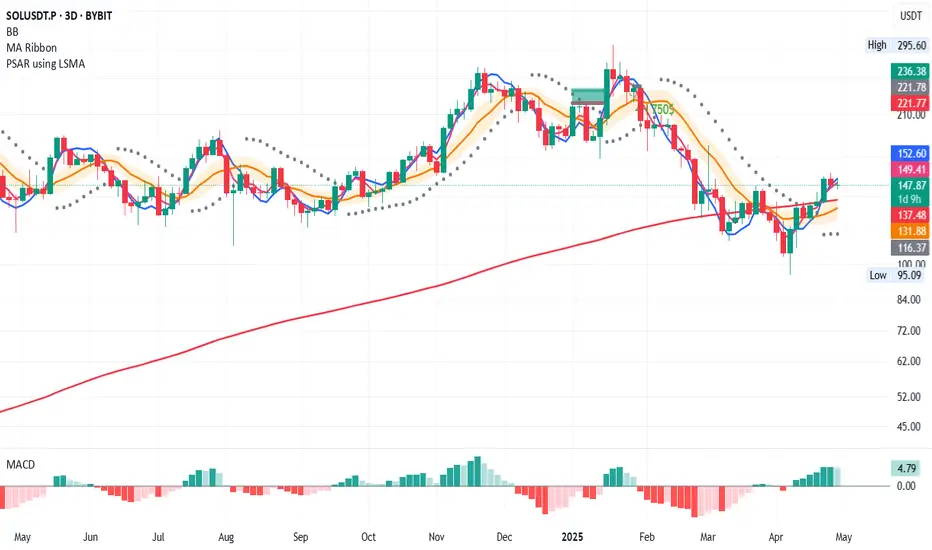
SOL/USDT – 3D Long Signal Active📅 April 29, 2025
The system triggered a long entry at the last 3D bar close.
Currently, the price remains around the same levels.
✅ System conditions for a long are fully met:
MLR > SMA > BB Center > PSAR
Price is trading above the 200 MA on the 3D timeframe.
⚠️ Caution:
On the 1D timeframe, price is still below the 200 MA, which suggests some lingering weakness. Proceed carefully.
📍 Strategy Plan:
Consider entering long at today’s daily close or at the next 3D bar close.
Suggested stop-loss: below the latest PSAR dot for system integrity.
🔔 Keep an eye on updates and thank you for reading! 📈📊
DOGE/USDT – 3D Long Signal Active📅 April 29, 2025
The system triggered a long entry at the last 3D bar close.
Currently, the price remains around the same levels.
✅ System conditions for a long are fully met:
MLR > SMA > BB Center > PSAR
Price is trading above the 200 MA on the 3D timeframe.
⚠️ Caution:
On the 1D timeframe, price is still below the 200 MA, which suggests some lingering weakness. Proceed carefully.
📍 Strategy Plan:
Consider entering long at today’s daily close or at the next 3D bar close.
Suggested stop-loss: below the latest PSAR dot for system integrity.
🔔 Keep an eye on updates and thank you for reading! 📈📊

XLM/USDT – 3D Long Signal Active 📅 April 29, 2025
The system triggered a long entry at the last 3D bar close.
Currently, the price remains around the same levels.
✅ System conditions for a long are fully met:
MLR > SMA > BB Center > PSAR
Price is trading above the 200 MA on the 3D timeframe.
⚠️ Caution:
On the 1D timeframe, price is still below the 200 MA, which suggests some lingering weakness. Proceed carefully.
📍 Strategy Plan:
Consider entering long at today’s daily close or at the next 3D bar close.
Suggested stop-loss: below the latest PSAR dot for system integrity.
🔔 Keep an eye on updates and thank you for reading! 📈📊

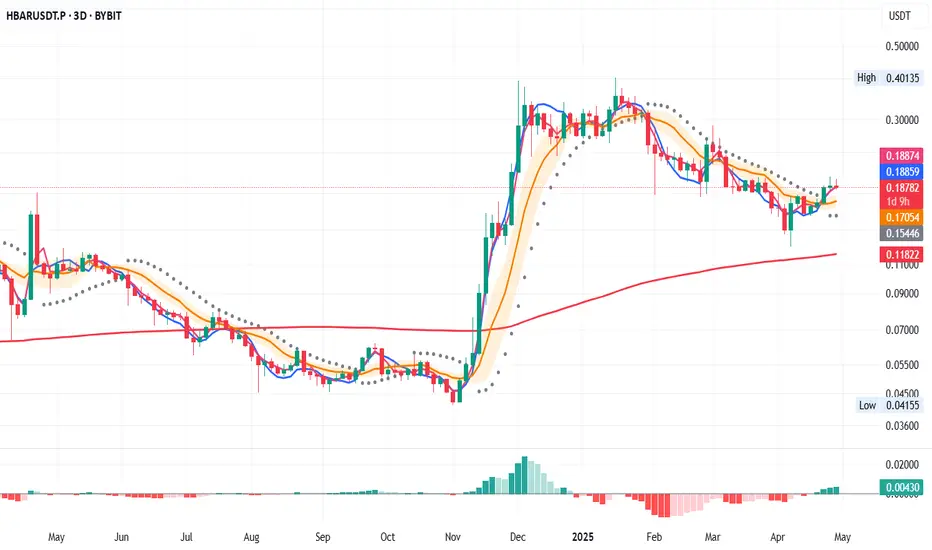
HBAR/USDT – 3D Long Signal Active📅 April 29, 2025
The system triggered a long entry at the last 3D bar close.
Currently, the price remains around the same levels.
✅ System conditions for a long are fully met:
MLR > SMA > BB Center > PSAR
Price is trading above the 200 MA on the 3D timeframe.
⚠️ Caution:
On the 1D timeframe, price is still below the 200 MA, which suggests some lingering weakness. Proceed carefully.
📍 Strategy Plan:
Consider entering long at today’s daily close or at the next 3D bar close.
Suggested stop-loss: below the latest PSAR dot for system integrity.
🔔 Keep an eye on updates and thank you for reading! 📈📊
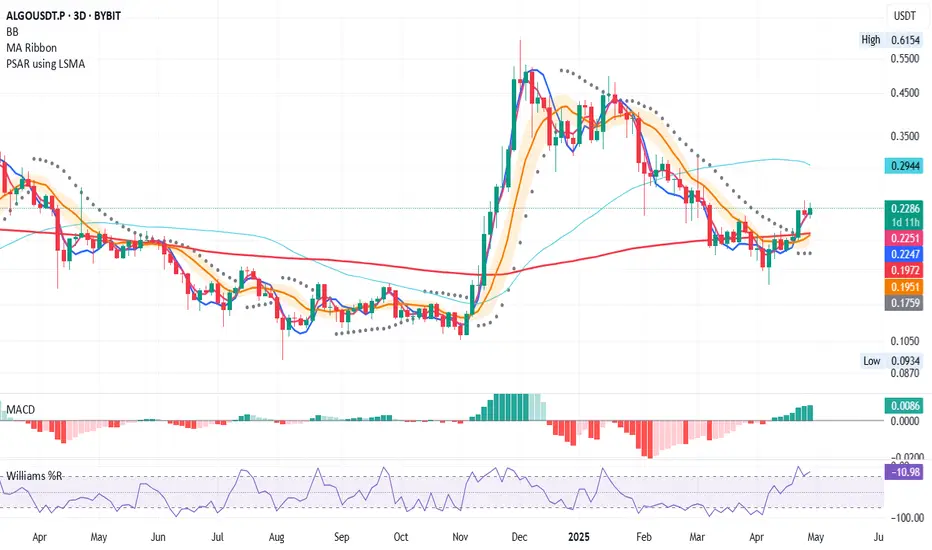
ALGO/USDT - Long Setup Update on 3D Time Frame29.04.2025
On April 22, we had a long entry signal on the 3D time frame. As of today, the price remains around the same level.
The system’s rules are favourable for another long entry:
- Price > MLR > SMA > PSAR
- Price is above the 200 MA, reinforcing the bullish bias.
Consider a long entry at today’s close or at the close of this 3D bar. However, note that on the 1D time frame, the price is still below the 200 MA, which could act as resistance.
The PSAR stop-loss is a good option for spot trading, given its placement.
Keep an eye on updates and thank you for reading! 📈📊
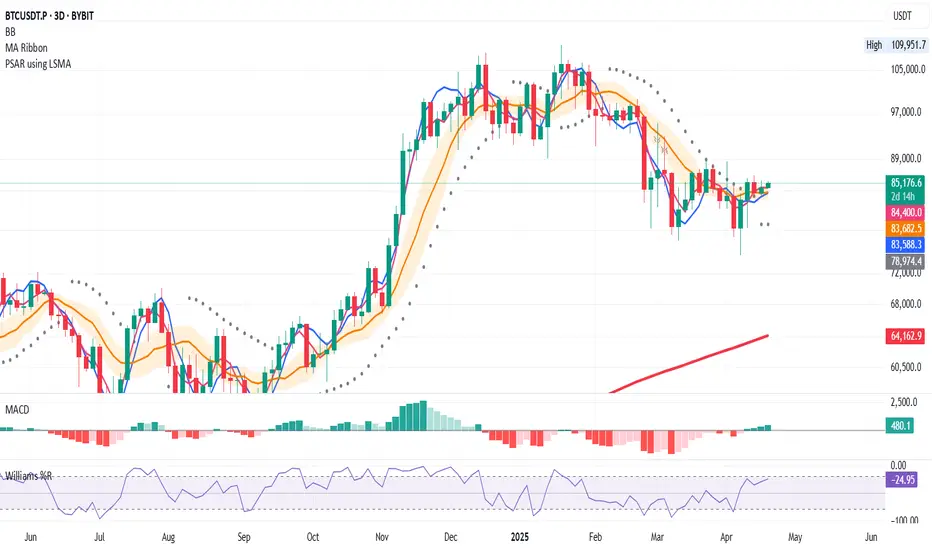
BTCUSDT – System-Based Long Signal (3D Timeframe)
📅 April 19, 2025
Yesterday’s 3D candle closed with a clear PSAR flip, shifting from bearish to bullish — an early signal of potential trend reversal.
In addition, price is now trading above the 200 MA, which confirms a return into long-term bullish territory.
🟢 Based on these two system signals, we have a valid long entry setup forming.
However, the system is not fully aligned yet:
⚠️ MLR < BB Center < SMA
This suggests the internal momentum structure is still weak.
We are above 200MA and have a PSAR trigger, but the trend metrics aren't in full confluence.
📌 Strategy suggestion:
- Consider a partial spot entry only
- Avoid leverage until full confirmation
- Wait for MLR to flip above BB Center for added strength
This is a trigger-before-confirmation type of setup — and in such cases, discipline > excitement.
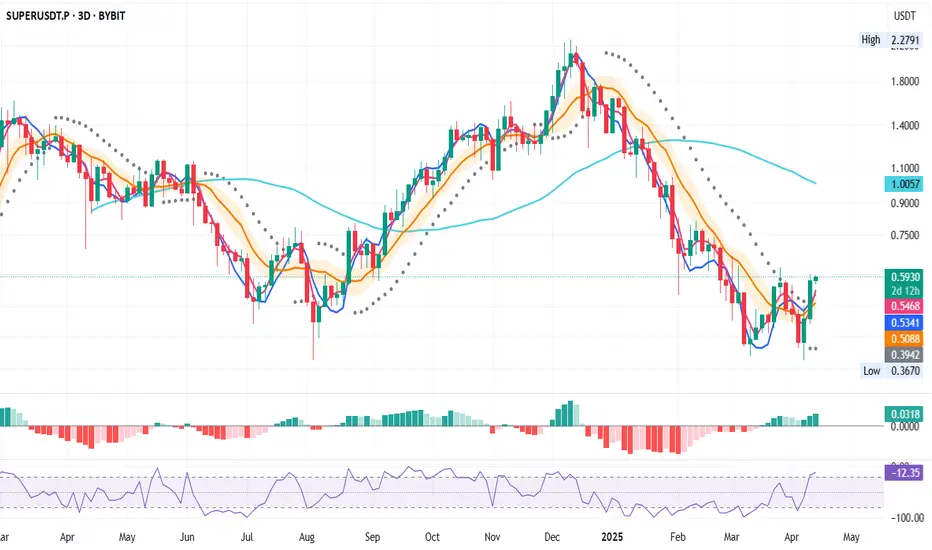
SUPERUSDT – Dual Timeframe Long Signal (1D & 3D)📅 April 13, 2025
So, we have another long system entry — but this one is a bit special.
✅ The long signal is confirmed on both the 1D and 3D timeframes, which adds confidence to the setup.
✅ MLR > SMA > BB Center – strong technical confluence
✅ Price > PSAR – trend shift confirmed on both timeframes
However, risk context matters:
⚠️ On the 3D, price is still below the 50 MA
⚠️ On the 1D, price is still below the 200 MA
That means momentum is building, but we’re not in full bullish structure yet.
📌 My advice:
- Don’t use leverage on this entry
- Spot only, partial size
- Don’t go all-in — system says “yes,” but structure says “wait and scale”
Discipline protects you. Emotions don’t.
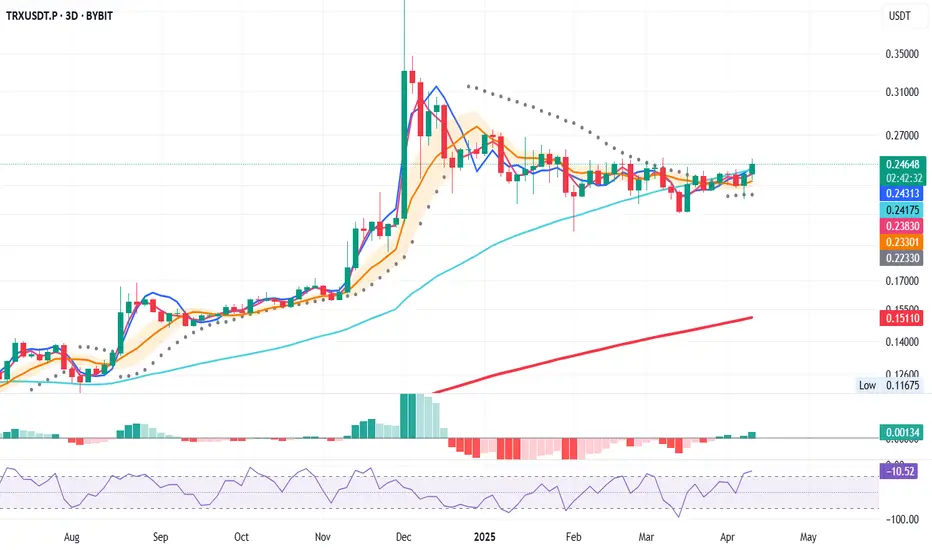
TRXUSDT – Bullish System Trigger (3D Chart)
📅 April 13, 2025
Today’s 3D bar close offers a strong bullish signal, aligning multiple system indicators in favor of a long entry.
Here’s what the system confirms:
✅ Price closed above the 50 MA – bullish structure
✅ MLR > SMA > BB Center – solid confluence
✅ Price > PSAR – trend shift confirmed
✅ Above the 200 MA – long-term trend support
Entry Strategy
- Open long at the 3D bar close
- Stop-loss below the latest PSAR dot for system integrity
📌 Note: This is a system-based entry — not a prediction.
The Most Overlooked Setup in Trading: Your Own Decision ProcessTrading psychology at its finest — where the real edge begins.
Over time, I’ve realized that most traders obsess over systems, setups, and signals... but very few ever stop to ask: “How do I actually make decisions?”🧩
The truth is — every trade I take is a result of an internal process. Not just some rule from a strategy, but a sequence of thoughts, comparisons, and feelings I go through (sometimes without even realizing it). And when I mapped it out, it changed the way I approached the market. 🔄
Here’s what I found:
1.There’s always a trigger.
Sometimes it’s a chart pattern. Other times, it’s a shift in sentiment or an alert I’ve set. But that moment when I *start* to consider entering — that’s the spark. Recognizing that moment is the first step. ⚡
2.Then comes the operation phase.
That’s when I begin scanning. I look for setups, patterns, confluences — not just at face value, but through the lens of my experience. I start running mental “what-if” simulations, visualizing what the trade could become. 🔍
3.The test phase is critical.
This is where I mentally compare the current opportunity with past winners or losers. Does it “look right”? Does it “feel like” a good trade? That moment where a setup clicks isn’t just about indicators — it’s about internal alignment. 🧠
4.Exit isn’t just a price level — it’s a decision threshold.
Knowing when to act (or not) often comes down to a shift in internal state. For me, it’s usually a combination of visual confirmation + a gut signal. When both align, I act. 🎯
📌 Why does this matter?
Because most failed trades aren’t just “bad signals” — they’re *poorly made decisions*. If I don’t understand my internal process, I’m flying blind. But when I do, I can refine it, track it, and improve it.
If you’ve never mapped out your decision-making strategy, do it. You’ll learn more about your trading than any indicator could ever teach you. 💡
👉 Keep following me for decision-making insights and real trading psychology facts — the stuff that actually moves the needle.
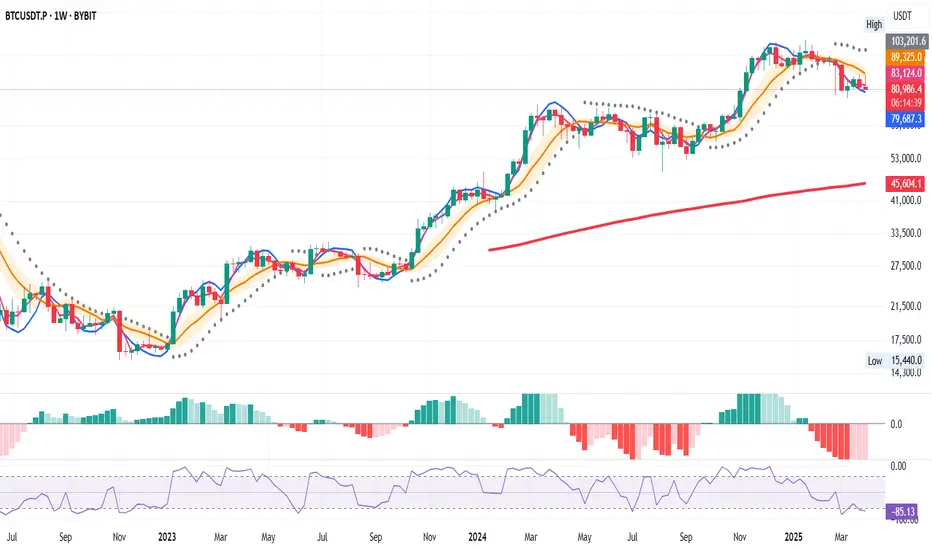
BTC Weekly – System Says Wait
BTC closed above the 200 MA — structurally bullish.
But the system remains bearish:
LR < SMA < BB center
PSAR dots above price
No setup confirmed. No rule = no trade.
After a macro-heavy week, BTC is holding, but that can flip fast.
This is where discipline protects you.
You can have the best system, but without the right mindset, it won’t help you.
Discipline is more than following rules — it’s about being in the right state to trust them.
I don’t predict. I follow.
The system keeps me calm, focused, and out of emotional trades.
The Power of a Trading System with the Right Mental State
📅 April 3, 2025
Over the years, I’ve learned that discipline in trading isn’t just about having a system — it’s about being in the right state of mind to follow that system. 🧘♂️📈
You can have the cleanest rules, the best strategy, and solid backtests … but if your mindset is off, none of it matters. That’s when hesitation creeps in. Or worse — revenge trades, FOMO, or doubt.
So I started focusing on one thing: my internal state before and during a trade. 🧭
🔄 How I Manage My Mindset
✅ 1. Pre-Trade Check-In
Before I trade, I ask:
How do I feel right now?
If I’m not grounded, I don’t trade. Simple. I’ve learned the hard way that it’s not worth it.
🔥 2. Anchoring a Disciplined State
I recall moments where I executed perfectly — calm, focused, in control. I mentally step into that version of myself before every session.
🧩 3. Staying Congruent
During a trade, I pay attention to my behavior. If I notice myself drifting from my plan — I pause, breathe, and realign.
🎯 Why This Works
A trading system gives structure.
But structure means nothing without mental discipline.
By mastering my emotional state, I stopped sabotaging my own edge.
No more reacting from fear. No more chasing. Just clean, committed execution. 🧘♂️✅
💬 Final Thought
Consistency doesn’t come from the market — it comes from me.
So now, before I look at the chart, I check in with myself first.
Because when my state is right, my trading flows. ⚖️✨
If this resonates, drop your thoughts below — let’s grow together.