(AUDNZD) Short Trade setupWe Have Found Rising wedge in AUDNZD, The chart we are Doing Analysis is 1 Hrs.
There is 12 Pips Risk and 64 Pips Reward You can take Entry Now
or Wait for Rising wedge Break to Downside.
On the technical analysis chart, a wedge pattern is a market trend commonly found in traded assets. The pattern is characterized by a contracting range in prices coupled with an upward trend in prices or a downward trend in prices.
Credit: Wikipedia
Note: This is only for Educational Purpose this is not Investment advice.
Please support the setup with your likes, comments and by following on Trading View.
Thanks
Adil Khan.
Tradingtips

BTC/USD , Not only crypto dip , 9/2/2018 trading dairyIt Seems that a lot of investors has been worried about the drastic bear recently , it did not only hit on the crypto market , there are all effected in the stock market and forex too, seems like the world is having a huge correction.
Buying : 8255
S/L : 6807
1st Target to TP : 9425
2nd Target to TP : 11507
Hold period : 1 - 2 Month
Please comment if there is any mistake or side opinion to improve my charting skills or decision making on the market.
Critics comment and mentor comments are very welcome.

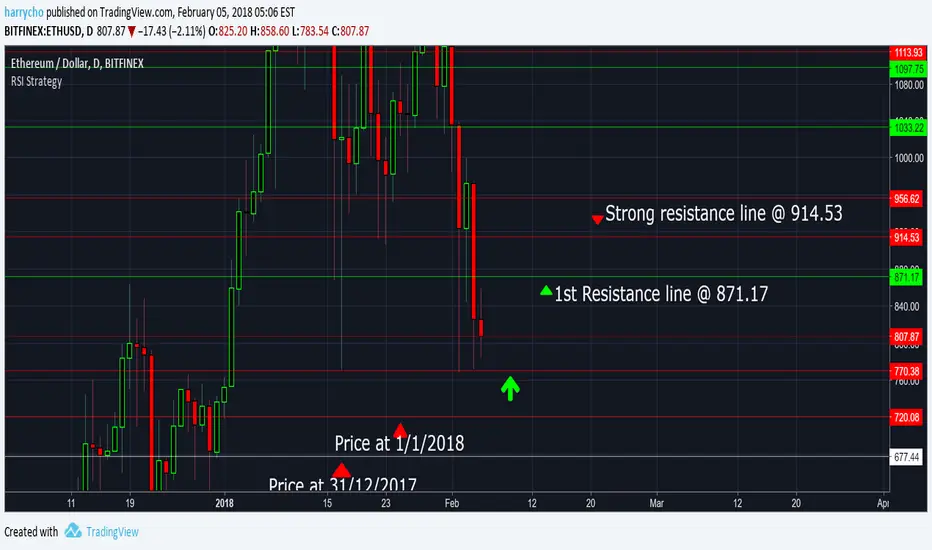
ETH/USD 5/2/2018 Trading Dairy. No worries on the DIP !Strong support line at 770 can be a good opportunity to buy.
If it breaks price at 770 , most probably the price be going down to 720 which is the price from beginning of the year.
I believe that this year is going to be a good year for Altcoins. more and more ICOs are being created base on ETH . Which give a lot of strong future opportunity for this coin.
Strategy:
Buy : above 770
S/L : 730
T/P : 870 ( 1st Target )
T/P : 910 ( 2nd Target )
Hold period : 1 - 2 Months to reach T/P target.
Please comment if there is any mistake or side opinion to improve my charting skills or decision making on the market.
Critics comment and mentor comments are very welcome.
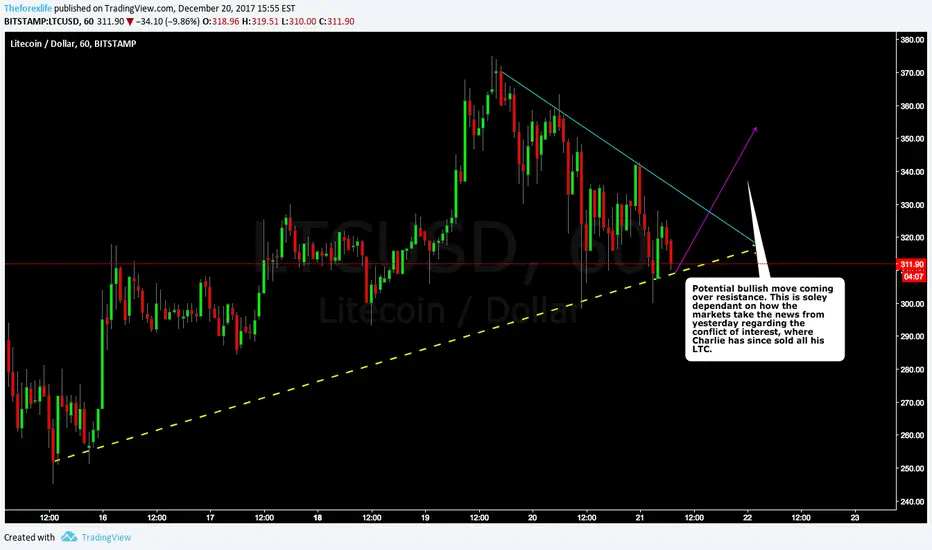
LTC POTENTIAL LONGPotential long coming off strong resistance levels, looking for bullish evidence over the next couple of hours. WARNING this is dependant on how the Asian market responds to the "Conflict of interest" news release from yesterday.
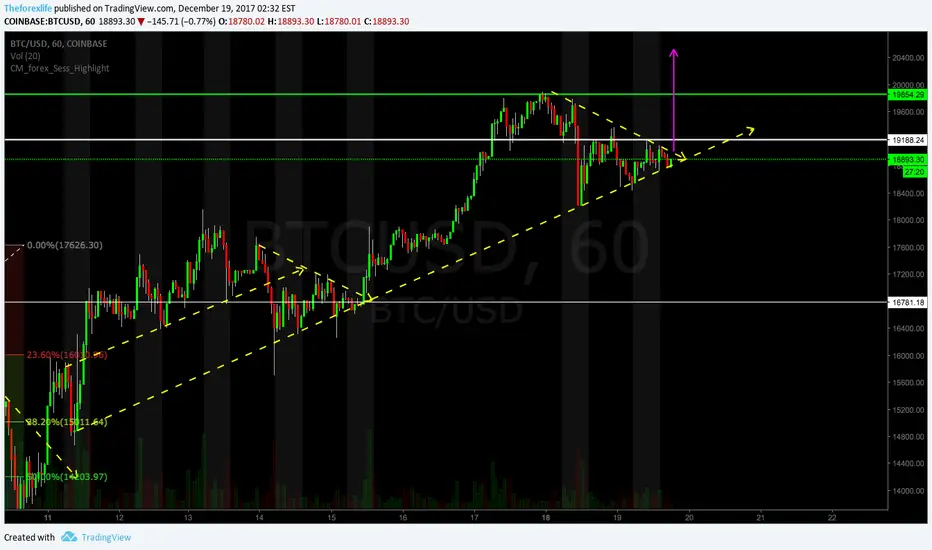
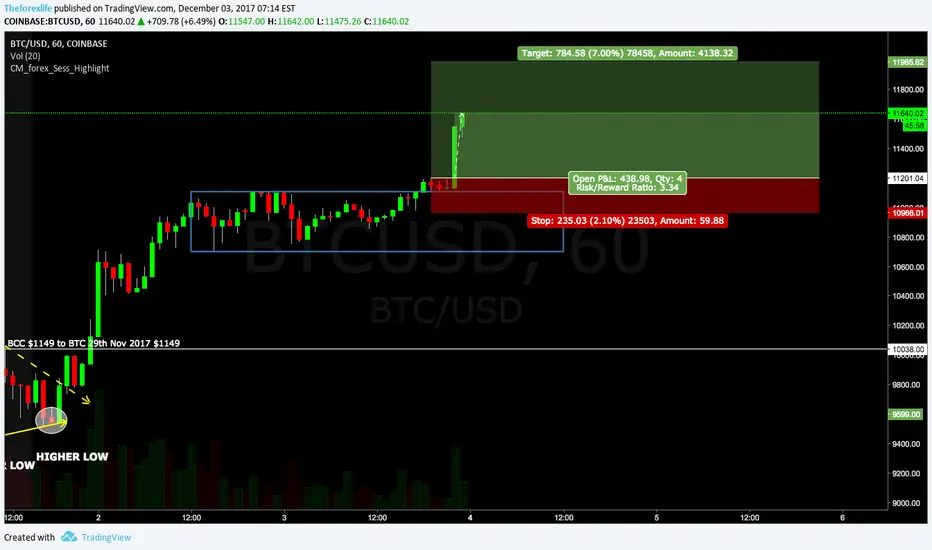
POTENTIAL LONG ON BTCWe are about to break out of a triangle pattern. If price breaks north of the triangle we are going long, if it breaks south we will hold.
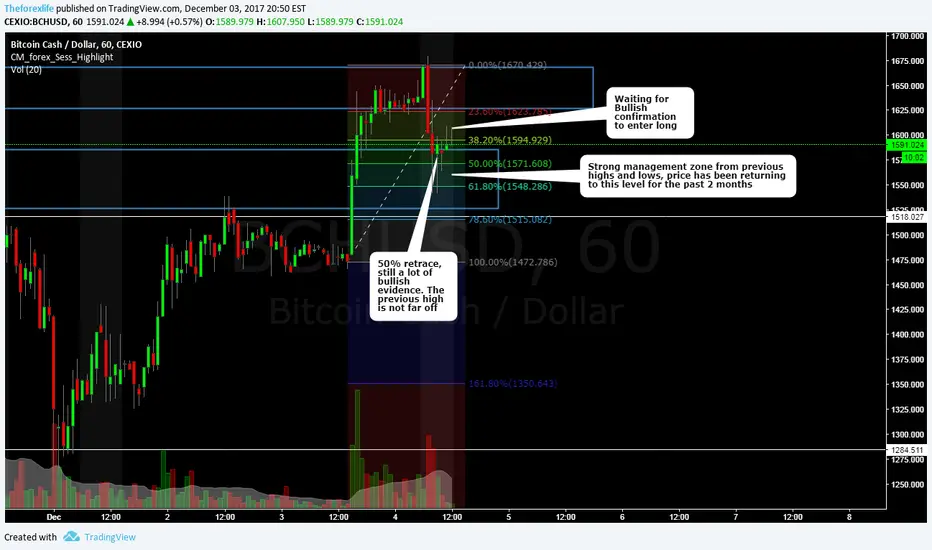
BITCOIN CASH LONGBCHUSD is sitting on a previous strong management zone that's acting as resistance. We are waiting for enough Bullish evidence to re-enter this market
Deceleration ExampleDeclaration is something every trader should recognise. Its where you assess whether you are going to stay in or exit your trade. If the later happens we then wait for Bullish or Bearish confirmation depending on the trend we are trading.
Back test and look for deceleration around the peaks and retraces of trends, make sure you are trading with the trend.

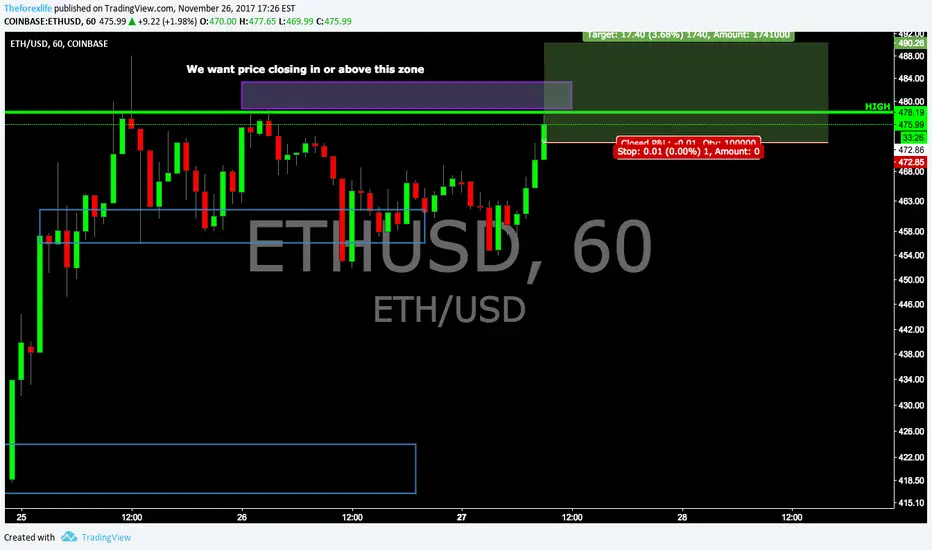
ETHEREUM ETHUSDEthereum looks like its on the move again. We still want to be seeing a close in the purple management zone or above to really cement a good bull move. It would also see the end the of the previous consolidation period, since reaching the most recent all time high.
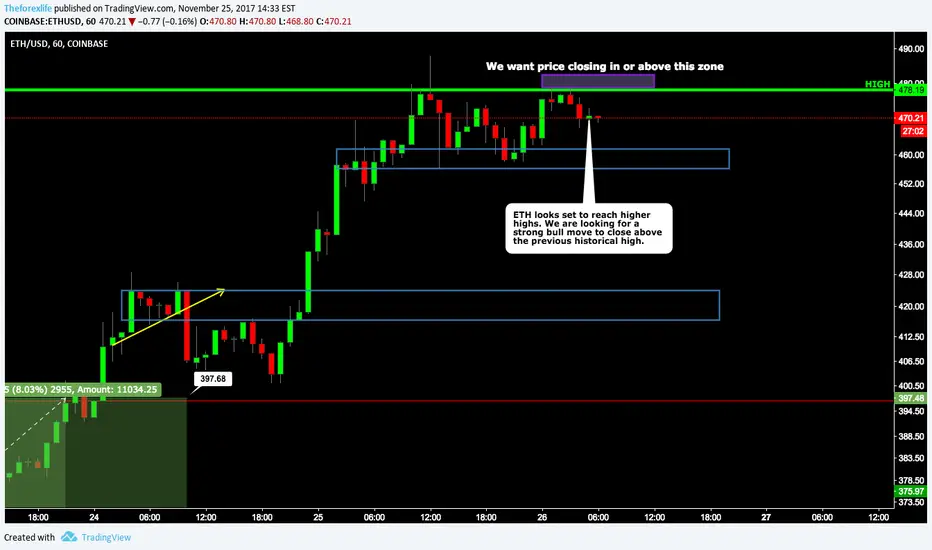
Ethereum ETHUSD LONGWaiting for price to close in or above the purple zone. We already have bullish evidence with a higher low, now waiting for a higher high.
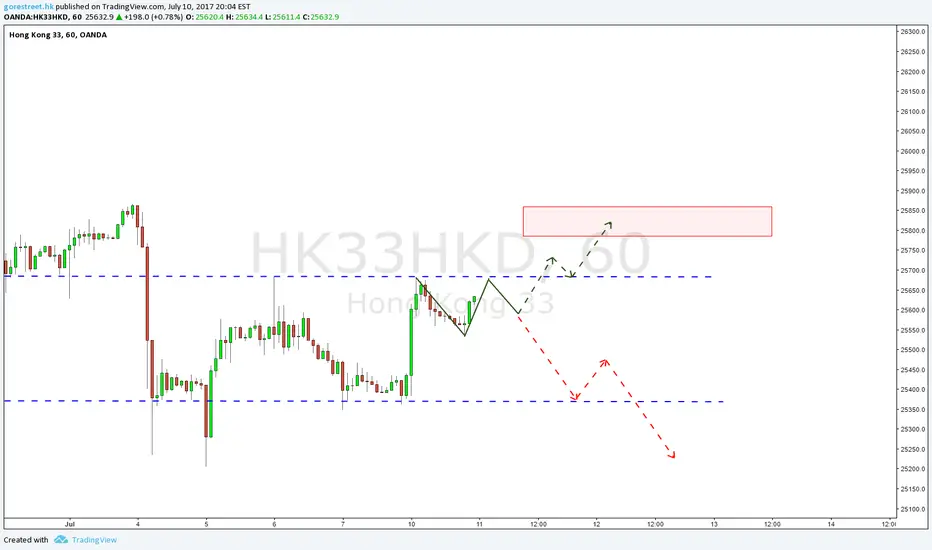
Hang Seng Index Future / 60 / Trading TipsMorning Post 11-July-2017
Trading Tips:
Our view of the market is towards bearish, however, HSF has no direction at this movement.
1. Look for a BO to the downside for trend continuation trades
2. Bearish Bat/Gartley formation inside the red zone
3. If we have a BO of Previous Top (near 25600), we may have a short term bull opportunity.
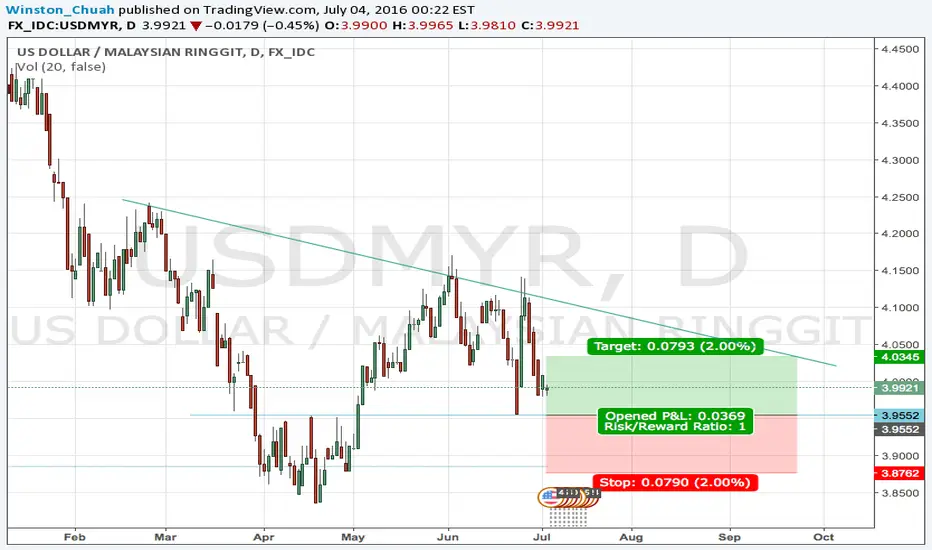
Weekly Trading View, USDMYR (4th July 2016)USDMYR 3.9552 is a strong Daily Support, Let's see how market movement in this few days. Happy Trading Day !!!