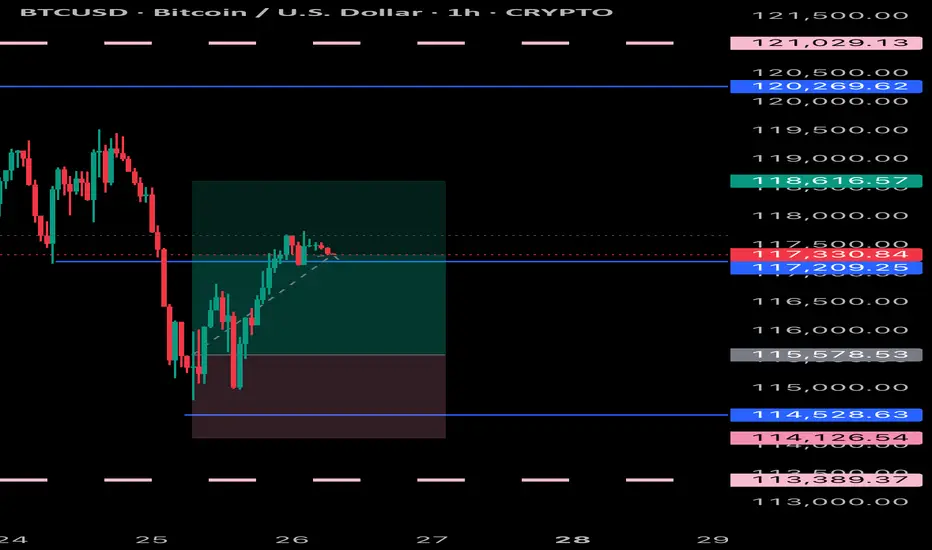
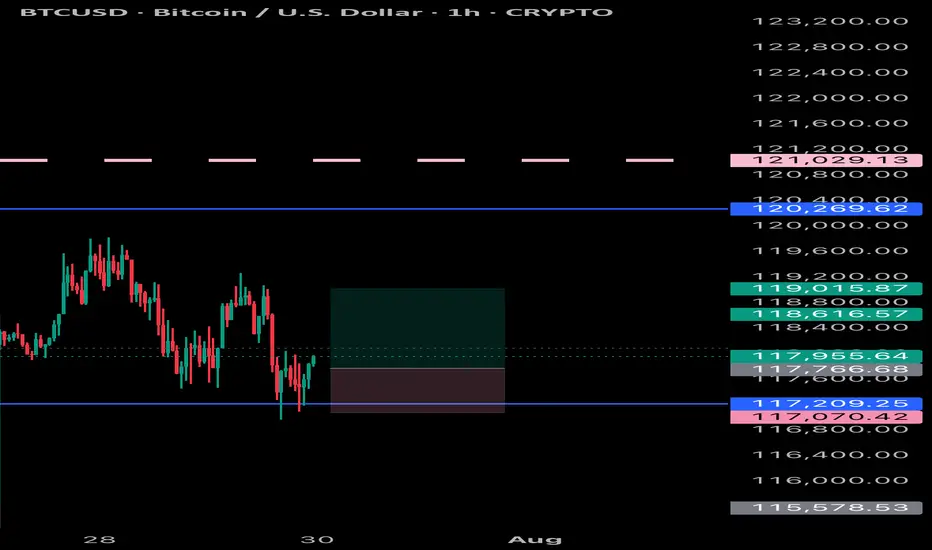
BITCOIN BULLYING Bitcoin hit take profit previously and now I will be looking at another buy within this trend and price action combined with patterns
Tradingview
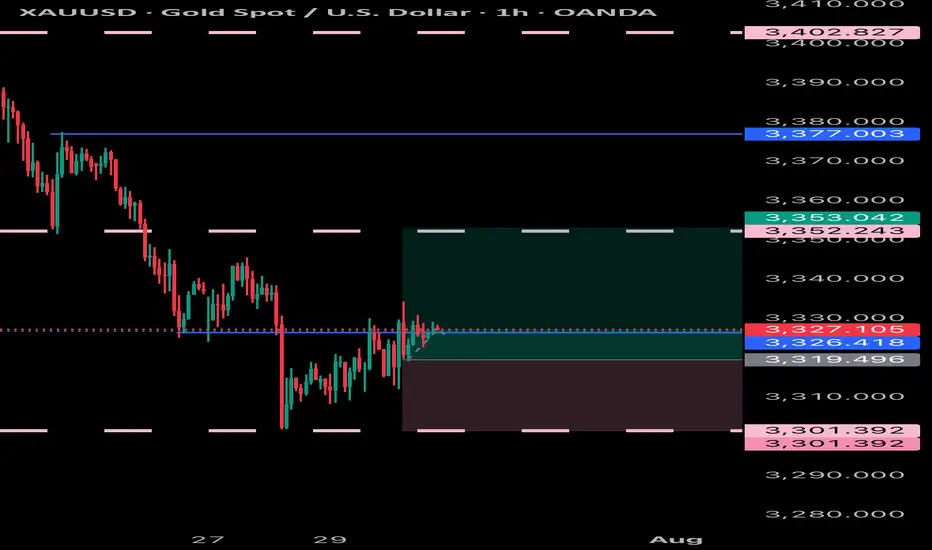
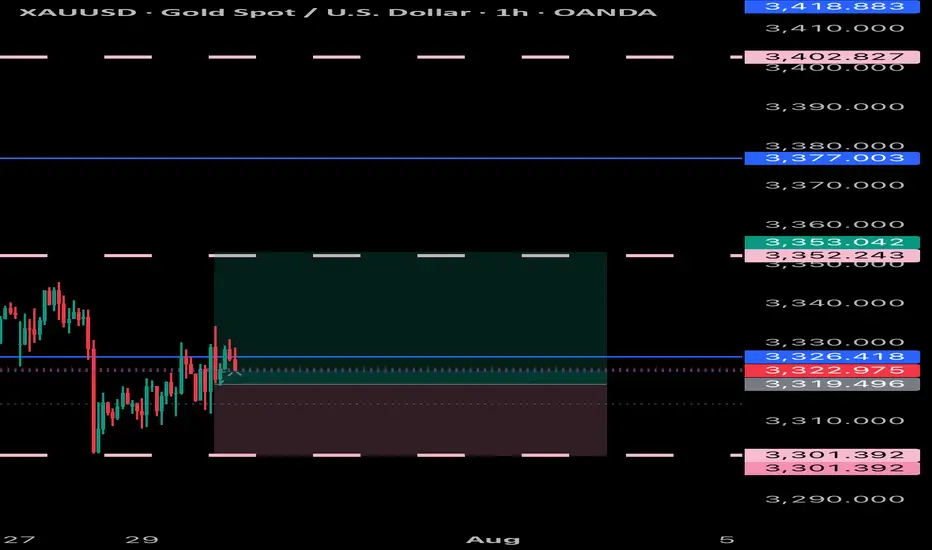
GOLD GOLDEN XauUsd is now still respecting the trend and will keep holding expecting an even stronger push to the up side
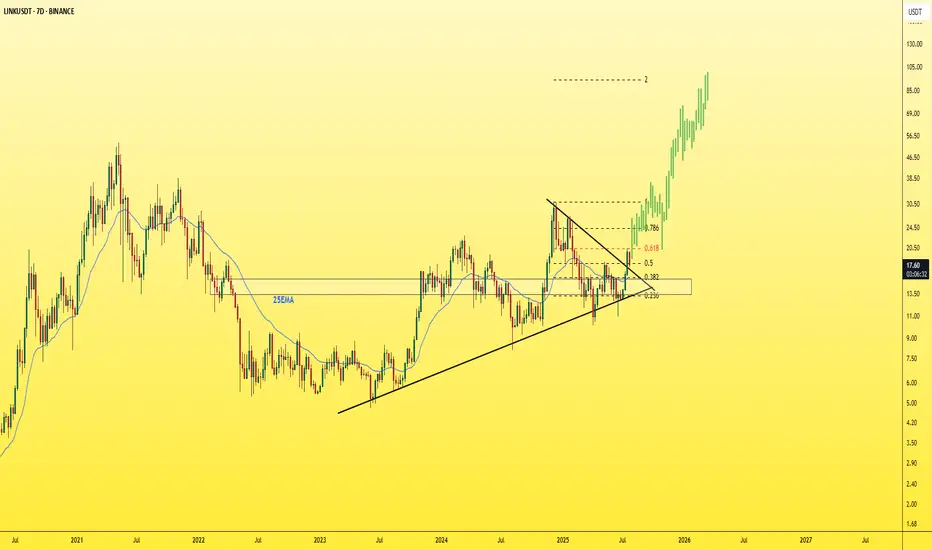
LINK - The sleeping Giant ready to wake!Don't forget to add LINK to your watchlist — it's a solid project with long-term investment potential.
The weekly chart shows that LINK is currently retesting the downtrend line it recently broke — a textbook bullish retest.
The lower trendline now acts as a key support level, and as long as price holds above it, the structure remains healthy.
Currently trading around $17.6, the price hasn’t moved significantly yet —
You’ve got:
✅ A strong fundamental project
✅ A bullish technical setup
✅ Large market cap
✅ Still early entry
What more do you need to enter?
Accumulate now... and thank me later.
Best Regards:
Ceciliones🎯
GOLD XAUUSD Gold moving as expected respecting our price and entries, will look for swinging opportunities ,and SL adjustments to BE
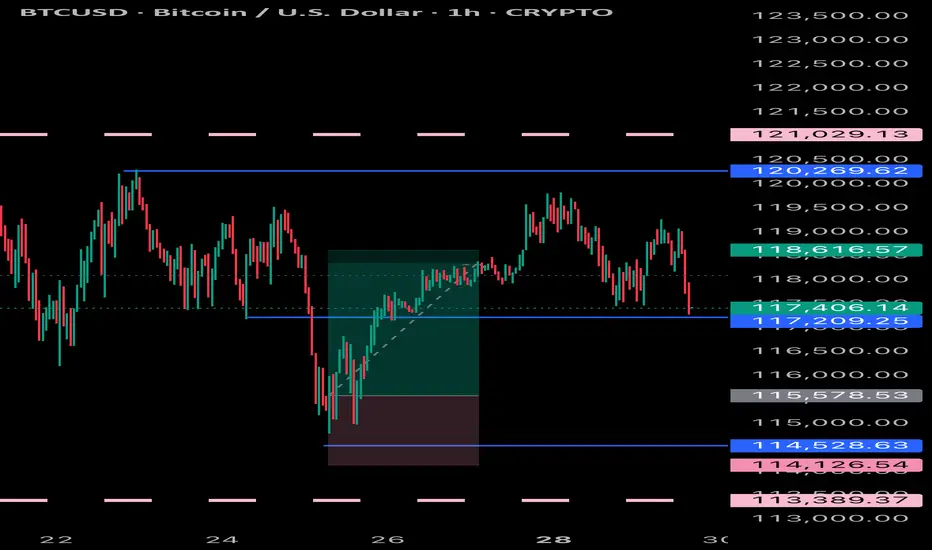
TradeCityPro | Bitcoin Daily Analysis #139Welcome to TradeCity Pro!
Let's go over Bitcoin's analysis. Today, Bitcoin is showing some signs regarding its next move, and today could be a critical day — especially considering that U.S. interest rate data is set to be released tomorrow.
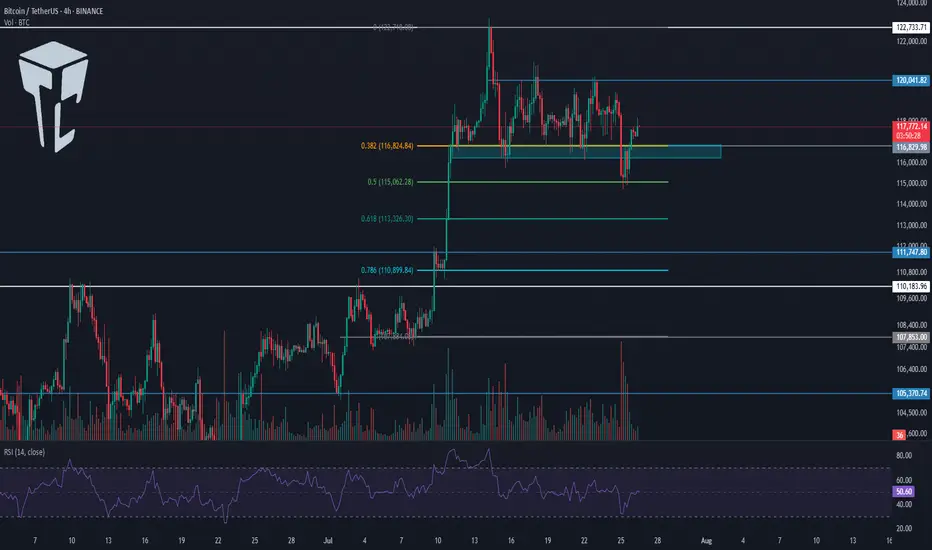
4-Hour Timeframe
Today, there’s no need to switch to other timeframes — this 4-hour chart tells us everything.
Yesterday, the price was moving toward the 120041 area, which we intended to use as a long trigger, but that didn’t happen. The price failed to stabilize above this level, and RSI was rejected from the 61.67 zone.
Currently, the price has formed a lower high compared to 120041 and is now moving toward the support area around 116000.
Selling volume has significantly increased, which is not good for the bullish trend. If this support level breaks, deeper corrections to the 0.618 or even 0.786 Fibonacci levels could occur.
I’ll take profit on my long position that I opened from below 110000 if the price stabilizes below this zone, but I absolutely won’t open any short positions for now.
In my opinion, as long as the price is above 110000, any drop or correction is simply a better entry point for a long position. However, we shouldn’t buy during a falling market — we must wait for our triggers to activate.
GOLD - One n Single Area, what's next??#GOLD... market just reached at his ultimate area as we discussed in our last week analysis and in Friday analysis as well.
The area is 3309-10
Keep close and don't be lazy here.
NOTE: we will go for cut n reverse below 3309 in confirmation.
Good luck
Trade wisley

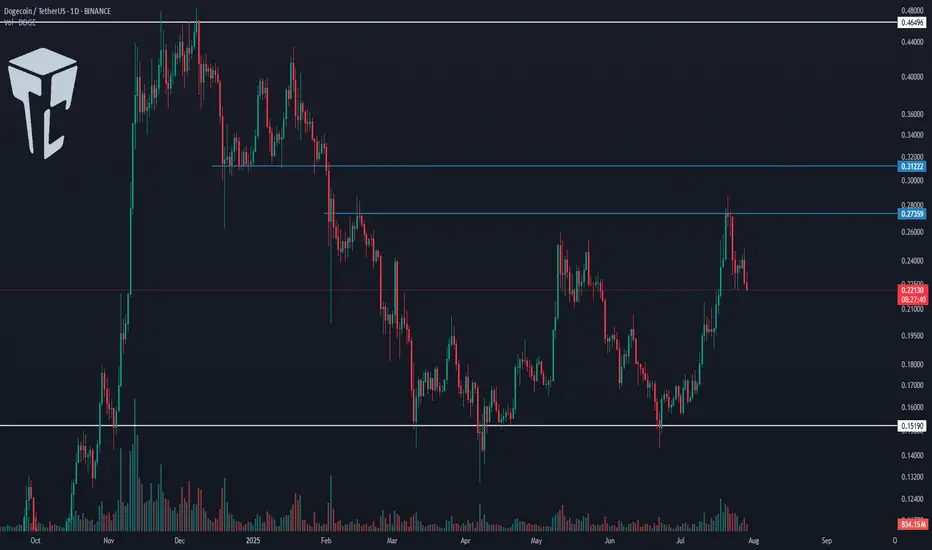
TradeCityPro | DOGE Faces Resistance with Altseason Tailwinds👋 Welcome to TradeCity Pro!
In this analysis, I want to review the DOGE coin for you. One of the first and most popular shitcoins in crypto, which managed to attract a very strong market cap during the previous bull run due to the hype around Elon Musk.
🔍 Currently, this coin has a market cap of $34.06 billion and ranks 8th on CoinMarketCap.
📅 Daily Timeframe
In the daily timeframe, this coin has created a very strong support level at 0.15190, and now after a bullish leg, it has formed a top at 0.27359.
📊 The buying volume increased nicely during this bullish leg, and the price moved up to the 0.27359 resistance.
✔️ Now, after the first touch, the price has started a slight correction and is moving downward. If further touches occur, we can open a long position after breaking the top.
📈 Breaking 0.27359 could be one of those positions that stays open all the way up to 0.46496, and we can buy this coin in spot using the profit from that trade. I will try to have a position open after breaking 0.27359, aiming for 0.46496.
💥 The next trigger we have is the break of 0.31222, but the price should first form some structure after reaching that area, and only after confirmation should we open a position. Just entering based on that break doesn’t seem logical to me.
🔽 If a correction and drop happen, as long as the price stays above 0.15190, there’s no problem for the trend to continue. But if the price stabilizes below that level, a trend reversal might occur.
📝 Final Thoughts
This analysis reflects our opinions and is not financial advice.
Share your thoughts in the comments, and don’t forget to share this analysis with your friends! ❤️
EURNZD Update: This short trigger could spark a waterfall dropYo traders, Skeptic from Skeptic Lab! 🩵 EURNZD just broke its daily upward trendline, setting up a sharp drop. Weekly shows a fading uptrend. Daily’s got a strong bearish candle, full body, no buyer fight. 4H trendline broke and... more on this video:)
👀Beware of fakeouts this week—volatility’s high! Trade smart, keep risk tight, and don’t FOMO. Share your thoughts in the comments, boost if it helps <3

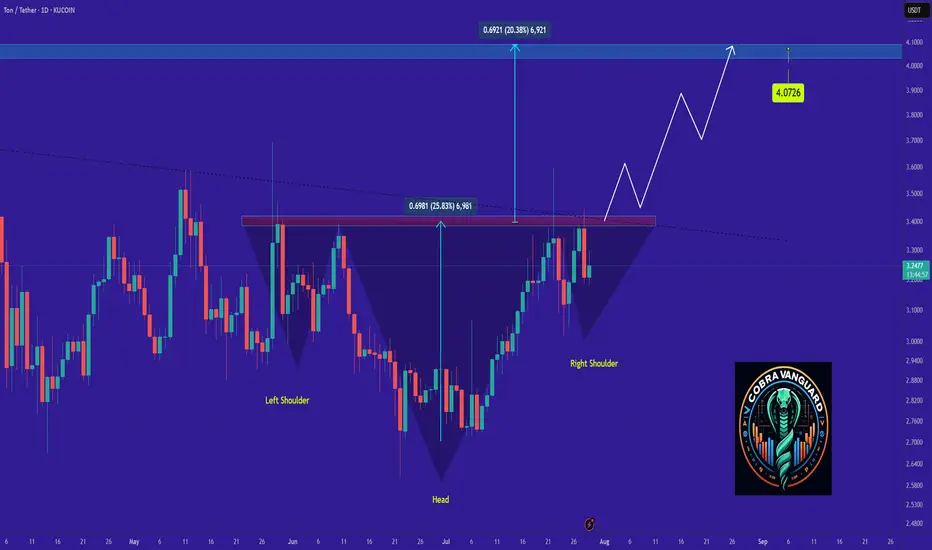
we shall see a good amount of increase in TON price !It seems the price is forming a head and shoulders pattern, which, if correct, suggests a good price increase in the coming days. However, we should wait for the pattern to fully complete.
Best regards CobraVanguard.💚
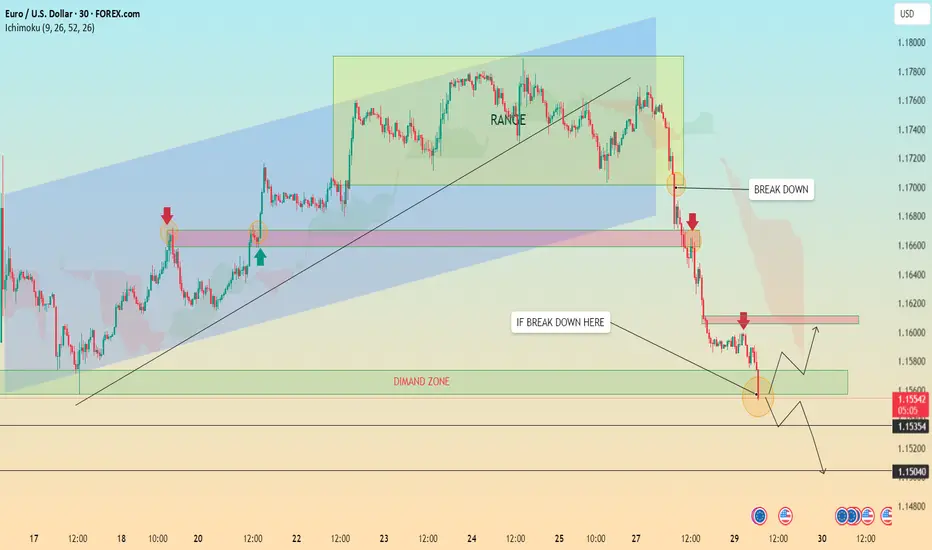
EURUSD Breakdown Bearish Trend Continues or Demand Zone Reversal🔍 Chart Breakdown: EUR/USD (30-min TF)
Trend Overview:
Previous Trend: Bullish channel structure (highlighted in blue).
Current Momentum: Strong bearish breakdown following a clear range phase.
The chart shifted from consolidation → breakdown → aggressive bearish continuation.
🧱 Key Technical Highlights:
1. Bearish Breakout:
Price broke below the ascending trendline and exited the ranging box, confirming a bearish shift.
Multiple Breakdown Retests (highlighted with red arrows) confirming structure failures and validating resistance zones.
2. Range Zone (Distribution Phase):
Price moved sideways within the green rectangle (“RANGE”), indicating accumulation/distribution before the selloff.
The breakdown from this range confirmed bearish momentum.
3. Demand Zone Test (Now in Play):
Price is approaching/hovering around a demand zone (green box) marked as a critical support.
Buyers may react here, offering two key scenarios:
Bounce back to retest resistance around 1.1600 (highlighted).
Breakdown below demand, leading to further decline toward next major support zones (1.15354 and 1.15040).
4. Price Reaction Zones:
🔴 Resistance zones are clearly marked where breakdown retests occurred.
🟢 Demand zone with bounce-or-break logic provides directional bias.
🧭 Potential Scenarios (Marked on Chart):
✅ Bullish Case:
If demand zone holds, expect:
A corrective rally toward 1.1600–1.1620.
Watch for rejection signals here (could be ideal for re-entering shorts).
❌ Bearish Case:
If breakdown below green demand zone occurs, targets:
1.1535 (local structure support)
1.1504 (next confluence level; possible long-term bounce area)
📈 Indicators:
Ichimoku Cloud: Price is well below the cloud, confirming bearish control.
Structure: Lower highs & lower lows = confirmed bearish trend.
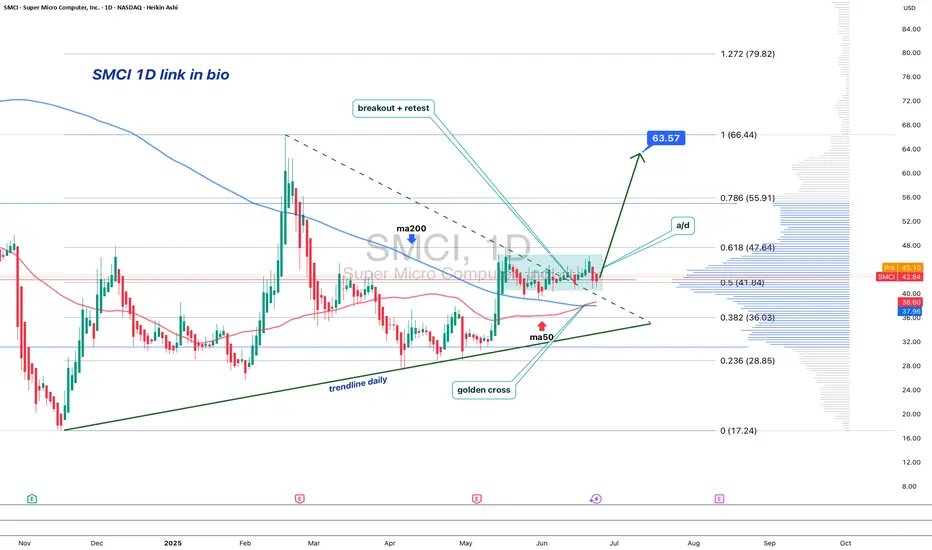
SMCI: When a chart says it’s time to reconnect with the AI hypeOn the daily chart, Super Micro Computer Inc. (SMCI) is showing a clean bullish setup. Price broke out of a descending trendline (green dashed), confirmed it with a retest, and is now consolidating above the breakout zone. The golden cross — where the MA50 crossed above the MA200 — confirms a long-term trend reversal.
Volume profile indicates strong accumulation near $41–43. The 0.5 Fibonacci level at $41.84 acted as support. Above the current range, there’s low volume resistance up to $63.57 (0.786), followed by $66.44 and a final extension target at $79.82 (1.272).
Fundamentals: SMCI is a leading server hardware manufacturer. Demand for their systems has soared with the explosion of AI infrastructure. The company maintains solid financials, with rising quarterly revenue and growing presence in the cloud sector. Institutional investors have been actively increasing their positions since late 2023 — a sign of strong long-term conviction.
Tactical plan:
— Entry: market $42–43
— Target 1: $55.91
— Target 2: $63.57
When technicals scream textbook breakout and fundamentals bring AI momentum to the table — it might just be one of the best late entries in the AI wave this summer.
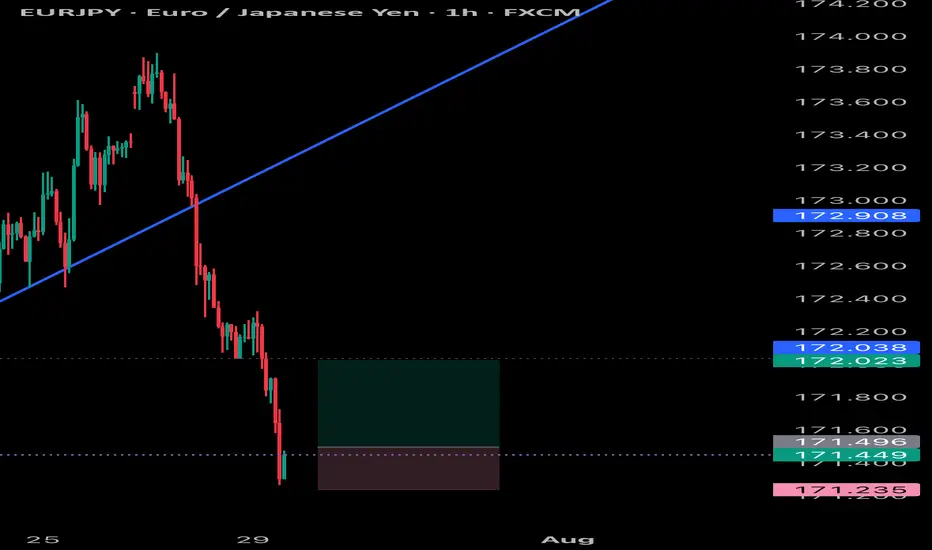
EURJPY SCALP Eurjpy quick scalp trade as it can still drop so it would be wise to not target higher than normal take profits , but will scalp it
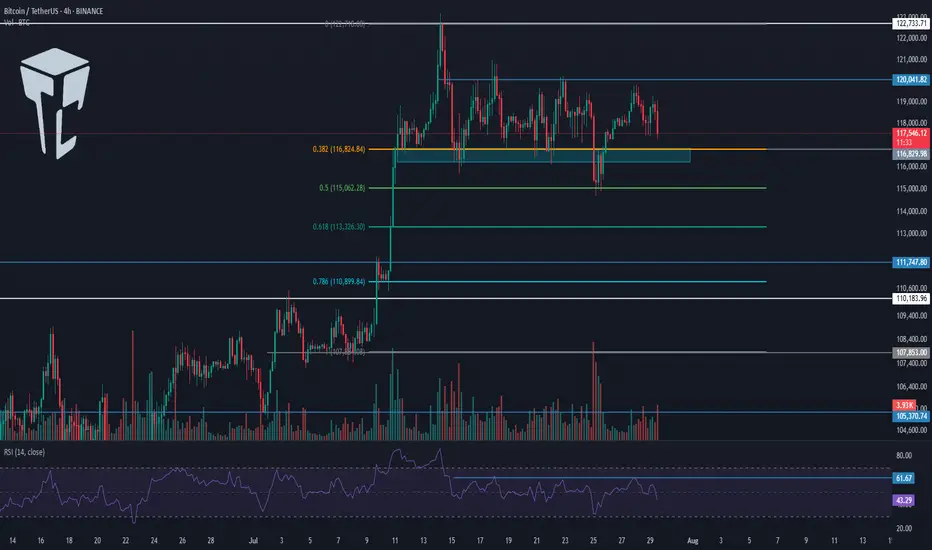
TradeCityPro | Bitcoin Daily Analysis #138👋 Welcome to TradeCity Pro!
Let’s get into the Bitcoin analysis. Today is the start of the week, and it’s very important to begin our trading week with the right analysis and outlook.
📅 Daily Timeframe
On the daily timeframe, as you can see, not much has changed compared to the previous analysis, and the price is still ranging near the supply zone.
✔️ The fact that no price correction has occurred so far shows the strength of the buyers, and even if a correction does happen, as long as the price stays above 110183, the trend will still be considered bullish.
🧩 The main trigger for trend continuation is either the price reaction to the curved trendline or the break of 122733. We can find more optimal triggers in the lower timeframes.
⏳ 4-Hour Timeframe
In this 4-hour timeframe, after a fakeout below 116829, the price corrected down to the 0.5 Fibonacci level and now has returned again to the box between 116829 and 120041.
🔍 The fakeout trigger is 120041, and I’ll try to have at least two positions open in the market when this level breaks — whether on Bitcoin or altcoins.
📈 The main trigger for the next bullish leg is 122733.
If RSI also breaks the 61.67 resistance alongside 120041, the likelihood of the move continuing will increase.
❌ Disclaimer ❌
Trading futures is highly risky and dangerous. If you're not an expert, these triggers may not be suitable for you. You should first learn risk and capital management. You can also use the educational content from this channel.
Finally, these triggers reflect my personal opinions on price action, and the market may move completely against this analysis. So, do your own research before opening any position.
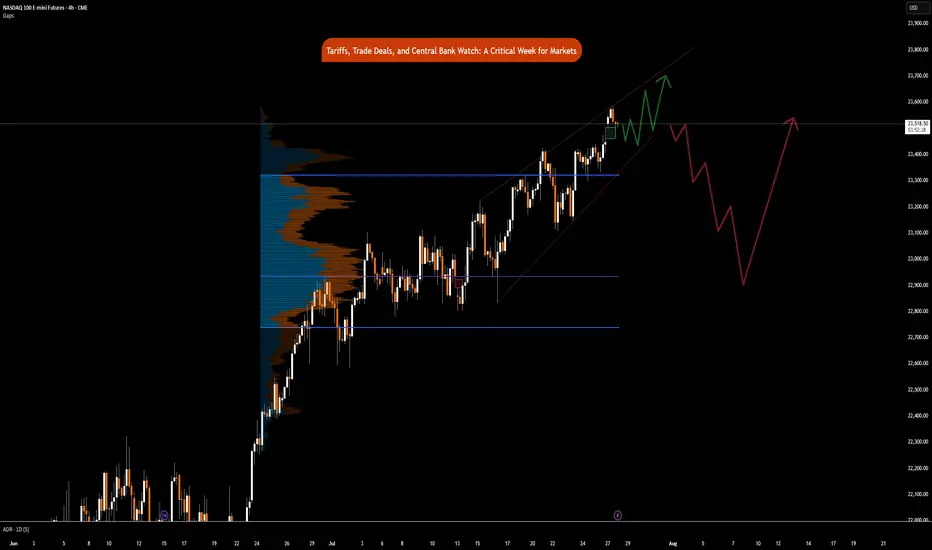
Tariffs, Trade Deals, & Central Bank Watch: Key Week in MarketsCME_MINI:NQ1! CME_MINI:ES1! CME_MINI:MNQ1! COMEX:GC1! CME_MINI:MES1! NYMEX:CL1!
This is a significant week in terms of macroeconomic headlines, key data releases, central bank decisions, and major trade policy developments. We get numbers for growth, inflation and decision and insights into monetary policy. Combining this with ongoing trade policy developments, we have a key week which may shape how the rest of the year unfolds.
Below is a consolidated summary of the latest trade negotiations, scheduled economic releases, and policy outlooks.
US - EU Trade Deal:
• US–EU Tariffs: The US will impose a 15% tariff on most EU goods, including cars, semiconductors, and pharmaceuticals, but retain a 50% tariff on steel and aluminium with a new quota system.
• Exemptions: Zero-for-zero tariffs agreed for agriculture, aircraft parts, and chemicals; aircraft exports are temporarily exempt.
• EU Commitments: The EU will invest $600 billion in the US and purchase $750 billion in US energy, mainly LNG.
• Agriculture: The EU will lower tariffs on many US agricultural goods, though not comprehensively.
• Political Reactions: EU leaders are mixed, Germany and the Netherlands praised the deal, France called it unbalanced, and Hungary viewed it unfavorably.
• The deal is not final until it is ratified by all EU national parliaments and the EU Parliament.
China Talks: US and China expected to extend their trade truce by 90 days. US-China meeting expected in Stockholm on Monday and Tuesday. Trump to freeze export controls to secure a deal. A group of US executives will visit China for trade discussions, organized by the US-China Business Council.
South Korea Trade Talks: Korea proposes a shipbuilding partnership with the US and is preparing a trade package.
UK–US Relations: PM Starmer and Trump to meet in Scotland to discuss the UK–US trade deal implementation, Middle East ceasefire, and pressure on Russia.
Thus far, the US has announced trade deals with the UK, Vietnam, Philippines, Indonesia, Japan and The EU. Trade delegations are working to finalize deals with China, Mexico, Canada
Key Economic Data Releases:
Monday: Treasury refunding financing estimates.
Supply: 2-Year and 5-Year Note Auction, 3 & 6-Month Bill Auction
Tuesday: US Advance Goods Trade Balance, Wholesale Inventories Advance, CB Consumer Confidence, JOLTS Job Opening (Jun), Atlanta Fed GDPNow, Australian CPI Q2
Supply: 7-Year Note Auction
Wednesday: German GDP Q2, EUR GDP Q2, US ADP Non-farm Employment, US GDP Q2, Crude Oil Inventories, Chinese Manufacturing PMI
Canada: BoC Interest Rate Decision, Rate Statement, Monterey Policy Report, BoC Press Conference
US: Fed Interest Rate Decision,FOMC Statement, Fed Press Conference.
Japan: BoJ Interest Rate Decision, Monetary Policy Statement
Thursday: EU Unemployment (Jun), US PCE & Core PCE Price Index (Jun)
Japan: BoJ Press Conference
Friday: EU CPI, US NFP, Unemployment Rate, Average Hourly Earnings, ISM Manufacturing PMI, Michigan 1-Year & 5-Year Inflation Expectations.
It is also a busy earnings week. See here for a complete earnings schedule .
Markets are interpreting trade deals as positive news thus far. The dollar is strengthening.
As we previously mentioned, we anticipate no rate cuts this year as economic data proves to be resilient and inflation largely under control. WSJ also posted an article stating that most tariffs costs are being absorbed by companies due to weaker pricing power. We previously wrote about this on our blog: “ In our analysis, the inflation impact of tariffs may not show up until Q4 2025 or early 2026, as tariff threats are mostly used as a lever to negotiate deals. While effective tariff rates have increased, as Trump reshapes how tariffs are viewed, cost pass-through to consumers will be limited in Q3 2025, as companies’ front-loaded inventory helps mitigate the risks of increased tariff exposure.
So, what we have is an interesting development shaping up where, while inflation may rise and remain sticky, it is yet to be seen whether slowing consumer spending will weaken enough to the point where companies must start offering discounts, which would nullify the tariff risk to the end consumer and result in companies absorbing all tariffs. This scenario will see reduced earnings margins leading into the last quarter and early 2026. However, it will materially reduce risks of higher inflation.”
In our view, the US dollar has a higher probability to rally in the short-term i.e., Q3 as markets re-align FX rate differentials. Bond yields stabilize, Equities continue pushing higher, while Gold retraces as previously mentioned. This in our view, is what investors and participants refer to as the Goldilocks scenario. If this plays out as expected we anticipate continued strength with AI, tech, energy and defense sectors outperforming into mid- 2026.
Institutional View: Morgan Stanley
Morgan Stanley also sees no rate cuts in 2025, despite market pricing for two 25 bps cuts. They forecast more aggressive cuts in 2026 due to:
• Tariff-related inflation emerging before labor market deterioration
• Slowing US growth, as fiscal support fades
• Impact of tighter immigration policy and global trade realignment
That said, MS continues to cite longer-term risks to the dollar, including:
• Twin deficits (fiscal + current account)
• Ongoing debate around USD’s safe haven status
• USD hedging activity picking up by international investors
• Strained credibility of the Fed due to tension between Fed Chair and the US Administration
How Fed policy evolves in Q4 2025 and Q1 2026 will depend heavily on the incoming Fed Chair nominee, who is expected to replace Jerome Powell in May 2026. This nomination could significantly influence future policy direction around growth and inflation targets.
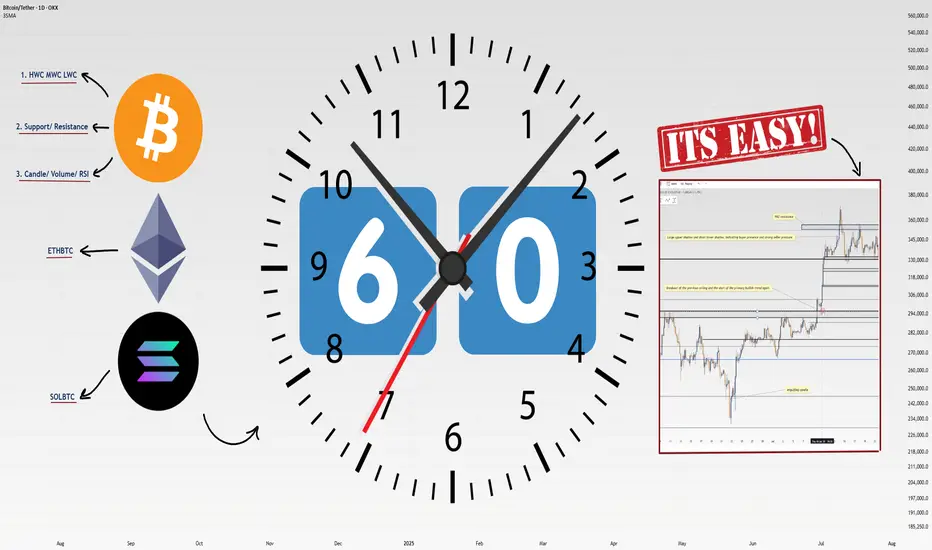
How I Analyze Any Coin in 60 Seconds: 4-Step Masterclass!Heyy traders, it’s Skeptic from Skeptic Lab! 🩵 I’m breaking down my lightning-fast method to analyze any coin in just 60 seconds . This 4-step process is how I spot long/short triggers like a pro. Buckle up, let’s dive in:
✔️ Step 1: Identify HWC/MWC/LWC (10 seconds)
Nature’s got a cool vibe—bet a lot of you hit the outdoors on weekends. When I see an apple tree from afar, it’s majestic, but up close, I spot branches and worm-eaten fruit. From a distance, I miss the details; up close, I lose the tree’s grandeur. Markets work the same. You need different timeframes to grasp the market structure. With practice in Dow Theory, trends, and tools, spotting HWC (Higher Wave Cycle), MWC (Mid Wave Cycle), and LWC (Lower Wave Cycle) becomes second nature. For me, this takes 10 seconds.
Want a full HWC/MWC/LWC guide? Check my free article I wrote a while back—it’s a hands-on tutorial ( link Cycle Mastery ).
📊 Step 2: Draw Support/Resistance Lines (20–30 seconds)
I start with higher timeframes: Monthly, then Weekly, then Daily. Once I’ve drawn lines up to Daily, I don’t always redraw for lower timeframes—often, I just adjust them.
Pro tip : Give more weight to the right side of the (recent data) since it’s fresher and more valuable. I change line colors for 4-hour lines, so I know they’re less critical than Daily. I don’t draw lines below 4-hour, but if you’re a scalper, tweak this to your strategy. This step takes me 20–30 seconds, the longest part.
📉 Step 3: Analyze Candles, Volume, Oscillators, and Indicators (10–15 seconds)
Here, I check everything I can: candles, volume, oscillators, and indicators . The goal? Stack confirmations for my triggers. Think RSI hitting overbought, volume spikes, larger candle sizes, or momentum surges—you get the vibe. This step’s length depends on your tool mastery. For me, it’s quick because I know what to look for.
🔔 Step 4: Check Coin Dominance (5–10 seconds)
This is the most critical yet simplest step. We need to track where liquidity’s flowing . For example, if SOL/BTC is bearish, I skip buying Solana—liquidity’s exiting. BTC.D (Bitcoin Dominance) is also key. The relationships dominance creates are complex and don’t fit in one analysis, but if you want a full dominance tutorial, drop it in the comments!
🔼 Key Takeaway: Using these 4 steps—HWC/MWC/LWC, support/resistance, candles/indicators, and dominance—I analyze any coin in 60 seconds. Your speed depends on experience and knowledge. If you’re new, this might take 60 minutes per coin, but don’t sweat it— practice makes you lightning-fast . Thanks for vibing with this educational idea! <3 I’ll catch you in the next one—good luck, fam!
💬 Let’s Talk!
Want a dominance tutorial or more tips? Hit the comments, and let’s crush it together! 😊 If this guide lit your fire, smash that boost—it fuels my mission! ✌️
AUD/CAD’s Big Move: Don’t Sleep on This Breakout Setup!Hey traders, Skeptic from Skeptic Lab here! 🔥 While everyone’s freaking out over interest rate news and Non-Farm Employments , AUD/CAD ’s stealing the show on the daily time frame.
📉Post-tariff crash, it’s rebounding strong. A daily resistance break could kick off a major uptrend. Use RSI overbought/oversold ( linked in my TradingView article ) to confirm momentum.
👀Beware of fakeouts this week—volatility’s high! Trade smart, keep risk tight, and don’t FOMO. Share your thoughts in the comments, boost if it helps <3 🩵

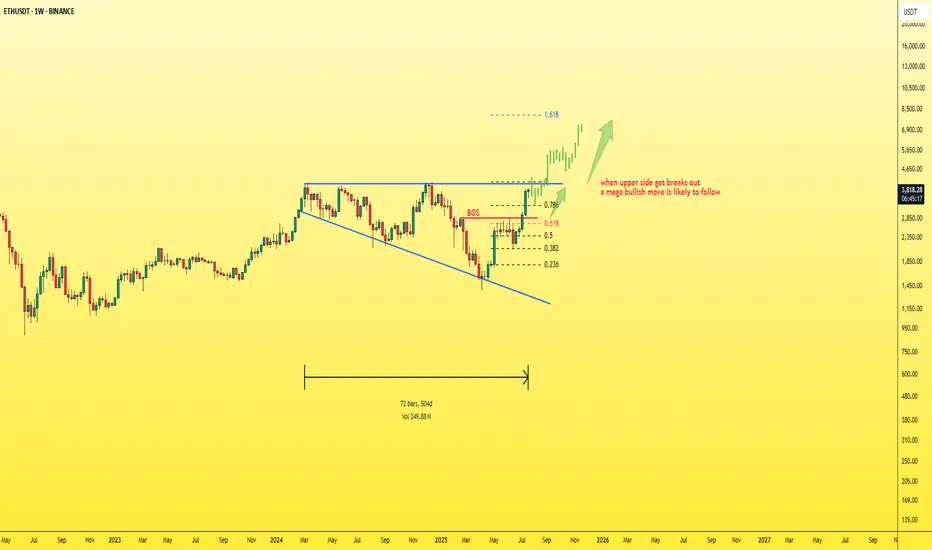
ETH - simple chart and mega moveEthereum is currently the strongest and most stable asset in the market, especially after many had lost hope in it.
Now, Ethereum is back with strength, and it’s just a few steps away from breaking out of the current pattern.
📈A breakout above the upper boundary will likely lead to a new all-time high (ATH) for ETH.
My projection: Ethereum could surpass $7,000 before the end of 2025.
Best regards:
Ceciliones🎯
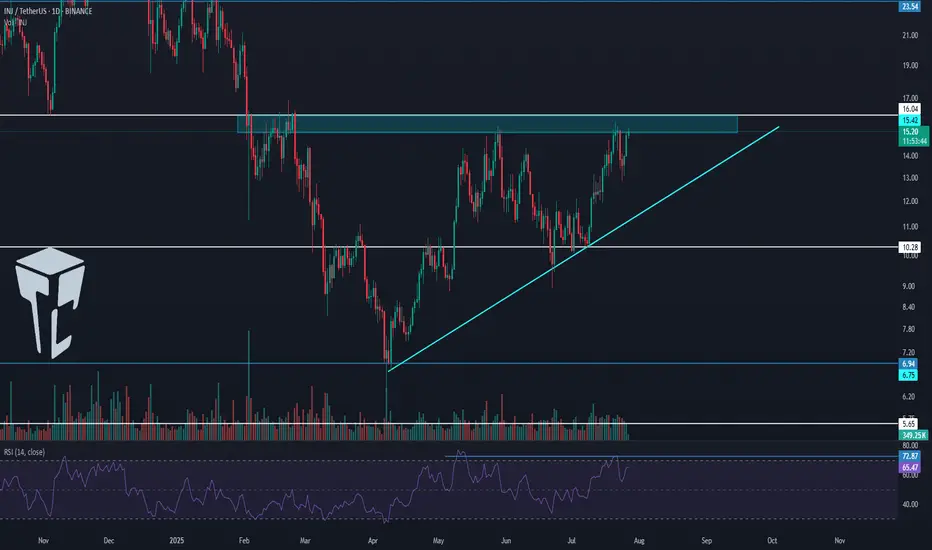
TradeCityPro | INJ Battles Key Resistance Amid Altseason Buzz👋 Welcome to TradeCity Pro!
In this analysis, I want to review the INJ coin for you. It’s one of the RWA and AI projects, currently ranked 63 on CoinMarketCap with a market cap of $1.51 billion.
📅 Daily Timeframe
On the daily timeframe, after a drop to the 6.94 level, this coin has bounced back and is now moving upward along with a rising trendline.
✨ A strong support has formed at 10.28, and after price reacted to this level, a new bullish leg started and pushed the price up to 16.04.
🔔 There is a Maker Seller zone around 16.04 that has repeatedly prevented the continuation of the upward move, and currently price is struggling with it again.
📈 Breaking this zone will initiate a new phase of the trend. I plan to have a long position open if 16.04 is broken.
🛒 This trigger is also suitable for spot buying, and if Bitcoin pair and Bitcoin dominance confirm the move, we can consider buying in spot too. But personally, I prefer opening a futures position.
💥 Breaking the 72.87 zone on the RSI will be a solid confirmation for the entry of bullish momentum, and with this breakout, a new bullish leg can begin.
🔽 If a correction happens, I will wait for the trendline to break and will not open a short position for now.
Currently, the first trigger we have for a short is at 10.28.
📝 Final Thoughts
This analysis reflects our opinions and is not financial advice.
Share your thoughts in the comments, and don’t forget to share this analysis with your friends! ❤️
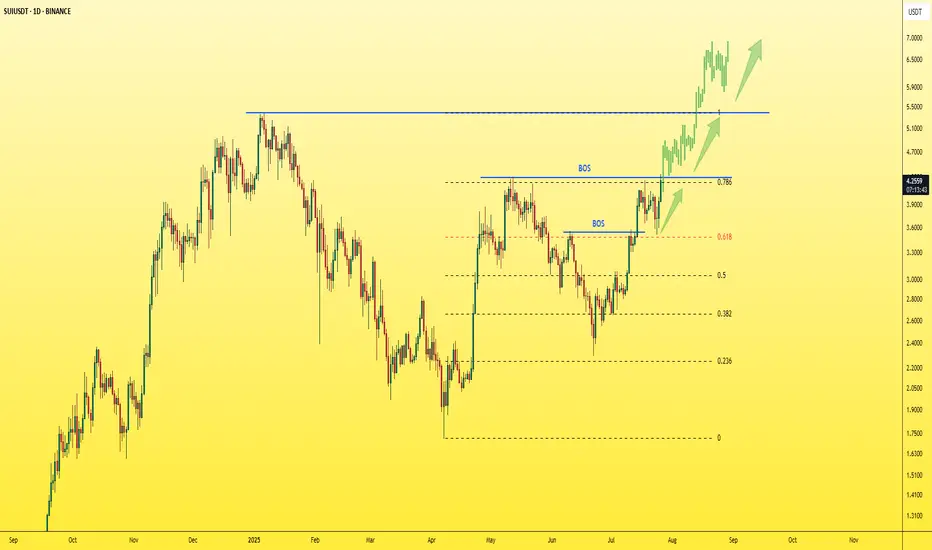
SUI - Just one step away from the explosion!The last candle on the daily chart just confirmed a BOS (Break of Structure) — a clear and strong sign of bullish continuation for the asset.
✅ This is a textbook entry for a long position.
🎯 Next target: $5 — and so far, no bearish signs in sight.
Best regards,
Ceciliones 🎯
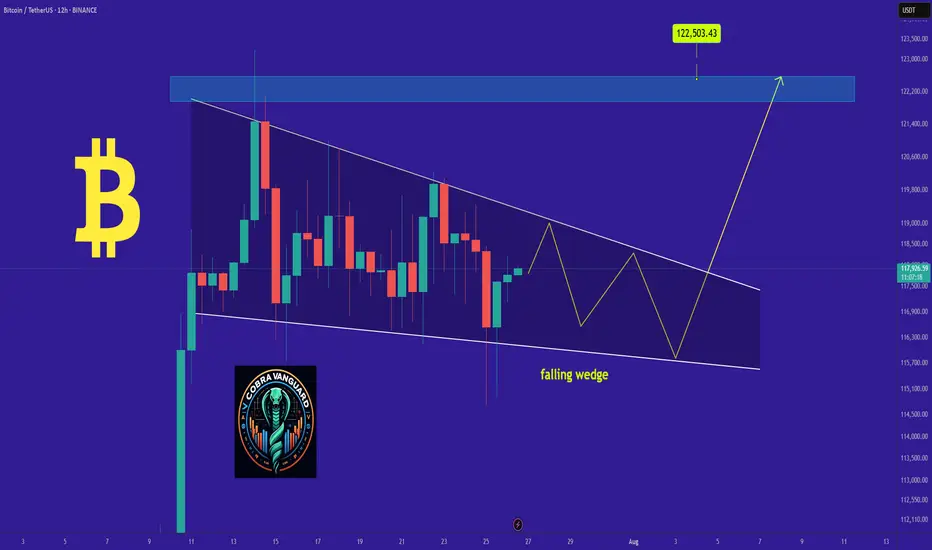
BITCOIN's Situation (12h) !!!So if you pay attention to the TON chart you can see that the price has formed a Ascending wedge which means it is expected to price move as equal as the measured price movement.( AB=CD )
NOTE: wait for break of the WEDGE .
Best regards CobraVanguard.💚
TradeCityPro | Bitcoin Daily Analysis #137👋 Welcome to TradeCity Pro!
Let’s go over the Bitcoin analysis. I’m making a change to how I analyze Bitcoin — I will no longer include indicators like dominance charts.
🔍 From now on, I’ll be analyzing Bitcoin in daily, 4-hour, and 1-hour timeframes only.
📅 Daily Timeframe
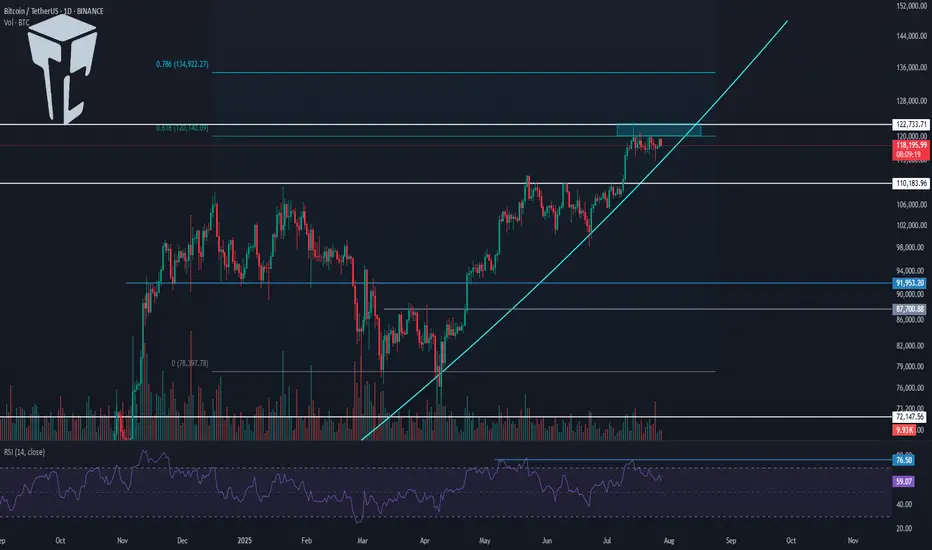
On the daily timeframe, Bitcoin is in a strong uptrend that started from the 78,397 level and in two bullish legs has reached the 122,733 zone.
✅ This level, along with the 0.618 Fibonacci Extension, has created a strong resistance zone. Although price has attempted multiple times to break into or above this area, it has not yet succeeded in closing a candle above or inside the range.
🎲 We also have a curved trendline from higher timeframes, which the price is reacting to even on the daily chart. Currently, the price is near this trendline. There is a possibility that price consolidates over time until it reaches this trendline and then begins its next bullish leg.
📊 If that happens, breaking 122,733 or 120,140 would be triggers for opening a long position on the daily timeframe.
I do not recommend buying Bitcoin on spot right now, because I believe we’re close to the top of this bullish cycle, and this current leg might be the last one.
⭐ A breakout of 76.50 on the RSI would be a strong confirmation of bullish momentum, and would mark the continuation of the uptrend.
🔑 If we get a pullback, the price could correct to dynamic zones like SMA25 or SMA99. Important static support levels are at 110,183 and 100,763.
⏳ 4-Hour Timeframe
In the 4-hour chart, we can see more details of the bullish leg. After the sharp move to 122,733, a correction phase began, forming a range box.
💥 The bottom of the box is around 116,829, which I’ve marked as a zone. It also overlaps with the 0.382 Fibonacci, making it a very important PRZ (Potential Reversal Zone).
The top of the range is at 120,041.
🧩 Yesterday, price made a fakeout to the downside. As you can see, it dumped hard with heavy selling volume and hit the 0.5 Fibonacci level, but couldn’t hold there and quickly bounced back above 116,829.
🧲 Today, I think it's better not to go below the 4-hour timeframe and avoid getting caught up in small market noise.
A break above 120,041 can trigger a long entry.
Another breakdown from the box might trigger a deeper correction.
❌ Disclaimer ❌
Trading futures is highly risky and dangerous. If you're not an expert, these triggers may not be suitable for you. You should first learn risk and capital management. You can also use the educational content from this channel.
Finally, these triggers reflect my personal opinions on price action, and the market may move completely against this analysis. So, do your own research before opening any position.
BITCOIN RESULTS Bitcoin has respected the analysis and held very well it’s been following the trend and can partial close some positions and wait for a nice pullback to buy the dip