TradeCityPro | ADA: Watching Support and RSI for the Next Move👋 Welcome to TradeCity Pro!
In this analysis, I want to review the ADA coin for you—one of the most popular and long-standing cryptocurrencies, currently ranked 10th on CoinMarketCap with a market cap of $22 billion.
📅 Daily Time Frame
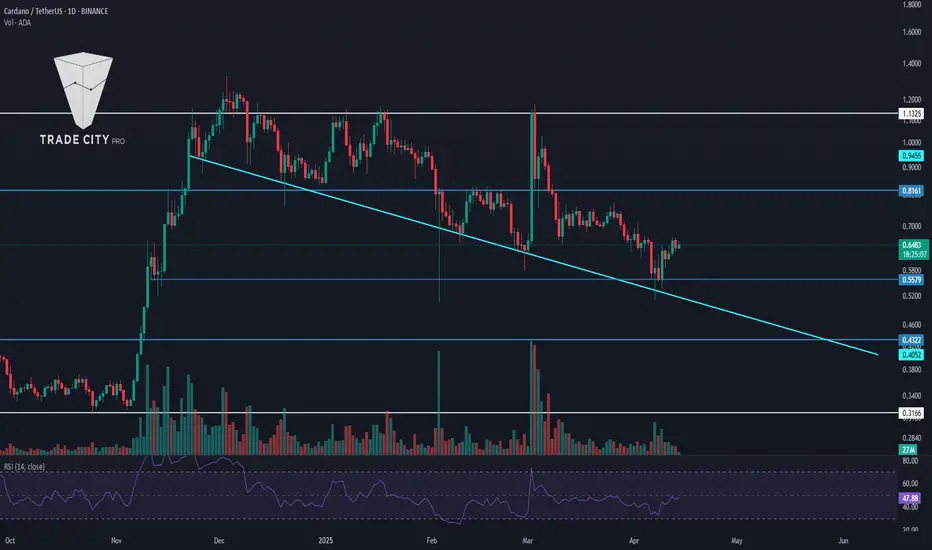
In the daily time frame, as you can see, after ADA’s previous uptrend, the price moved upward and, after breaking 0.4322, continued its bullish leg up to 1.1325.
✔️ Following this move, the price entered a corrective phase, and during its first pullback, it performed a time-based correction down to 0.8161, but after breaking this area, deeper corrections began.
📰 Coinciding with the news of the creation of a crypto reserve in the U.S., this coin—alongside other coins in that basket—saw another bullish move that once again pushed the price up to 1.1325. However, within a few days, it reversed the entire bullish move and dropped to the 0.5579 zone.
📈 During this correction, we can draw a trendline from the price lows. As you can see, the price has reacted well to this trendline, and the overlap of this line with the 0.5579 zone has created a strong support, causing the price to bounce and show some bullish momentum.
📊 Currently, after bouncing from this zone, the price initially moved up strongly and with high volume. However, over the past few days—especially with the weekend—momentum has decreased, and volume has dropped as well.
📉 If this decline in volume continues, the price won’t be able to rise further, and bearish momentum could gradually return. If the 0.5579 support breaks, the price could continue moving downward.
💥 The downward trendline currently in play could act as a dynamic resistance during the next bullish legs.
🔼 For a bullish move, the key is the RSI divergence. This positive divergence, now visible with three higher lows, could support a bullish reversal. The trigger for this divergence is a break above the 50 level on RSI.
🛒 If RSI stabilizes above this level, bullish momentum will likely enter the market. In that case, breaking the 0.8161 trigger would offer a long entry or spot buy opportunity. The main trigger for price, however, remains the break of 1.1325, which is ADA's key resistance level.
📝 Final Thoughts
This analysis reflects our opinions and is not financial advice.
Share your thoughts in the comments, and don’t forget to share this analysis with your friends! ❤️
Tradingview
#TOTAL3 #Analysis #Eddy#TOTAL3 #Analysis #Eddy
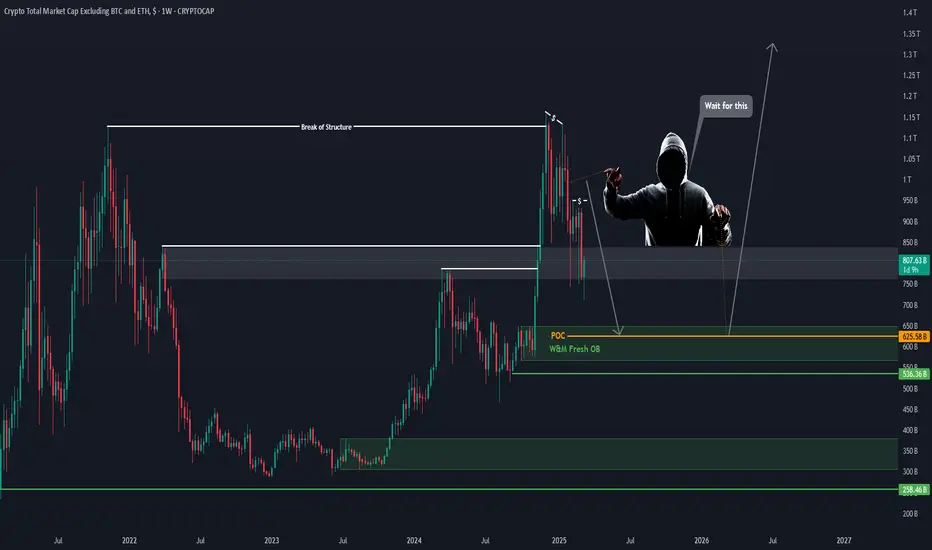
Crypto Total Market Cap Excluding BTC and ETH
Everything is clearly drawn and labeled.
For buy Long & Spot investment on altcoins, wait for the Total 3 index to reach its demand zone.
This is just my opinion and you should make your decision based on your style and strategy and get the necessary confirmations.
Be sure to take a look at this indicator on the monthly time frame.
TradeCityPro | Bitcoin Daily Analysis #60👋 Welcome to TradeCity Pro!
Let’s move on to the analysis of Bitcoin and key crypto indices. As usual, in this analysis I want to review the futures session triggers for New York.
🔍 Yesterday, both of the long triggers I gave were activated, and the price moved upward. Today is also an important day, and we can look for both long and short positions.
⏳ 1-Hour Time Frame
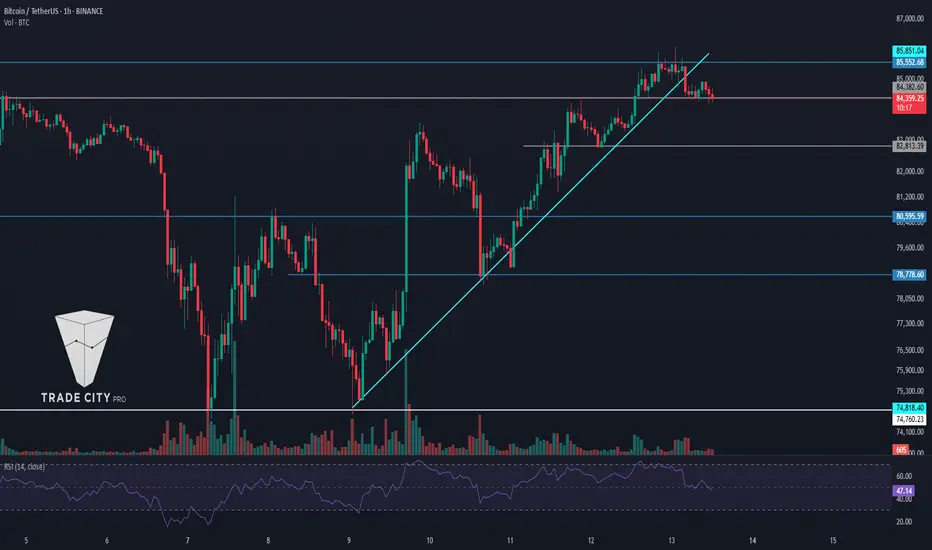
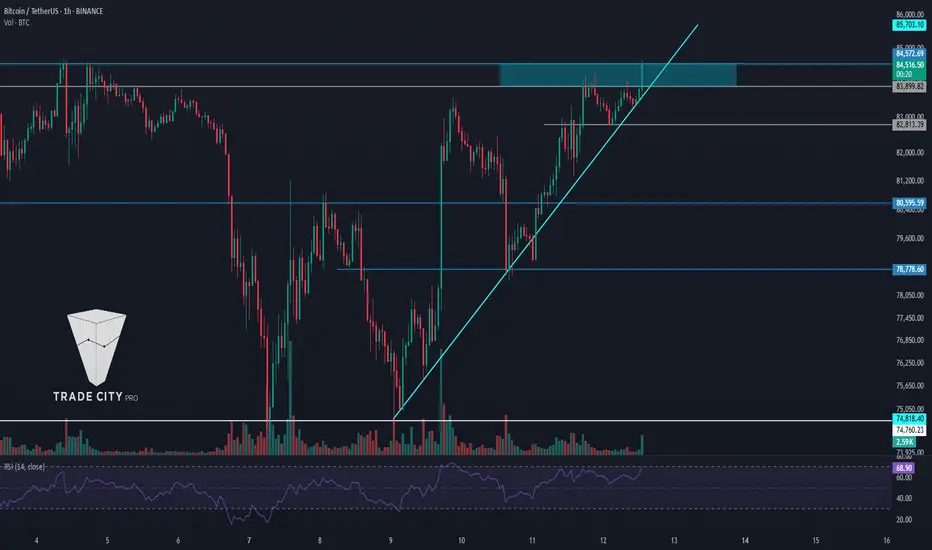
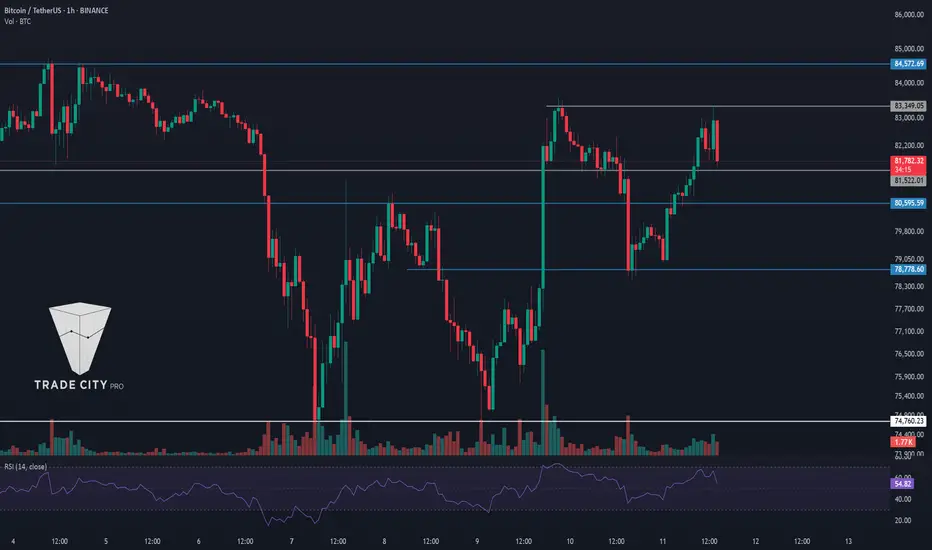
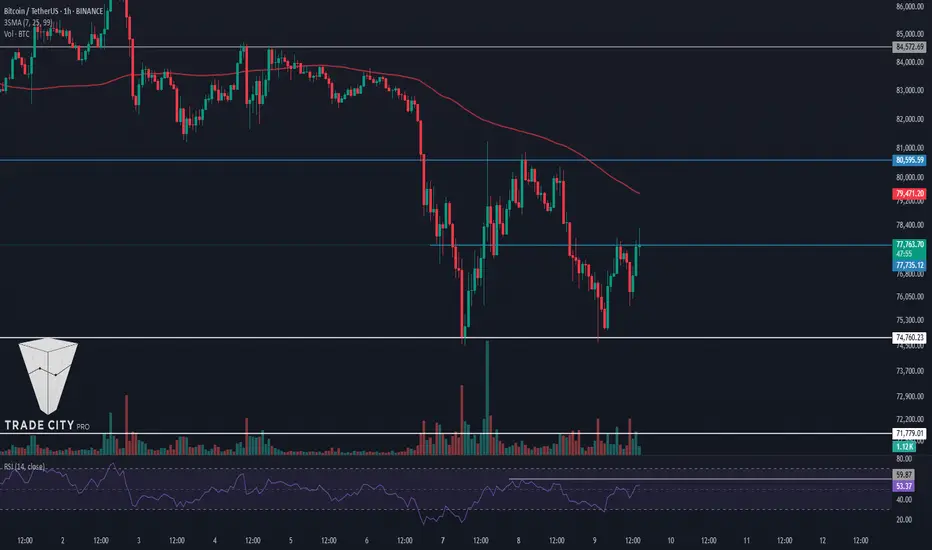
In the 1-hour time frame, as you can see, our long triggers from yesterday — the 83899 and 84572 levels — were activated, and the price moved up to the 85552 zone.
✔️ If the position you opened had a small stop-loss, it likely already hit your target. But if you entered with a wider stop-loss, it probably hasn't reached the target yet, which is reasonable, as your position is longer-term.
⚡️ Now for today, as you can see, the price has broken its ascending trendline and it seems the trendline trigger is getting activated. If a candle closes below the 84382 level, the price is likely to move downward.
📊 The next support the price has is at 82813, and if this level breaks, we can say that the trend has changed and the price might head toward lower lows.
💥 The 50 level on the RSI is also significant, and if the break of 84382 coincides with a break below 50 on the RSI, strong bearish momentum could enter the market.
👑 BTC.D Analysis
Let’s look at Bitcoin Dominance. This index is in a range box between 63.23 and 63.80. There’s also a mid-range level at 63.51 — breaking it would give us temporary confirmation of a bullish move in dominance.
🔽 For bearish confirmation, breaking 63.23 would be suitable.
📅 Total2 Analysis
Now onto Total2: this index hasn't fully stabilized below its trendline yet and still shows slightly more bullish momentum compared to Bitcoin.
📉 For a short position, we have a 966 trigger, but it’s quite risky. Personally, I wouldn’t open my main position with this trigger — I’d wait for confirmation using Dow Theory with a lower high and lower low.
🔼 For a long position, the trigger is clear: we can enter if the 980 level breaks.
📅 USDT.D Analysis
Let’s check Tether Dominance. This index has made a bearish move and dropped to 5.39.
⭐ The next drop trigger is the same 5.39 level, which is a very good one. For a bullish scenario, we currently need to wait for a new structure to form.
❌ Disclaimer ❌
Trading futures is highly risky and dangerous. If you're not an expert, these triggers may not be suitable for you. You should first learn risk and capital management. You can also use the educational content from this channel.
Finally, these triggers reflect my personal opinions on price action, and the market may move completely against this analysis. So, do your own research before opening any position.
TradeCityPro | ARB: Key Levels in DeFi Coin’s Descending Channel👋 Welcome to TradeCity Pro!
In this analysis, I want to review the ARB coin for you. It's one of the DeFi coins, currently ranked 54 on CoinMarketCap with a market cap of $1.41 billion.
⏳ 4-Hour Time Frame
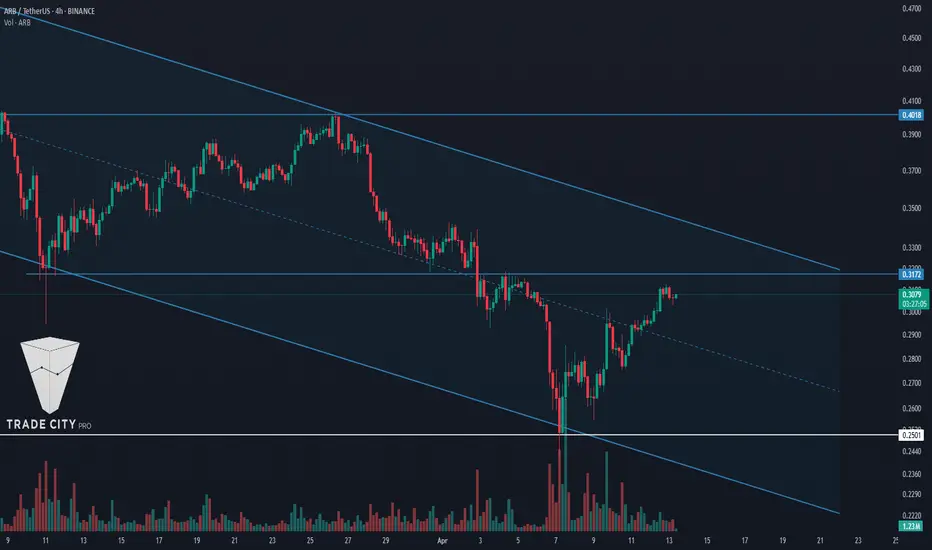
In the 4-hour time frame, as you can see, we're witnessing a downtrend within a descending channel, and the price is moving downward.
✔️ There is a very important support at the 0.2501 level, which is the main support, and the price has already reacted to it once, bounced from the bottom of the channel, and is now positioned above the channel’s midline.
🔽 If the price fails to reach the top of the channel and gets rejected from lower levels such as the 0.3172 resistance, the probability of the channel breaking to the downside increases, and more bearish momentum may enter. When the price gets rejected before reaching the channel top, it indicates weakening buyer strength.
✨ So, if the price gets rejected from the 0.3172 resistance, we can open a suitable position. The lower the rejection, the higher the probability of a drop. A rejection from the channel top or even a fake breakout can also act as a valid trigger.
📉 The main trigger for a short position is the break of the 0.2501 level, which is a very strong support, and its break can lead to a significant bearish leg.
⚡️ For a long position, the first trigger is the break of 0.3172, which is a good area but very risky, because just above it lies the channel ceiling, and the price might get rejected from there and move downward.
🔼 Therefore, it's better to wait for the channel to be broken first and then look for a long trigger. Currently, the most reliable trigger for a long position after a channel breakout is at 0.4018, but this level is quite far. So, for a long position, we can also enter on a pullback to the channel or after getting confirmation from Dow Theory.
📝 Final Thoughts
This analysis reflects our opinions and is not financial advice.
Share your thoughts in the comments, and don’t forget to share this analysis with your friends! ❤️
TradeCityPro | VETUSDT Keep an Eye on the Charts!👋 Welcome to TradeCityPro Channel!
Let’s dive into the days when the world is buzzing with interesting events—countries are forming alliances, and news of Trump’s tariffs to negotiations is everywhere. You need to keep a sharp eye on the financial markets and your assets!
🌐 Overview Bitcoin
Before starting the analysis, I want to remind you again that we moved the Bitcoin analysis section from the analysis section to a separate analysis at your request, so that we can discuss the status of Bitcoin in more detail every day and analyze its charts and dominances together.
This is the general analysis of Bitcoin dominance, which we promised you in the analysis to analyze separately and analyze it for you in longer time frames.
📊 Weekly Timeframe
After the bullish move from the 0.01963 support, we got rejected at 0.08271, essentially wiping out the entire move and fully retracing our steps.
We’ve now returned to the 0.01963 support, where we’re forming a solid green indecision candle, backed by noticeable buying pressure. This level has shown a strong reaction, acting as a reliable support.
This could serve as a decent buy trigger with low risk, offering a good entry point. Personally, though, I’m holding off on buying until we see stronger momentum in the chart and market, and until Bitcoin dominance experiences a deeper pullback.
📉 Daily Timeframe
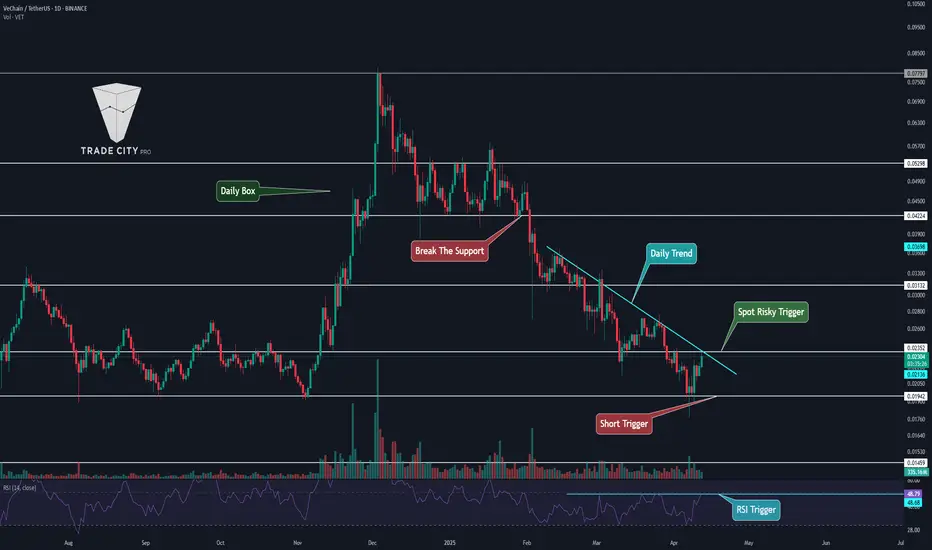
In the daily timeframe, VET is among the coins that have faced a brutal sell-off! From its last peak, it’s dropped roughly 77%, and those without proper risk management have likely been wiped out.
After forming a support box between 0.04224 and 0.05298, we saw a fakeout above the box, signaling further downside. The last time we held support at 0.04224, we couldn’t reach the box’s ceiling, leading to a sharp drop. But after hitting 0.01942, the price has calmed down a bit.
For buying in spot or even futures positions, we’d need a break of the trendline and its trigger at 0.02352 to confirm entry, given the trendline’s retracement nature. If we get rejected from this trendline, a short position in a lower timeframe could make sense. Should 0.01942 break, the downtrend will likely continue. For spot entry confirmation, a surge in volume and a break above 48.68 RSI would be a strong signal.
✍️ Final Thoughts
Stay level-headed, trade with precision, and let’s capitalize on the market’s top opportunities!
This is our analysis, not financial advice always do your own research.
What do you think? Share your ideas below and pass this along to friends! ❤️
TradeCityPro | Bitcoin Daily Analysis #59👋 Welcome to TradeCity Pro!
Let’s move on to the analysis of Bitcoin and key crypto indices. In this analysis, as usual, I’ll review the futures session triggers for New York.
🔄 Yesterday, one of the long triggers was activated, and the price moved up to the 83899 zone. Let’s see what triggers we can identify from today’s price action.
⏳ 1-Hour Time Frame
In the 1-hour time frame, as you can see, the price broke through the 83349 level yesterday and moved up to 83899. However, the candles weren’t strong enough to break this zone, and the price reached the resistance range between 83899 and 84572, then got rejected.
✨ An ascending trendline that started from the 74760 low has been accompanying the price, and each time the price has touched this trendline, the following bullish leg has been shorter, indicating a gradual weakening in bullish momentum.
✔️ Currently, the price is near the trendline, and if bearish momentum enters the market and selling volume increases, breaking the trendline trigger can give us a short position.
💫 The current trendline trigger is at 83813, and if it breaks, the price could open positions down to 80595 or even 78778.
💥 As mentioned, there is a resistance zone above the current price, which seems quite strong. The first trigger to break this resistance is 83899, and the second is 84572. The first trigger is riskier and more likely to hit the stop-loss. The second trigger, being higher, might not give a good candle setup, making it harder to enter a position, but it’s more reliable.
📊 If buying volume increases, a bullish move toward 88502 is likely. If selling volume increases, the likelihood of the trendline breaking also rises.
🔑 The RSI oscillator is also oscillating in the upper half. Entering the overbought zone could be a signal for long positions, while a break below 50 would be suitable for shorts.
👑 BTC.D Analysis
Let’s take a look at Bitcoin Dominance. Yesterday, BTC.D had a bullish move up to 63.80 but got rejected from that area and has now returned to the range between 63.30 and 63.50.
⭐ Today, a bearish confirmation for BTC.D comes with a break below 63.30, while a bullish continuation is confirmed with a break above 63.50.
📅 Total2 Analysis
Moving on to Total2: today this index continued its bullish movement and even broke the 957 trigger. If this move continues up to 989, altcoins could experience significant growth—especially considering the weakening momentum in BTC Dominance.
🧲 Today, there is no long trigger for Total2, but if this move turns out to be a fakeout, the 934 zone will be a good trigger for a short position.
📅 USDT.D Analysis
Now for Tether Dominance: its short trigger has been activated. The next support level is at 5.41, and if this zone breaks, we could see a sharp downward move.
⚡️ For a bullish reversal in dominance, the first trigger is the 5.59 area, and if dominance stabilizes above this level, we can consider opening short positions on Bitcoin and altcoins.
❌ Disclaimer ❌
Trading futures is highly risky and dangerous. If you're not an expert, these triggers may not be suitable for you. You should first learn risk and capital management. You can also use the educational content from this channel.
Finally, these triggers reflect my personal opinions on price action, and the market may move completely against this analysis. So, do your own research before opening any position.
TradeCityPro | STX: Watching for a Breakout in Bitcoin’s L2 Star👋 Welcome to TradeCity Pro!
In this analysis, I want to review the STX coin for you. This coin is one of Bitcoin’s layer-2 projects and, with a market cap of $933 million, ranks 67th on CoinMarketCap.
📅 Daily Time Frame
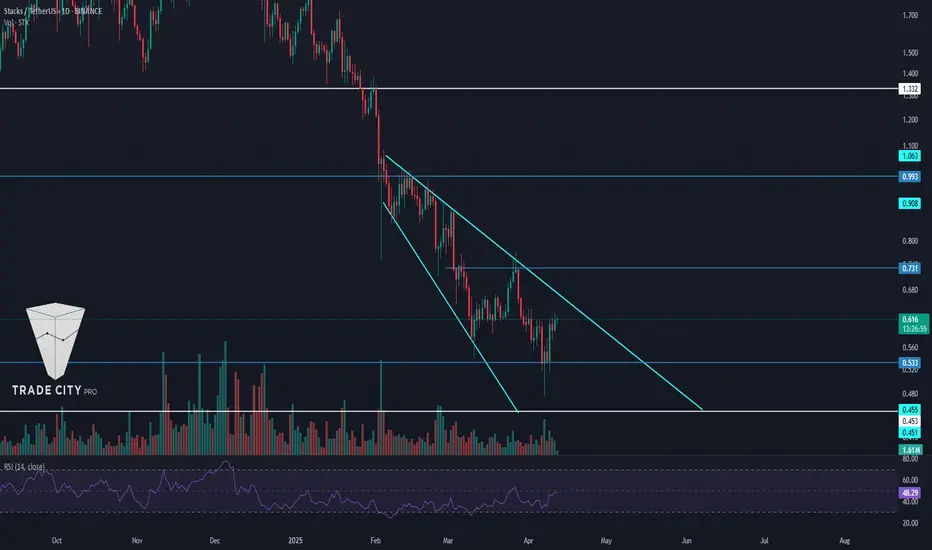
In the daily time frame, as you can see, this coin has been in a downtrend. Its most recent upward move began after breaking 1.332, and then it dropped within an expanding triangle structure down to the 0.533 area.
🔍 Currently, the main price support is at 0.453, which the price hasn't reached yet, but the 0.533 area is also strong and could mark the end of the downtrend.
✨ If the price bounces from the 0.533 area and starts moving upward, the likelihood of the triangle breaking to the upside increases. Since the price hasn’t reached the triangle’s bottom and could form a higher low, bullish momentum may enter.
📊 Market volume during the last bearish leg was decreasing, and now with supportive candles forming, volume is increasing—which, if it continues, also increases the likelihood of the triangle breaking.
🛒 If this happens, the buy trigger in spot is at 0.731, which, besides being suitable for a spot entry, can also provide a good futures position in lower time frames.
✔️ The RSI oscillator is also near the 50 level, and if it breaks above that and moves up, the price can head toward higher targets.
📉 On the other hand, for short positions, the 0.533 support is very important, and breaking it could justify opening a short. But note that this area is very close to 0.453, so if you're opening a short, be aware it's very risky and the price could reverse at any moment.
❌ If you already hold this coin and are looking for a good stop-loss level, a break and confirmation below 0.453 is appropriate. However, keep in mind that if your stop-loss is triggered and the price moves back above the support area, you should find a new trigger and buy again so you don’t miss the move.
📝 Final Thoughts
This analysis reflects our opinions and is not financial advice.
Share your thoughts in the comments, and don’t forget to share this analysis with your friends! ❤️
TradeCityPro | Bitcoin Daily Analysis #58👋 Welcome to TradeCity Pro!
Today, we'll delve into the analysis of Bitcoin and key crypto indices. As usual, I want to review the triggers for the New York futures session.
🔄 Yesterday, the price broke through the support zone between 80,595 and 81,522, retracing down to 78,778. Let's see what triggers the market could offer us today.
⌛️ 1-Hour Timeframe
On the 1-hour timeframe, as you can see, after breaking the 78,778 level, the price quickly recovered and climbed back above the 81,522 zone. Currently, it is hovering near 83,349.
🔍 Today, for a long position, we can consider opening a trade upon breaking the 83,349 resistance. The next resistance level at 84,572 could act as the following trigger point.
🔽 For short positions, we need to wait for a new market structure to form and observe whether the 81,522 or 80,595 zones can serve as our triggers.
⭐️ The RSI oscillator is near the Overbought zone, and a breakout above 70 into Overbought territory would provide good confirmation for a long position.
📊 Market volume has been increasing since the bullish leg started from 78,778. If this volume growth continues, the probability of breaking through the 83,349 resistance will rise.
👑 BTC.D Analysis
Now, let's move to Bitcoin Dominance (BTC.D). Yesterday, the 63.50 resistance was broken, and as Bitcoin's price climbed, its dominance also rose. This has caused altcoins to underperform compared to Bitcoin.
🔼 Currently, the next resistance for BTC.D is at 63.86. A break above this level would confirm the next bullish leg in Bitcoin Dominance.
📉 For a bearish move in dominance, the Futures triggers are at 63.50 and 63.30. However, for a confirmation in spot trading, we would need a break below 62.65.
📅 Total2 Analysis
Moving on to the Total2 (altcoin market cap excluding Bitcoin), I've slightly adjusted the zones and updated the triggers for altcoins.
✨ As I mentioned in the Bitcoin Dominance analysis, altcoins have been lagging behind Bitcoin. Even though Bitcoin reached 83,349, Total2 failed to retest its previous highs and instead formed a lower high.
✔️ For long positions on altcoins, a break above 940 would be ideal. For short positions, you can look for confirmation if 903 is broken.
📅 USDT.D Analysis
Finally, let's analyze USDT Dominance (USDT.D). Yesterday, it bounced from the 5.53 support level, climbing to 5.84 before starting a new downtrend, now approaching 5.53 again.
⚡️ To continue the bearish move, a break below 5.53 would be significant. Conversely, for a bullish move, the first trigger is at 5.84.
❌ Disclaimer ❌
Trading futures is highly risky and dangerous. If you're not an expert, these triggers may not be suitable for you. You should first learn risk and capital management. You can also use the educational content from this channel.
Finally, these triggers reflect my personal opinions on price action, and the market may move completely against this analysis. So, do your own research before opening any position.
TradeCityPro | GALA: At Key Support, Wait for Bitcoin Dominance👋 Welcome to TradeCity Pro.
In this analysis, I want to review the GALA coin for you. It is one of the first gaming crypto projects, currently ranked 86th on CoinMarketCap with a market cap of 628 million dollars.
📅 Weekly timeframe
In the weekly timeframe, as you can see, a very long-term range box has formed between the zones of 0.01307 and 0.08243, and the price has been ranging between these two areas for quite a while.
🔍 An interesting point regarding the volume within this box is that every time the price moved upward from the bottom to the top of the box, the volume increased, and during the price declines from the top to the bottom, the volume decreased.
📊 However, if we only look at the candles, we can see that the bearish momentum has been much stronger than the bullish momentum, and the probability of the bottom breaking is higher than the top. But this divergence between the price and the volume reduces the probability of the bottom breaking because, in my opinion, volume is more important than candles.
📉 Currently, this coin is located at the bottom area of its box, and we can say that there is a support zone between 0.01307 and 0.01547, which is almost the last support area for the price, and if this zone is broken, a new all-time low will be recorded.
💥 There is also an important area in the RSI, which is the 35.93 zone, and breaking this zone in the RSI increases the probability of breaking 0.01307.
🛒 For buying this coin in spot, the trigger at 0.08243 is suitable, but in my opinion, even if this zone is broken, do not buy any altcoins until Bitcoin dominance becomes bearish. I personally will wait until dominance changes trend and, for now, will not buy any altcoins.
🎯 The main target that the price might be able to reach is the 0.73643 zone, which is the all-time high, but considering that the inflation of this coin has been very high, the probability of reaching its all-time high is very low.
📅 Daily timeframe
In the daily timeframe, we can review the last bearish leg that the price has had in more detail.
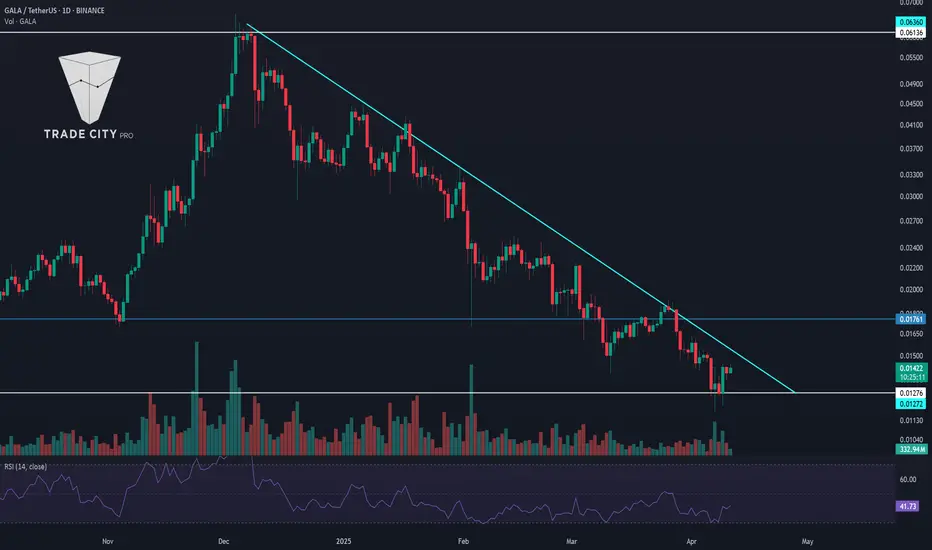
🎲 As you can see, after the price reached the 0.06136 resistance and got rejected from this area, the bearish trend started and the price continued along a descending trendline down to the 0.01276 zone.
⚡️ Currently, the 0.01276 support is the most important support for the price, and as we saw in the weekly timeframe, if this zone is broken, a new all-time low will be recorded. The RSI entering the oversell zone brings bearish momentum into the market and helps the break of this zone.
🔼 However, for spot buying in this timeframe, we can use earlier triggers. The best trigger is the break of the trendline, and currently, the trendline trigger is around the 0.01761 zone, and you can buy if this zone is broken.
✔️ An important point, as I mentioned in the weekly timeframe, is that Bitcoin dominance is still bullish, and as long as it does not turn bearish, buying any altcoin is not logical.
📝 Final Thoughts
This analysis reflects our opinions and is not financial advice.
Share your thoughts in the comments, and don’t forget to share this analysis with your friends! ❤️
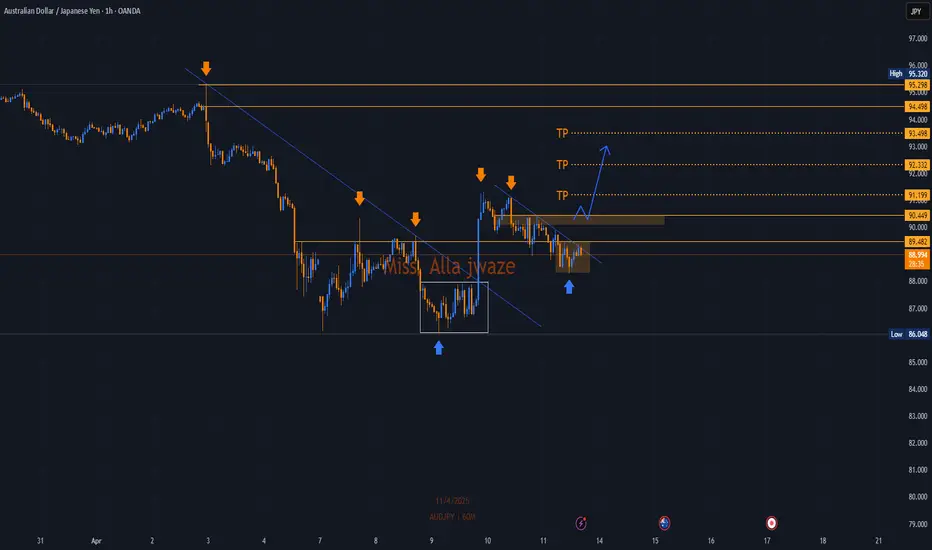
AUDJPYWe see in Australia against the Japanese yen two scenarios, i.e. the trend is completed to the downside, or if 90.449 is breached, it begins to rise, and we target 93.498 and 92.332, but most likely the scenario is an upward trend that will be activated, i.e. we wait for the taki candle after the breach.
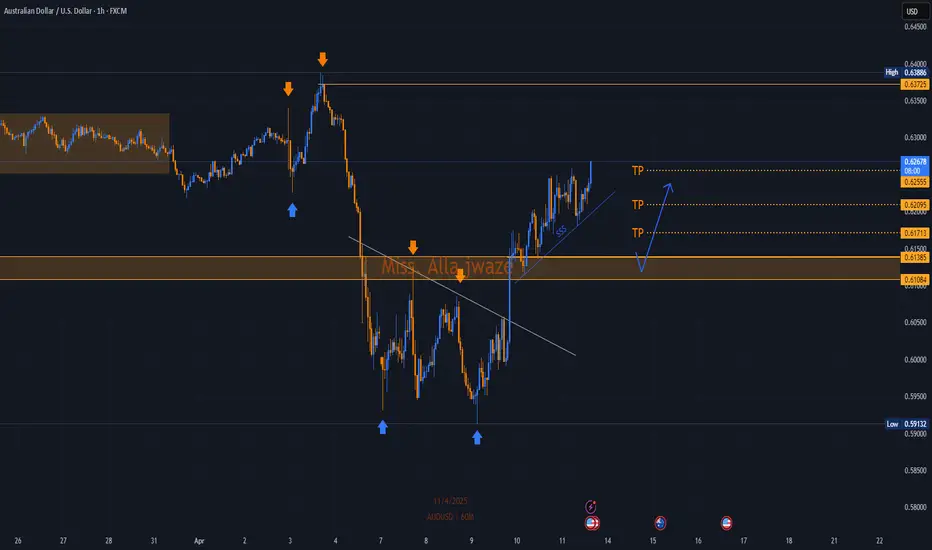
AUDUSDWe await a retest and withdrawal of liquidity and a correction to the area we specified at points 0.6135 and 0.61084. From this area, we wait for a confirmation candle and a buy entry, targeting 0.62555. But noticing any movement in the market may change the goals. This is a region, so we will wait and see what update we publish.
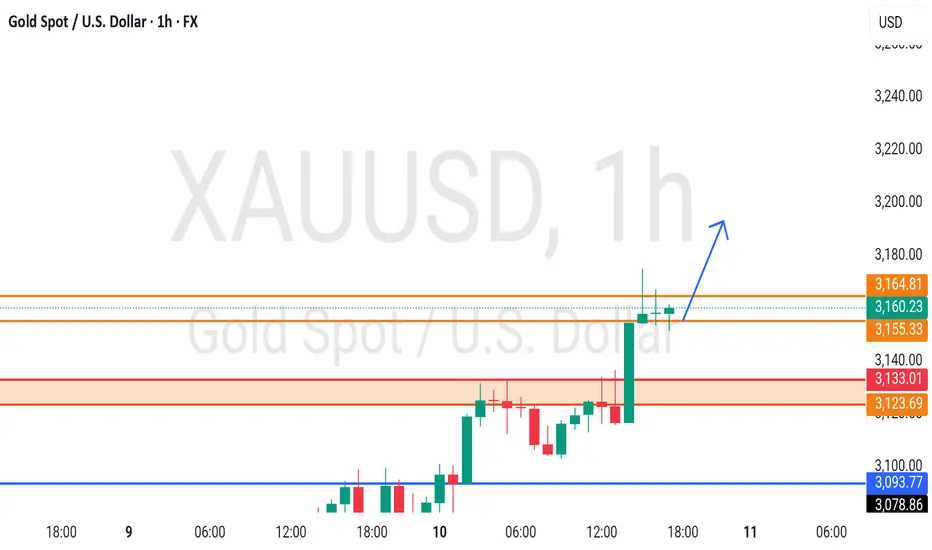
GOLD.. only single area, holds or not ??#GOLD... Now we have only single area that is around 3154
So keep close and if market hold it in that case we can expect further bounce to upside ..
Good luck
Trade wisely
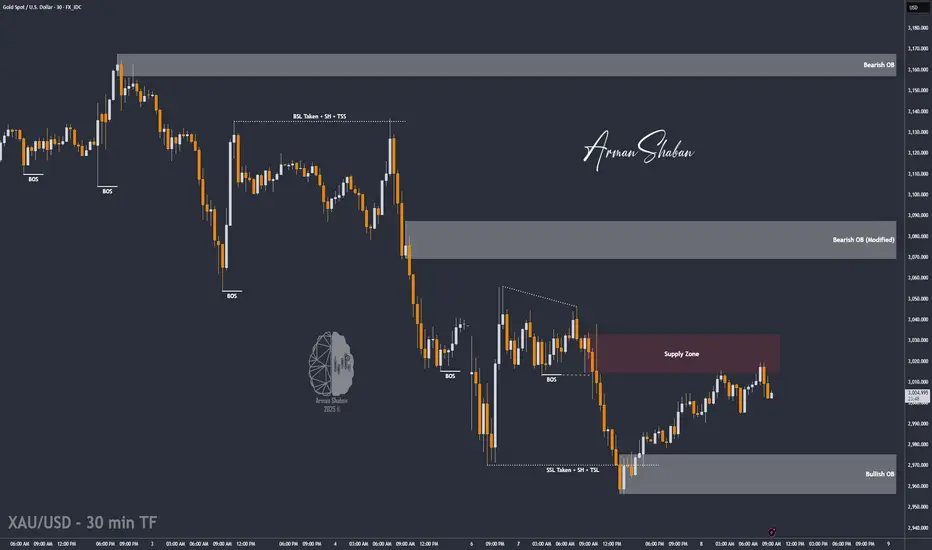
XAU/USD: Ready for another Fall? (READ THE CAPTION)By examining the gold chart on the 30-minute timeframe, we can see that yesterday the price once again moved exactly as expected, hitting all four targets: $3022, $3016, $3010, and $3000, and even dropped further to $2956, resulting in a total return of over 700 pips!
Currently, gold is trading around $3003, and if the price stabilizes below $3014, we can expect further downside.
All key demand and supply zones are marked on the chart and are fully tradable.
If the drop continues, the next bearish targets will be $2997, $2991, $2984, and $2976, respectively.
Please support me with your likes and comments to motivate me to share more analysis with you and share your opinion about the possible trend of this chart with me !
Best Regards , Arman Shaban
SPY PRICE ACTION 10TH APRIL2025Spy further price action is here. I have discussed all the potential buying levels and do not go long at current price as we are into a supply zone.
Feel free to leave a comment
NOTE:WAIT AS WE ARE INTO A SUPPLY

TradeCityPro | Bitcoin Daily Analysis #57👋 Welcome to TradeCity Pro!
Today, we'll delve into the analysis of Bitcoin and key crypto indices. As usual, I want to review the triggers for the New York futures session.
🔄 Yesterday, there was news from Trump granting a 90-day tariff reprieve to all countries except China, which activated both long triggers I outlined for you yesterday—one before the news and one after.
⏳ 1-Hour Time Frame
In the hourly time frame, as you can see, after the price was supported at 74760 in yesterday's analysis, I mentioned that breaking 77735 could be a risky long entry and breaking 80595 would activate the Double Bottom long trigger.
🔍 As observed, the first trigger at 77735 provided a very good entry, allowing us to open a robust position. However, the 80595 position, as it activated a four-hour pattern, naturally takes longer to reach the target or stop-loss.
📈 Currently, the price has made a bullish leg and is in a correction phase, and we need to see how far this correction can continue. A new support is forming at 81522, where the price had previously shown support and is now being supported again.
✔️ With 80595 and 81522 being close, we can say that a yet unconfirmed support zone has formed around this area, and the price could start its next bullish move after correcting into this zone.
🔼 Thus, for a long position, reacting to this support zone and breaking the short-term ceiling in lower time frames can give us a position. The next trigger is breaking the ceiling at 83349, which could start the next bullish leg upon making a higher high.
💫 However, the main trigger for going long is breaking 84572, which is a major resistance. Since this area is very significant, I wouldn't open a position with just the break of 83349, as a rejection from 84572 could hit our stop-loss and poses a high risk.
✨ If you recall, in analysis number 52, I drew a trendline in the daily time frame that now coincides with this price area, and the trigger for breaking this trendline overlaps with 84572, another reason this resistance is significant and why its breach is crucial.
🔽 For short positions, as you know from following my analyses, I trade based on the current momentum and market trend. Since we have entered a bullish momentum and no bearish structure has been formed yet, there is no reason for a short position. However, if you still want to open one no matter what, breaking areas 81522 or 80595 could be very risky but suitable.
👑 BTC.D Analysis
Yesterday, there was a detailed analysis of Bitcoin dominance, complete with explanations of its utility and why we use it. I strongly recommend reviewing that analysis to understand why this chart needs to be checked and what's happening in its higher time frames.
☘️ Yesterday, the dominance faked out from the area of 63.30, then returned above this area, moving towards the ceiling of the box it had created, 63.50, and now it seems to be faking this area too.
⚡️ When this occurs in the chart, it indicates that the chart is not analyzable correctly, and we must wait until a proper structure is formed. Until then, we can decide candle by candle, following the momentum of each candle.
📅 Total2 Analysis
Moving on to the analysis of Total2, triggers in the areas of 896 and 920 were activated, and the price movement continued near the area of 965, now entering a corrective phase.
📊 The support floor being formed is slightly above 920, and we should wait for a new structure. Until then, breaking 965 for a long and breaking 920 for a short are suitable.
📅 USDT.D Analysis
Let's turn to Tether dominance, which, like Total2 and Bitcoin, has had its triggers activated and moved downward, reaching the support area at 5.53.
🎲 We confirm the continuation of the downtrend with the break of this 5.53, and for further correction, breaking 5.73 gives us confirmation.
❌ Disclaimer ❌
Trading futures is highly risky and dangerous. If you're not an expert, these triggers may not be suitable for you. You should first learn risk and capital management. You can also use the educational content from this channel.
Finally, these triggers reflect my personal opinions on price action, and the market may move completely against this analysis. So, do your own research before opening any position.
Connecting Your Tickmill Account to TradingView: A Step-by-Step In this step-by-step guide, we’ll show you exactly how to connect your Tickmill account to TradingView in just a few seconds.
✅ Easy walkthrough
✅ Real-time trading from charts
✅ Tips for a smooth connection
Don’t forget to like, comment, and subscribe for more trading tutorials!
All Strategies Are Good; If Managed Properly!
~Richard Nasr

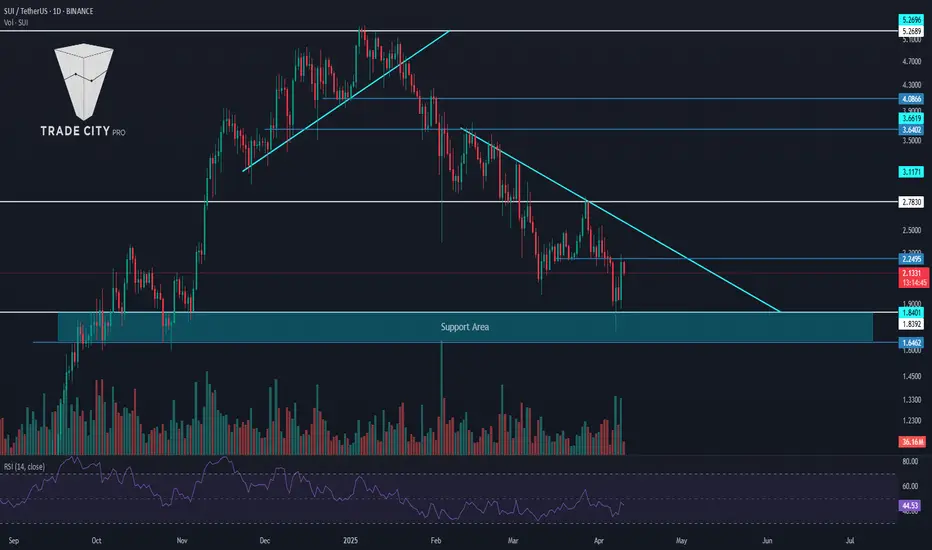
TradeCityPro | SUI: Analyzing the Shift from Hype to Stability👋 Welcome to TradeCity Pro!
In this analysis, I will review the SUI coin. This project gained significant hype in 2024 and experienced a substantial upward movement.
🔍 However, in the past few months, after reaching a price ceiling of 5.2689, it entered a corrective phase, and it can be said that its hype has completely dissipated and no longer carries much excitement.
📅 Daily Time Frame
As you can observe in the daily time frame, the price had a strong upward trend and, after breaking and pulling back to the 1.8392 area, it undertook the next upward leg up to 5.2689. During this movement, a severe divergence occurred in the RSI, which influenced the market when it was activated by breaking 50.
✔️ The upward movement accompanied by a trendline, was broken after being rejected from the 5.2689 area. The trigger for this trendline was the 4.0866 area, which was activated and confirmed the trend change after a pullback to this trigger and the break of the 3.6402 support.
🔽 Currently, after the break of 3.6402, a bearish trendline has formed, and the price has reacted to this area several times. Meanwhile, the price has also reacted to a significant support area around 1.8392. This area, actually a range between 1.6462 and 1.8392, is one of SUI's most crucial supports and could prevent further price drops.
✨ For the coin to become bullish again, the main trigger we have is breaking the bearish trendline, and I believe for buying in the spot market, the primary trigger will be breaking this trendline. There is also a significant resistance at 2.7830, which is the main trigger for breaking the trendline.
📈 If the price makes a lower high and low and breaks the support area it currently holds, the trendline trigger will shift to 2.2495, allowing us to enter earlier. A break of 50 in the RSI will also be a suitable trigger for entering a bullish momentum.
🛒 Alternatively, if you trade reactively, the price's reaction to this support area and breaking short-term resistances in lower time frames could be suitable for risky spot buying.
📊 Currently, the market volume has been more favorable to sellers, with volume increasing during price drops and decreasing during corrections, indicating the strength of the bearish trend. However, after the price reached the support area and reacted to it, we've seen two strong bullish candles with significant volume, which could be the first signs of a trend change.
📉 For the price to turn bearish and start the next bearish leg, as mentioned, breaking the support area and the 1.6462 trigger would be suitable, and in this case, the price could start the next bearish leg.
📝 Final Thoughts
This analysis reflects our opinions and is not financial advice.
Share your thoughts in the comments, and don’t forget to share this analysis with your friends! ❤️
Skeptic | GOLD: Is the Uptrend Over… or Just Taking a Breather? Welcome back, guys! 👋 I'm Skeptic.
Today, we're diving deep into XAU/USD , breaking down the current structure and upcoming trade opportunities. 🔍
Recap & Current Structure:
As mentioned in our previous analysis , after the recent uptrend, we've entered a corrective phase. This correction coincides with rising economic tariffs from the U.S. and retaliatory tariffs from the EU and China—particularly targeting U.S. goods.
Interestingly, gold, which is typically considered a safe-haven asset, also experienced a decline. This raises a red flag: when even gold falls, it signals that markets are likely pricing in an economic slowdown . Everyone seems to be chasing liquidity.
The recession risk is very real, so trade cautiously until a clear trend emerges. Right now, the market is in a state of uncertainty. Given the sharp declines in stocks, gold, and silver, we could see range-bound movement or consolidation this week—and possibly into the next.
Despite this, the major daily trend for gold remains upward , although momentum has clearly weakened. If we see a lower high and a confirmed break below support at 2958.53 , that would significantly shift the outlook—potentially leading to a deeper correction or even a trend reversal, especially in case of broader economic recession signals.
Let’s zoom into the 1H timeframe for actionable trade setups:
📈 Bullish Scenario (Long Setup):
- Trigger : Break & close above 3039.58
- Confirmation : 7 SMA below the candle during breakout + RSI climbing above OB
- Invalidation : Rejection and close back below 2994.10
📉 Bearish Scenario (Short Setup):
- Trigger : Rejection at 3019.98 followed by a drop below 2958.51
- Confirmation : RSI entering oversold
⚠️ Key Notes:
- Risk Management: Avoid overleveraging. Wait for clear confirmations before entering any trade.
Stay sharp, stay Skeptical, and I’ll catch you in the next analysis!

GOLD - one n single resistance , holds or not??#GOLD.. perfect move as per our discussion and now we have one n single resistance area.
That is 3093-94
Keep close that area because that is our key level now and if market hold it in that case we can expect a drop below that..
Note: above 3093-94 we will go for CUT n reverse on confirmation.
Good luck
Trade wisely

TradeCityPro | BTC.D: Predicting Alt Seasons with Bitcoin Domina👋 Welcome to TradeCity Pro!
In this analysis, I want to discuss an important crypto index that can significantly impact our trading, known as BTC.D. First, I'll provide some explanations for those unfamiliar with this index, and then we'll dive into the analysis.
🤔 What is Bitcoin Dominance?
Bitcoin Dominance is a major indicator in the crypto market. It does not directly represent supply and demand and is not tradable; the chart you see is calculated by TradingView and does not exist physically.
⚡️ This index represents the strength of Bitcoin in the crypto market. It shows the amount of money in Bitcoin divided by the total money in the crypto market.
100x(Bitcoin MarketCap / Total MarketCap) = Bitcoin Dominance
✔️ For example, if the total money in crypto is 1 trillion dollars and 500 billion dollars of that is in Bitcoin, then Bitcoin's dominance would be 50%.
✔️ Or, if the total money in crypto is 1 trillion dollars and 300 billion dollars of that is in Bitcoin, then Bitcoin's dominance would be 30%.
Now that we know what Bitcoin dominance is and how it is calculated, let's see how it can help us in trading and where it can be useful.
🤔 How is Bitcoin Dominance useful?
When we trade, we often encounter situations where both Bitcoin and an altcoin (for example, Ethereum) are triggered simultaneously according to our strategy. There are several ways we can open positions in these situations. Some open positions simultaneously on both, increasing the risk of the trade and doubling the potential loss if the market moves against us. Others may randomly choose between the two positions, which could result in taking a position on Bitcoin and hitting a stop-loss while Ethereum moves towards your target. But how can we determine which one is likely to be more profitable?
🔹 As mentioned, Bitcoin dominance indicates the strength of Bitcoin relative to the rest of the market, and there are three scenarios to consider for its analysis.
📈 In the first scenario, if the market is bullish, Bitcoin dominance can be bullish, bearish, or range-bound. If Bitcoin dominance is bullish, it means more money is entering Bitcoin, so if both Bitcoin and Ethereum are triggered simultaneously, Bitcoin is likely to rise more than Ethereum. If Bitcoin dominance is bearish, less money is entering Bitcoin relative to altcoins, so altcoins like Ethereum are likely to rise more. If Bitcoin dominance is range-bound, we analyze the market candle by candle and pay more attention to short-term momentum, deciding based on the current trend of Bitcoin dominance.
📉 In the second scenario, if the market is bearish, Bitcoin dominance can again be bullish, bearish, or range-bound.
✔️ Before explaining this scenario, let me tell you how it's possible for the market to be bearish while Bitcoin dominance increases even though Bitcoin's price is also falling. As I mentioned, Bitcoin dominance is a ratio and is shown in percentage terms, so if the market is crashing, it might be that Bitcoin is selling less than altcoins. For example, Bitcoin might sell for 10 million dollars and altcoins for 20 million dollars. Even though Bitcoin is being sold and its price is falling, it is being sold less than altcoins, so its dominance increases.
🔹 Now, let's examine the second scenario. If Bitcoin dominance is bullish, less Bitcoin is being sold compared to altcoins, so altcoins like Ethereum will have a greater drop and are better for short positions. If Bitcoin dominance is bearish, Bitcoin is being sold more than altcoins, so a short position on Bitcoin would be more suitable. Lastly, if Bitcoin dominance is range-bound, like in the first scenario, we analyze candle by candle and focus on short-term momentum.
📊 In the third scenario, if the market is range-bound, I first suggest not opening any positions because many strategies do not work well in range-bound markets, and it's better to wait for a breakout of the range's floor or ceiling before opening a position. However, if you do decide to open a position in this phase, short positions fall under the second scenario, and long positions fall under the first.
⭐ So, with Bitcoin dominance, we can optimize the positions we open and choose the best option between Bitcoin and the selected altcoin. If we look at Bitcoin dominance in higher time frames and not just as a confirmation for futures positions in lower time frames, we can identify alt seasons.
🤔 How to identify alt seasons and alt parties with Bitcoin Dominance?
So far, we've seen how dominance in different states and positions can help us in trading. Now, if we analyze Bitcoin dominance over a longer term, we can determine whether the money in the market will move more towards altcoins or Bitcoin in the coming weeks or months.
✔️ For example, if Bitcoin dominance is bullish in the weekly time frame and has a strong upward trend, naturally, more money will enter Bitcoin over time, making Bitcoin a better investment than altcoins. However, if Bitcoin dominance undergoes a correction for a few days or weeks during this bullish trend, altcoins can experience significant growth during that short time frame, which we call an alt party.
💥 On the other hand, if Bitcoin dominance completely changes trend and is bearish for several weeks or months, altcoins will naturally grow much more and will be a better investment option until Bitcoin dominance turns bullish again, which we call an alt season.
🔹 An important note about alt seasons is that Bitcoin's trend during this time must be bullish or range-bound; if Bitcoin is bearish, neither an alt season nor an alt party will occur. So, be sure to first understand the overall market trend using indicators like Total and Total2, and then look for an alt party.
Now that we've examined how this index works, let's move on to a technical analysis of the chart.
📅 Monthly Time Frame
As you can see in the monthly time frame, Bitcoin dominance had a very long range above the 95% area between 2015-2017, which was because the crypto market was still very small at that time, and many investors thought it was a scam. Thus, if anyone wanted to invest in crypto, they only bought Bitcoin.
✨ But in 2017, during Bitcoin's bull run when it reached the 20k ceiling, altcoins also entered the game, and Bitcoin dominance began to fall, spreading the crypto money among other coins. This downward movement continued down to the 40% area, and after it consolidated around this area, Bitcoin dominance started rising again, correcting the severe downturn it had experienced.
🔍 At the start of the next bull run in late 2020, Bitcoin dominance reached its peak and formed a range between 57.13 and 71.04 until the end of the bull run. After Bitcoin's bull run, in the second leg when the price moved towards the 69k area, Bitcoin dominance broke the 57.13 support and moved down to the 40% support, leading to a major alt season.
🎲 In early 2023, coinciding with the start of Bitcoin's bullish trend from the 16k bottom, Bitcoin dominance broke the 47.80 area, which was the ceiling of its box, and its upward movement restarted. Currently, Bitcoin dominance has also broken the 57.13 area and is near 64%. As long as Bitcoin dominance remains bullish, Bitcoin will still be a better buy, and altcoins will not be able to grow significantly.
💥 If Bitcoin dominance finally confirms a trend change and turns bearish, if Bitcoin's trend remains bullish, we will witness another major alt season like in 2021. For now, we confirm the change in trend in Bitcoin dominance on the monthly chart by breaking 57.13, and for a better and more accurate analysis, it's better to move on to the weekly time frame.
📅 Weekly Time Frame
In the weekly time frame, after breaking the 47.46 area, an ascending trend has formed within an ascending channel, and the price has been in this channel for about two years.
🧩 The next resistance for Bitcoin dominance is 65.59, which it is moving towards, and the main ceiling for Bitcoin dominance is 71.04. If the upward trend continues, more money will enter Bitcoin, and altcoins will not be good investment options.
🔽 For a trend change and a bearish turn in Bitcoin dominance, breaking the 60.50 area is suitable, and if Bitcoin dominance records lower highs and lows below this area, we will confirm the trend change. Breaking the channel will also be one of the most important confirmations.
📅 Daily Time Frame
In the daily time frame, we can analyze the price movement with more detail.
💫 Currently, the 62.23 area has been broken, and Bitcoin dominance is performing another bullish leg, having reached the channel ceiling. If the channel ceiling breaks, we can expect a move to the 65.59 area.
📉 For a trend change in this time frame, it's better to wait for the channel to break, but besides the channel, the 62.23 and 60.50 areas are also significant, and breaking them will confirm it.
📝 Final Thoughts
This analysis reflects our opinions and is not financial advice.
Share your thoughts in the comments, and don’t forget to share this analysis with your friends! ❤️

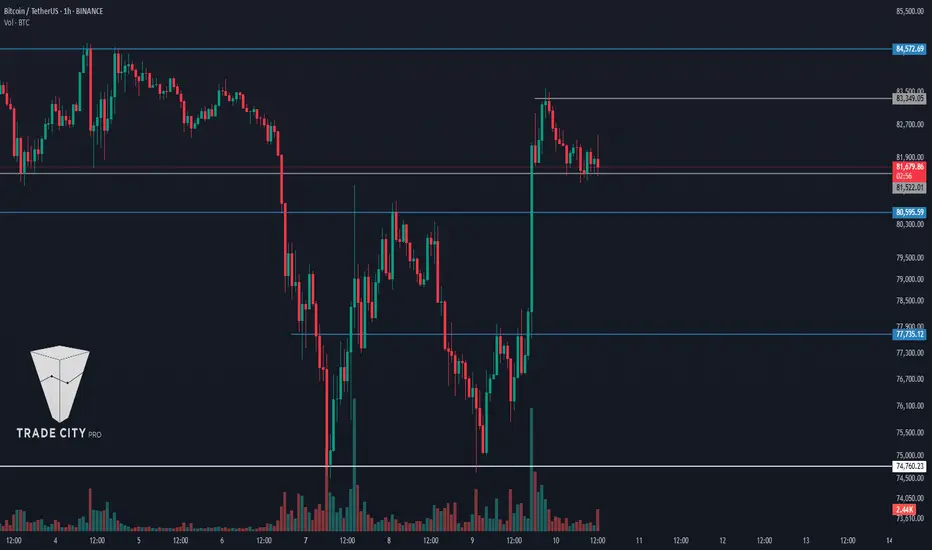
TradeCityPro | Bitcoin Daily Analysis #56👋 Welcome to TradeCity Pro!
Let's dive into the analysis of Bitcoin and key crypto indices. Today, as usual, I will review the New York futures session triggers.
✔️ Yesterday, the short trigger we discussed was activated, and the price moved downward to the area of 74760.
👀 Today, the market conditions are favorable for opening positions, both long and short.
⏳ 1-Hour Timeframe
As I mentioned yesterday, the price executed another downward leg after pulling back to the 80595 area, activating our trigger at 78913 and moving to the main support floor. Today, I have adjusted this area, and we will explore why this adjustment was made.
📚 Positions like the one yesterday, which are opened for scalping, I usually set with a risk to reward ratio of 2 or 3, and I don’t leave them open for long, opting instead to secure profits. If you also open such positions, I recommend not holding them long term.
💥 However, today, as you can see, the price is forming more structure and giving us more logical triggers. The SMA99 indicator is nearing the price, and the RSI is showing divergence compared to the first bottom that the price made at 74650, which was accompanied by divergence.
🔼 For the divergence in RSI to activate, it needs to break the area of 59.87. If this happens, we can say that the divergence is active, and we can look for a price trigger for a long position.
⚡️ The first trigger for a long position is the 77735 area, which is considered risky, and with the breaking of this area, you can open a scalping position. The main long trigger is the breaking of 80595, which, if broken, activates a Double Bottom pattern that could change the market trend.
⭐ Keep in mind, there is currently no Double Bottom, and only if the 80595 area breaks will this pattern form.
📉 For a short position, the 74760 trigger is still appropriate, and you can enter a short position if this area breaks. However, it is important to note that this area is very close to the 71779 area, and opening a position on the break of 74760 will be risky.
👑 BTC.D Analysis
Let's now analyze Bitcoin dominance, which continues to range between the areas of 63.30 and 63.50. Breaking this box could define the positions we open today.
💫 If the 63.30 area breaks, dominance might temporarily decline, allowing more capital to flow into altcoins. Conversely, if the dominance breaks upwards at 63.50, more capital will flow into Bitcoin. Soon, we will have a comprehensive analysis of Bitcoin dominance that I highly recommend not to miss.
📅 Total2 Analysis
Moving on to the analysis of Total2, yesterday the Total2 trigger at the 896 area was activated, and altcoins, like Bitcoin, declined, causing this index to drop to the area of 860.
🔍 Today, for a short position, breaking the 860 area is appropriate. However, for a long position, I recommend seeking confirmation from Bitcoin itself and its dominance.
📅 USDT.D Analysis
Finally, for the Tether dominance analysis, this index activated its upward trigger at the 5.84 area and performed an upward leg to 6.13.
📊 Currently, confirmation for the next upward leg in dominance will be with the breaking of 6.13, and the confirmation for a downward turn remains at the 5.73 area.
❌ Disclaimer ❌
Trading futures is highly risky and dangerous. If you're not an expert, these triggers may not be suitable for you. You should first learn risk and capital management. You can also use the educational content from this channel.
Finally, these triggers reflect my personal opinions on price action, and the market may move completely against this analysis. So, do your own research before opening any position.
Is Bitcoin holding up or sell-off coming soon?CME:BTC1!
Surprisingly, the price of bitcoin and bitcoin futures have held up well compared to stocks given that Bitcoin is a high risk, highly volatile crypto currency.
It is almost as if hedge funds, and other investors have not had to liquidate their BTC exposure due to margin calls.
Open Interest has been stable and average daily volume is holding up. This can be viewed by accessing the CME Bitcoin Open Interest and Volume .
What is next for Bitcoin futures?
As noted in our analysis, CME bitcoin futures are currently trading below the key level 2024 mid-range.
Key Levels:
2024 Mid-Range, Key LIS: 79655
2024 till YTD CVPOC: 71705
Support Zone: 63140 - 57275
2024 till YT CVAL: 57275
Scenario 1: Further Downside - technical breakdown
We expect further downside and move towards our support zone marked on the chart. Enter short on a pull back towards mid-range with stops above high of Apr 3rd, 2025.
Example Trade 1:
• Short Entry: 79000
• Stop: 85240
• Target: 60000
• Risk: 6240
• Reward: 22000
• Risk/Reward Ratio: ~ 3R
Scenario 2: Reclaim mid-range and consolidate
In this scenario, if the price gets back above 2024 mid-range and stays above, we expect the price to range between 90K to 80K.
Example Trade 2:
• Long Entry: 80000
• Stop: 74630
• Target: 89000
• Risk: 5370
• Reward: 9000
• Risk/Reward Ratio: ~ 1.68 R
Important Notes:
• These are example trade ideas not intended to be a recommendation to trade, and traders are encouraged to do their own analysis and preparation before entering any positions.
• Stop losses are not guaranteed to trigger at specified levels, and actual losses may exceed predetermined stop levels.
• NFA does not have regulatory oversight over spot cryptocurrencies or virtual currencies derivatives traded on unregulated/decentralized exchanges.
Glossary Index for all technical terms used:
YTD: Year to Date
LIS: Line in Sand
CVPOC: Composite Volume Point of Control
CVAL: Composite Value Area Low
Green Zones: Bull/ Buyers support zones

TradeCityPro | MNTUSDT Effects of the Bybit Hack👋 Welcome to TradeCityPro Channel!
Let’s dive into the analysis of the popular DeFi coin that’s active on the Mantle chain—where they’re running multiple airdrops and utilizing it for fees. Let’s break it down and analyze it together!
🌐 Overview Bitcoin
Before starting the analysis, I want to remind you again that we moved the Bitcoin analysis section from the analysis section to a separate analysis at your request, so that we can discuss the status of Bitcoin in more detail every day and analyze its charts and dominances together.
This is the general analysis of Bitcoin dominance, which we promised you in the analysis to analyze separately and analyze it for you in longer time frames.
📊 Weekly Timeframe
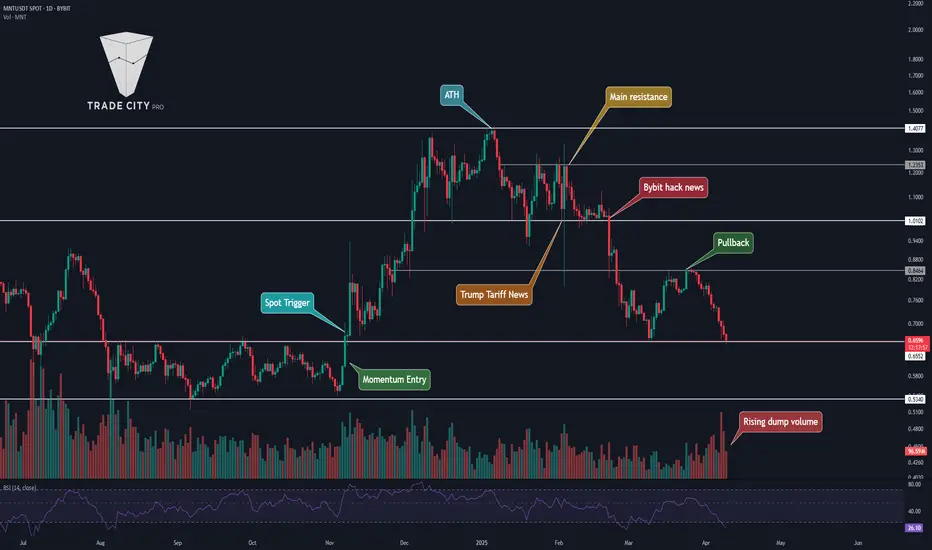
After hitting 1.4077, which was our previous ATH, there were practically no buyers present here, preventing us from breaking this key ceiling and moving upward.
Additionally, after the rejection from this high and an engulfing of the previous two candles, it’s safe to say our upward movement has concluded, and we’re now heading into at least a period of correction. This has already started as we’ve entered a resting phase from the prior trend.
However, after breaking 0.9030—coinciding with the news of the Bybit hack and the theft of Ethereum and its coins by North Korean hackers—we experienced a sharp drop. Given that Bybit held a large volume of this token, the decline was even more pronounced.
📉 Daily Time Frame
In the daily timeframe, after the rejection from 1.4077 and a deep drop, we moved upward again. This time, we hit resistance at 1.2353 multiple times, but nothing happened—buyers couldn’t push above this level.
With this lack of buying pressure, sellers stepped into the market. We then formed a support at 1.0102, but after breaking it—along with the hack news—we saw a sharp drop down to 0.06552! This level is highly significant!
It’s important because this was previously a key resistance, and after breaking it earlier, we kicked off our main uptrend. So, it’s a critical support now, and it won’t break easily! However, if this support does fail, we’ll likely see a drop to 0.5340.
For buying, it’s not a good time yet. But if we get support at 0.6552 with a strong daily candle, we could consider a buy. Alternatively, wait for a box formation and structure. Our current entry trigger would be a break above 0.8464. For selling, my stop loss would be below 0.5340.
✍️ Final Thoughts
Stay level-headed, trade with precision, and let’s capitalize on the market’s top opportunities!
This is our analysis, not financial advice always do your own research.
What do you think? Share your ideas below and pass this along to friends! ❤️