BTC Tightening Up – Key Support & Resistance in Focus!📝 🚀 BTC/USD – 4H Price Action Masterclass | Breakout Brewing Between $71.2K & $72K!
Bitcoin is currently consolidating in a high-tension zone on the 4-hour chart, forming a classic range-bound structure between two key levels:
🔹 Support at $71,200 – a previous resistance now acting as short-term demand
🔹 Resistance at $72,000 – a strong psychological barrier that price has failed to close above
This tightening range is setting the stage for a high-impact move, and the market is showing signs of compression. No indicators, no noise — just clean structure and price action clarity.
🔍 Detailed Technical Breakdown:
📌 $71,200 – Flip Zone:
Recently flipped from resistance to support after a breakout. Price is now retesting this level with precision, suggesting potential accumulation — but failure here may trigger strong selling pressure.
📌 $72,000 – Critical Resistance:
This level has held price down for multiple sessions. If bulls manage to close above it on strong volume, we could see a push towards FWB:73K +, where liquidity clusters await.
⚔️ Battle of the Zones – What to Expect Next?
Bullish Scenario: A breakout above $72,000 on strong bullish candles could ignite a move toward the next resistance at $73,500–$74,000.
Bearish Scenario: If $71,200 breaks down, expect a sharp drop toward $70,400, possibly extending to the $69K handle.
This setup offers a textbook example of how support/resistance zones act as battlegrounds for short-term market control.
🔥 Why This Chart Matters (No Indicators Used):
Clean price action = clean decision-making.
Ideal for breakout traders & range scalpers.
High probability setup with defined risk levels.
Easy to read & replicate — especially for beginners learning PA.
💬 What’s YOUR take?
Are we about to see a bullish explosion, or is this a trap before a deeper drop?
👇 Drop your analysis in the comments – let’s build a real traders’ conversation below!
📈 If you found this chart helpful, don’t forget to like & follow for more clean setups.
Tradingview
TradeCityPro | Bitcoin Daily Analysis #55👋 Welcome to TradeCity Pro!
Let's delve into the analysis of Bitcoin and key crypto indices, focusing today on the New York futures session triggers as usual.
🔄 Yesterday, the market was in a corrective phase of a downward trend, coinciding with news about the date of a meeting between Iran and the USA, which caused a slight upward movement in the market.
📊 As I mentioned, due to the low market volume, any news from the USA can significantly impact the price. The news was that Iran and the USA have scheduled a meeting for Saturday to negotiate an agreement.
📰 However, a more significant news item that the whole world is waiting for is China's reaction to the 35% tariffs imposed by the USA. Trump has declared that if China does not accept these tariffs within the next few days, he will increase them to 50%.
🎲 If this happens, the next downward leg in price might begin. However, if news comes out that these two countries are nearing an agreement and are ready to negotiate tariffs, the market will undoubtedly move upwards, and this news could even be the start of a new bullish trend.
Let's move on to the chart to find the technical triggers.
⏳ 1-Hour Timeframe
As I said yesterday, with the breaking of the 50 area in the RSI, the price underwent a deeper correction and moved upwards.
⭐ It appears that an ascending structure is forming, and the price is steadily moving upwards. However, this movement doesn't have much upward momentum, and its volume isn't very high.
🔽 Today, for a short position, we can open a position in line with the trend at a high risk with the break of the 78913 area. The price has corrected to a reasonable extent and has pulled back near the SMA99. If the price moves towards this SMA and gets rejected, the importance of breaking 78913 will increase.
📉 The main trigger is currently the 74760 area, which is the market's primary floor. However, in general, I believe that the market structure isn't yet in a state where we should open major positions, and we should wait for more structure to form. This way, we can open more secure and precise positions, which would allow us to take higher risks and ultimately make more profit.
💫 If you want to open a short position with the break of 78913, the RSI moving below the 50 area could be a good confirmation, but be careful not to involve too much risk.
👑 BTC.D Analysis
Let's move to the analysis of Bitcoin dominance, which is still ascending and has created a temporary support floor at 63.30. If this area breaks, we might temporarily confirm a decline in dominance.
🚀 Keep in mind that the dominance trend is bullish in all market cycles, and breaking this area does not mean a bearish trend. However, if it breaks 63.30, dominance might pull back to 63.07 and could enter a correction phase for a few days, which would impact our position choices.
✔️ If dominance is supported from this area, the likelihood of its continued growth increases.
📅 Total2 Analysis
Moving on to the analysis of Total2, as you can see, with the slight correction of Bitcoin dominance, this index has performed slightly better than Bitcoin and has currently reached a similar peak at 920.
📉 The short trigger I gave on Bitcoin at 78913 is a better trigger compared to Total2, where the 896 area has not yet been tested and is riskier than Bitcoin.
🔼 For long positions, you can open one with the break of 920, but I do not recommend it because the market is in a downward trend, and there is a downward momentum in the market, and since I do not trade against the trend, I also do not recommend that you take a long position against the downward trend.
📅 USDT.D Analysis
Finally, the analysis of Tether dominance is performing similarly to Total2 and is currently fluctuating between 5.73 and 5.84.
✨ Both of these areas could be used as triggers, but as I mentioned, it's better to wait for the market to create more structure and reveal the main triggers.
❌ Disclaimer ❌
Trading futures is highly risky and dangerous. If you're not an expert, these triggers may not be suitable for you. You should first learn risk and capital management. You can also use the educational content from this channel.
Finally, these triggers reflect my personal opinions on price action, and the market may move completely against this analysis. So, do your own research before opening any position.

TradeCityPro | CAKE: Slicing Through the Market's Range Box👋 Welcome to TradeCity Pro!
Let's dive into the analysis of Bitcoin and key crypto indices, focusing today on the CAKE coin, as requested in the comments. This coin holds a market cap of $511 million, ranking 93rd on CoinMarketCap.
📅 Weekly Timeframe
In the weekly timeframe, as you can see, there's a very large range box existing from 1.093 to 4.753. This box represents a substantial range, and the price has been in this box for almost three years.
🔍 There's a significant area within this box at 1.549, which currently acts as a very important support. The price has hit this level several times but has yet to break through it.
⚡️ In this timeframe, indicators are not very useful because it's a ranging trend, and in ranging trends, these tools don't perform well. The best tool we can use to analyze a ranging market is support and resistance.
📊 Currently, there is a support at 1.549, as mentioned, which the price has hit several times and has been supported by. If this support breaks, there's another very important support at 1.093, which will be the last support area for the price.
🛒 For buying this coin in spot, there is a very strong supply zone near 4.753. I recommend waiting until this area is broken to start the main bullish trend. This break would signify a potentially strong upward move, so entering before this break could expose you to unnecessary risks given the current ranging conditions.
📝 Final Thoughts
This analysis reflects our opinions and is not financial advice.
Share your thoughts in the comments, and don’t forget to share this analysis with your friends! ❤️

Gold (XAU/USD) 4H Analysis – Bullish Momentum Building Up?**Gold (XAU/USD) | 4H Chart | Bullish Bias**
Gold continues to shine as it builds a solid bullish structure on the 4H timeframe. After a healthy pullback, price has bounced back strongly, holding above key support zones and aiming higher.
**What's happening now?**
- Price is forming *higher highs and higher lows*, respecting the bullish trendline.
- Strong demand kicked in around the *$2,950* zone — a key level to watch for potential pullbacks.
- The next resistance lies near *$3,050*, a psychological and technical level that could act as the next target for buyers.
**Technical Confluence:**
- *Fibonacci retracement* aligns with recent pullbacks around $2,950 – offering strong support.
- *RSI* is hovering above 50, confirming ongoing bullish momentum.
- Price remains above the *50-period EMA*, supporting the uptrend.
---
**Bullish Scenario:**
If gold holds above $2,950 and breaks above $3,010 with volume, we could see a push toward *$3,050–$3,070* in the short term.
**Invalidation:**
A confirmed break below *$2,940* could weaken the bullish outlook and shift momentum.
---
**Educational Insight:**
In trending markets, pullbacks to key zones like Fibonacci levels or prior support often offer higher-probability trades. Instead of chasing breakouts, look for *retests* with confirmation.
---
What’s your take on gold right now? Are we headed toward new highs or due for a pause?

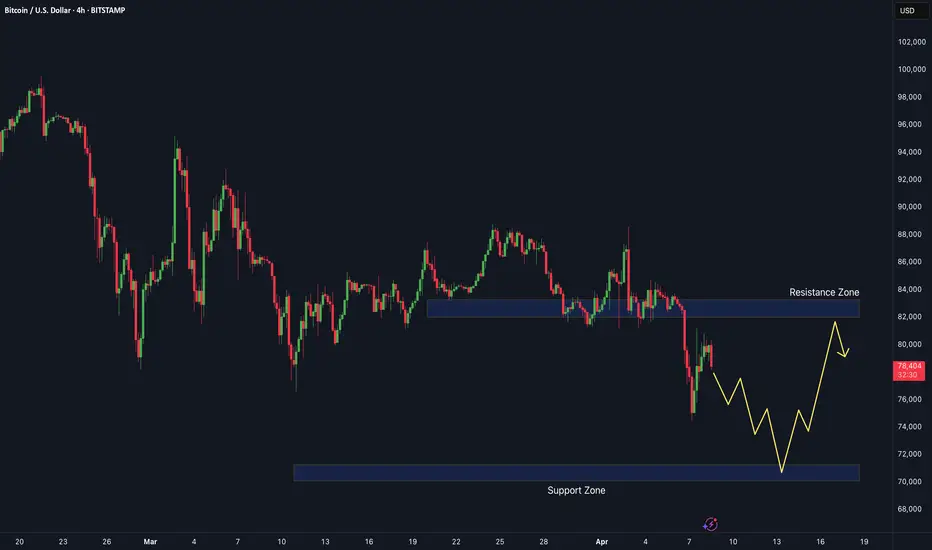
BTCUSDT - It's breakout? What's next??#BTCUSDT - perfect move below our region as you can see our last idea regarding #BTCUSDT
Now market have 81100 as a resistance area and if market sustain below that then we have further drop to downside.
Expected areas below are 74k, 69k and 65k
Good luck
Trade wisely

SPX WEEKLY 7TH APRIL 2025Welcome to SPX weekly. I have deeply discussed the price action here. If you have any doubts, feel free to leave a message or comment below.
NOTE:DO NOT SHORT

Paradigm Shift or Panic Selling? ES Futures Weekly PlanCME_MINI:ES1!
Macro Update:
The escalation of reciprocal tariffs and China's countermeasures have sent shockwaves through markets, with widespread selloffs across asset classes, including gold. Fund managers and investors were forced to liquidate positions to cover margin calls. The likelihood of a global recession has surged, with Goldman Sachs raising the probability of a US recession to 45% from 35%. Meanwhile, JPMorgan increased its global and US recession odds to 60%, up from 40%, due to intensifying tariff tensions.
The March 2025 Federal Reserve’s SEP projections suggest slowing growth amid rising inflation concerns, pointing in the right direction. Is this a paradigm shift, or was it already set in motion earlier in the decade? Or is this simply panic selling, with the expectation that US administration policy will soon stabilize markets?
If it is a paradigm shift—as seems more likely based on recent developments—the current environment could prove historic, aligning with Ray Dalio's concepts on the changing world order, debt crises, and how nations go bankrupt.
Investor Confidence: ES futures are currently down over 20%, entering bear market territory for the first time since the 2020 pandemic crash. The big question now is whether we’ll see a relief rally or continued sell-offs with occasional pullbacks, or if markets are establishing a new value range based on auction market principles.
• 2024 YTD mCVAL: 5379.75
• 2022 CVAH: 5376
• March 2025 Low: 5533.75
• August 5th, 2024 Low: 5306.75
• Neutral LVN: 5191.50 - 5156.25
• April 4th, 2025 Low: 5074
• 2024 Yearly Low: 5016.25
• CVPOC 2022: 4610.50
Scenario 1: Further Downside The key downside level for ES Futures is 4610.50, where the most volume has been transacted since 2022. Currently, ES Futures are trading above this level. If the market establishes a value range between 4900 and 4500, further selling with brief pullbacks and consolidation above the 2022 CVPOC seems likely.
Scenario 2: Relief Rally For a rally to take hold, ES Futures faces key resistance levels: the 2024 Low at 5016.25 and the pWeek Low at 5074. If markets sustainably stay above these levels, we could see a rally toward the 2022 CVAH at 5376. However, the sustainability of such a rally remains in question given the mountain of uncertainties ahead.
It is important to note that uncertainty tends to create highly volatile market regimes. Traders should adjust the expected daily range accordingly. A good indicator to measure this is “Daily Average True Range”, many traders also rely on close-to-close standard deviation bands to gauge range on a given trading day. As such, we could see moves of 3% or more in either direction on any day.

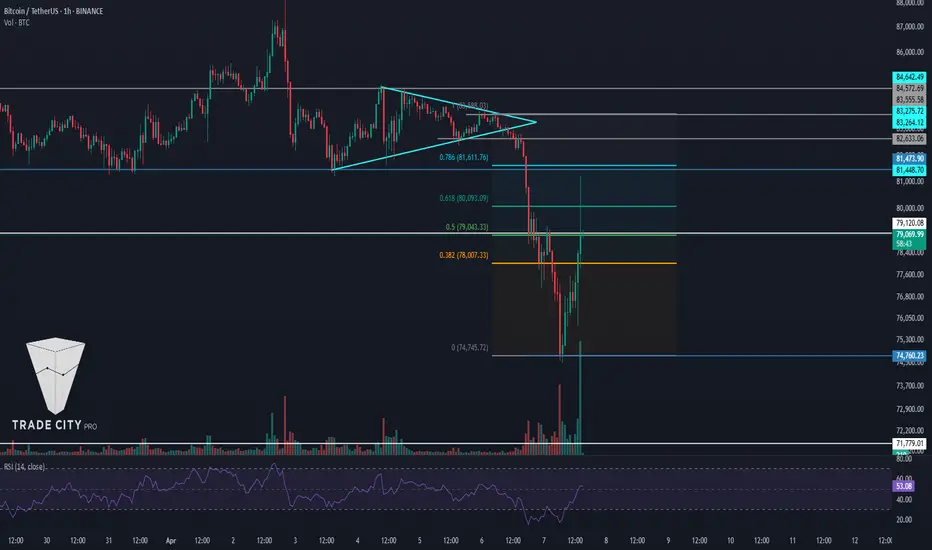
TradeCityPro | Bitcoin Daily Analysis #54👋 Welcome to TradeCity Pro!
Let's delve into the analysis of Bitcoin and key crypto indices. As usual, I will review the New York futures session triggers for you.
⚡️ The market has experienced a drop since yesterday, and I had identified the triggers for this drop in the previous analysis. Let's analyze today to see what we can do in the market.
⏳ 1-Hour Timeframe
In the 1-hour timeframe, as you can see, the price made a downward move after the triggers at 82633 and 81473 were activated, even breaking the important support at 79120 and now has rebounded from the area of 74760.
✔️ If we draw a Fibonacci from this downward leg, we can find potential resistance levels. A few moments ago, there was also a fake news report from Trump stating that he would give 90 days to all countries except China to start tariffs, which, although fake, had a significant impact on the market.
📊 The market volume is very low, which makes it susceptible to such short and small news about tariffs to react this way.
📰 If such news continues and the market acts emotionally, the technical analysis I perform for you will not be very reliable, and the price will move more emotionally.
🔼 However, if these emotional moves end and the price stabilizes in these areas, the potential resistances we have are the Fibonacci levels of 0.5, 0.618, and 0.786, where the 0.5 and 0.786 areas overlap with static price resistances, and the 0.618 area, being the golden Fibonacci, could prevent further price drops.
💥 The RSI oscillator, after a sharp fall and being mostly in Oversell yesterday, has finally exited this area and now reached around 50. If this area is broken in the RSI, the likelihood of a deeper correction will increase.
📉 Today, for a short position, we only have the break of the 74760 area, which I also suggest not opening a position with this trigger because the market has recently moved and needs to create a new structure.
📈 For long positions, according to the strategy I have, it does not make sense for me to open a position in this trend that has so much downward momentum. The best analogy is that when a knife is falling, you shouldn't try to catch it mid-air because it might cut your hand; you should wait for it to fall to the ground so you can pick it up safely without risk.
Let's look at the indices to take a look at the situation with altcoins.
👑 BTC.D Analysis
Bitcoin dominance has made another upward move after breaking 63.07. This caused altcoins to fall more than Bitcoin during this drop, and short positions on altcoins would have given us more profit compared to Bitcoin.
🚀 In the analyses of Bitcoin and altcoins, I've repeatedly told you that for buying altcoins, we should wait until Bitcoin dominance starts to drop. That hasn't happened yet, and it still has a strong upward trend, so today if the market gives a short trigger, altcoins would be more logical.
📅 Total2 Analysis
As you can see, this index has fallen much more than Bitcoin, experiencing a very sharp downward leg upon activating the trigger at 965.
⭐ Currently, I've only added the 949 line to the chart, which overlaps with the 0.786 Fibonacci of this downward leg, and I haven't added any other lines and am waiting for the price to create its structure.
✨ The nearest support the price has is 816, which is very important, and there is nothing else notable about Total2 yet, and we need to wait until a structure is created that can be analyzed.
🎲 The only opinion I can give for now is that the 816 area is very important, and reaching this area in Total2 could end its downward trend, which is more like a prediction than an analysis and is a gut feeling and currently has no logical reason.
📅 USDT.D Analysis
Let's move on to the analysis of Tether dominance, which is very similar to Total2 but seems like a reverse of it.
👀 Yesterday, the trigger at 5.53 activated simultaneously with 965 in Total2, and the dominance moved upward. There's not much I can analyze about this chart, and the main resistance is in the area of 6.34, which acts like the 816 in Total2.
❌ Disclaimer ❌
Trading futures is highly risky and dangerous. If you're not an expert, these triggers may not be suitable for you. You should first learn risk and capital management. You can also use the educational content from this channel.
Finally, these triggers reflect my personal opinions on price action, and the market may move completely against this analysis. So, do your own research before opening any position.
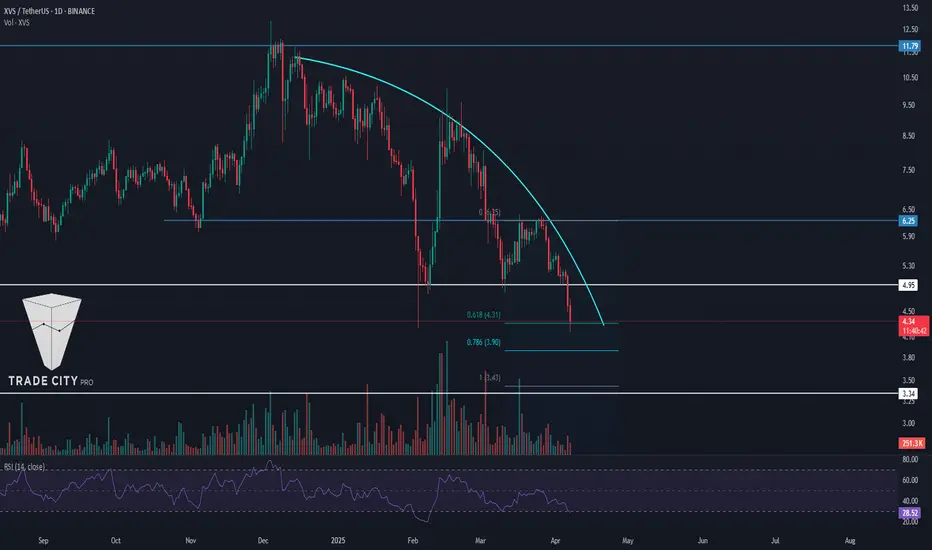
TradeCityPro | XVS: Tracking Its Trajectory in the DeFi Space👋 Welcome to TradeCity Pro!
In this analysis, I want to review the XVS coin, which you requested in the comments. This project is one of the DeFi projects with a market cap of $72 million, ranking 346th on CoinMarketCap.
📅 Weekly Timeframe
In the weekly timeframe, as you can observe, the price started a downtrend after reaching a peak in 2021, and this trend is still ongoing.
✨ Currently, there is a consolidation box from 3.34 to 17.61, and the price has been fluctuating between these two areas for almost three years.
✔️ In the previous weekly candle, the support at 5.45 was broken, and now the price is moving towards the support at 3.34. This support is very crucial, and its breach could trigger another sharp drop.
🔽 There is also a descending trend line that the price has touched twice, and after being rejected by this trend, a significant amount of selling volume entered the market and induced a momentum that led to the breach of the 3.34 support.
📈 For XVS to turn bullish, the only trigger we have for now is the break of the trend line and the activation of its trigger. The trend line trigger is currently at 9.09. However, if the price creates a new structure, we might confirm a bullish turn sooner.
🛒 For buying in spot, the first trigger is the break of 9.09, which is considered a risky trigger in this timeframe. The main trigger is after 17.61.
⚡️ However, as I have mentioned in recent Bitcoin analyses, altcoin triggers and even the Total2 in spot don't currently hold much significance. For buying altcoins in spot, we should wait until Bitcoin dominance turns bearish.
📅 Daily Timeframe
Let's move to the daily timeframe to observe the details of the price movement more closely.
🧩 In this timeframe, we have a curved trend line that the price has hit several times and fallen.
⭐ Currently, after breaking 4.95, we can apply a Fibonacci Extension to find potential support areas. The price has reached the 0.618 level and has tested it. This area might be able to prevent further price falls. Otherwise, the next supports will be at the 0.786 and 1 Fibonacci levels, with the 1 area overlapping with the 3.34 support.
💥 The RSI oscillator is close to oversell and if this oscillator break the 30 level,it will support the bearish movement.
🔼 For buying or a long position, a suitable trigger is the 6.25 area, which is both a significant support and the last peak formed after breaking the 4.95 floor. The main trigger for the start of the primary bullish trend will be at 11.79.
📝 Final Thoughts
This analysis reflects our opinions and is not financial advice.
Share your thoughts in the comments, and don’t forget to share this analysis with your friends! ❤️
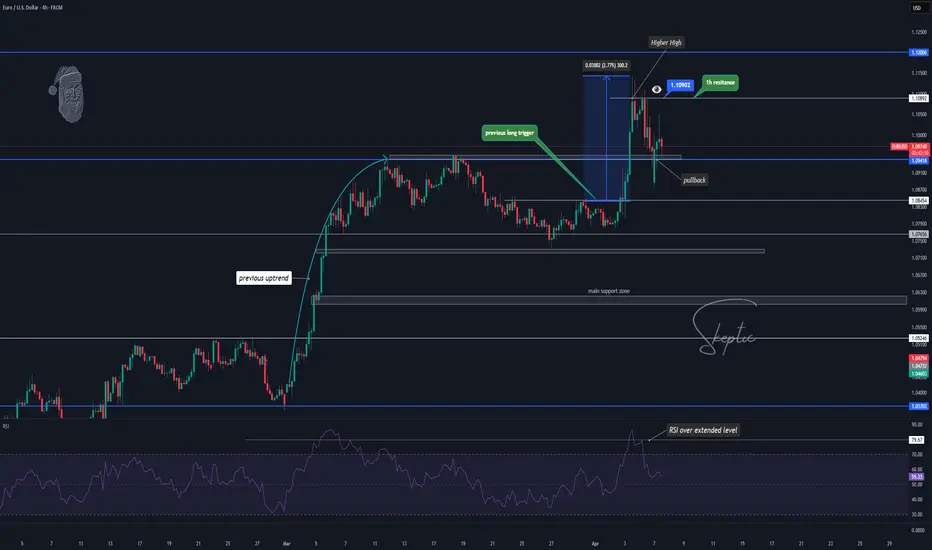
Skeptic | EUR/USD: Long and Short Triggers Ahead – Key LevelsWelcome back, guys! 👋 I'm Skeptic.
Today, we're diving deep into EUR/USD , breaking down the current structure and upcoming trade opportunities. 🔍
Recap & Current Structure:
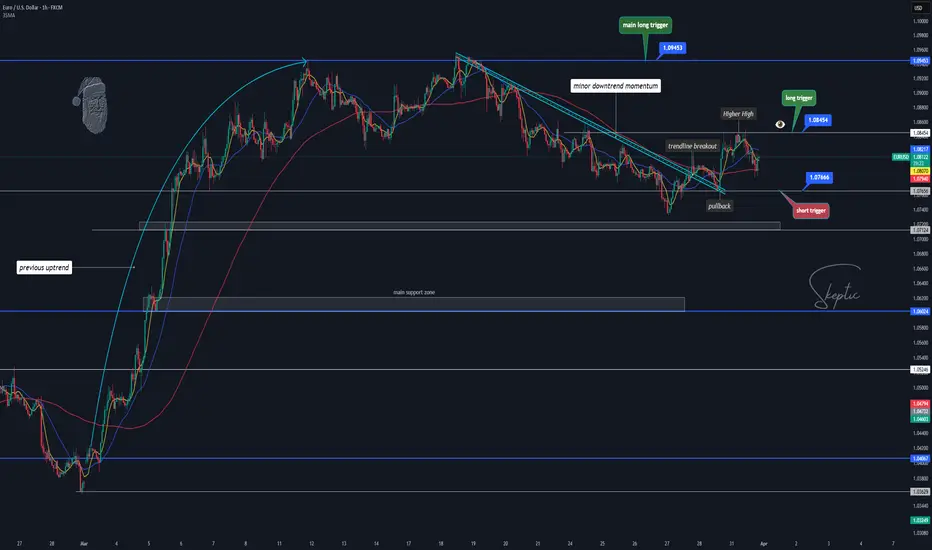
As mentioned in our previous analysis , after breaking the descending trendline and pulling back, we had created a higher high, indicating a potential move toward the top of the box at 1.09453. Our long trigger at 1.08454 played out well, reaching a 2.77 % upward move! If you followed the idea, you saw the results!
Currently, after breaking resistance at 1.09418 , we saw a pullback , and it's now acting as support. We also have a new resistance at 1.10892 , along with a higher high that confirms the uptrend. I’m still looking for long triggers as long as the trend remains intact.
However, as we always say, it's crucial to be skeptical and analyze the market from both sides. So, in the coming days, I’ll keep an eye out for both long and short triggers, depending on how the price moves.
📈 Bullish Scenario (Long Setup):
Trigger: Break & close above 1.10892
Confirmation: 7 SMA below the candle during the breakout + RSI entering overbought
Invalidation: Rejection + close back below 1.09418
📉 Bearish Scenario (Short Setup):
Trigger: Rejection at 1.10213 + drop below 1.09418
Confirmation: RSI entering below 42.22
⚠️ Key Notes:
Risk Management : Avoid overleveraging—wait for confirmed breaks before entering.
Stay sharp, and I’ll see you in the next analysis!
#BTCUSDT.. single supporting area, holds or not ??#BTCUSDT. perfect move as per our last couple of ideas regarding #btcusdt
Now market have current supporting area that is around 82300
Keep close that level because if market clear that level then we can expect a further drop towards downside next areas.
Good luck
Trade wisely

TradeCityPro | Bitcoin Daily Analysis #53👋 Welcome to TradeCity Pro!
Let's dive into the analysis of Bitcoin and key crypto indices. As usual, I want to review the New York futures session triggers for you.
💥 If you missed yesterday's analysis, I highly recommend checking it out. I cleared all the lines from all charts yesterday and redrew them from scratch, and now we have new areas that are optimized compared to before.
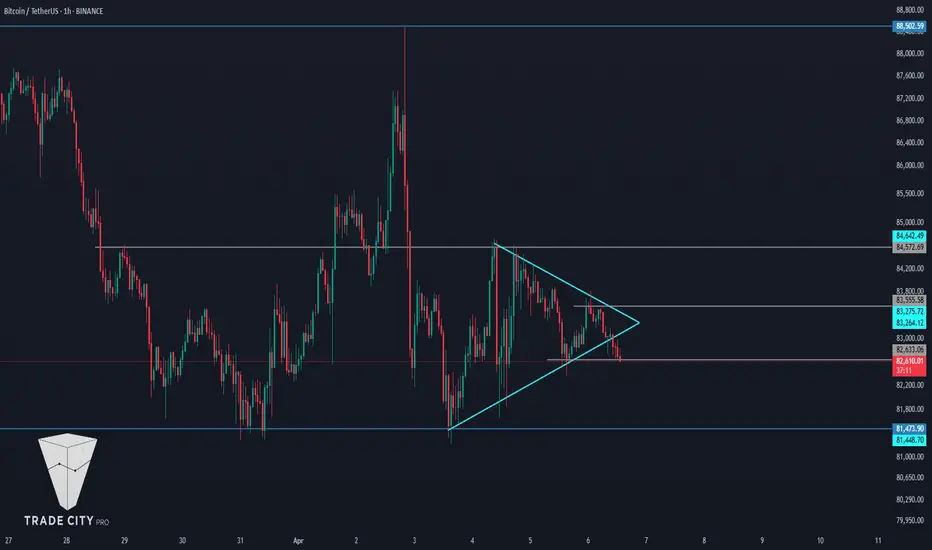
⏳ 1-Hour Timeframe
In the 1-hour timeframe, as you can see, there was a symmetrical triangle that has broken downwards, and now it's ready to activate its trigger if it breaks and move downwards.
⚡️ So, for opening a short position, you can enter upon breaking the short-term support at 82633. Preferably, keep a small stop loss so that if the price reaches 81473, the target of the position becomes active.
🎲 Although the triangle has broken, no significant selling volume has entered the market yet, and it's evident that the price is waiting for a good volume to enter to bring momentum.
📊 If no selling volume enters the market, the price could potentially move upwards towards the trigger at 83555. This trigger is risky for a long position, and breaking this area, we can open an early long position.
👑 BTC.D Analysis
Moving on to the analysis of Bitcoin dominance, as you know from yesterday's analysis, we concluded that the dominance trend is upward, and recently, with the breaking of 62.24, the next leg has started.
✔️ Currently, in this timeframe, a ranging box has formed between 62.65 and 63.07, and breaking the top of this box could continue the upward trend. On the other hand, breaking the floor at 62.65 could disrupt the upward trend for now, but as long as this doesn't happen, I still think the dominance has an upward trend.
📅 Total2 Analysis
Moving on to the Total2 analysis, this index is on a very important support floor in the area of 965B, and given the downward momentum that this index has had before, there is a possibility that this area might break.
🔑 If this support breaks, the next downward leg can start. Conversely, the same reason might cause this support to become so strong that it doesn't break.
📈 If the price is supported from this area and moves upward, the first risky trigger for long is at 989B, and the main trigger will be at 1.02T.
🔽 For short positions, as I mentioned, the 965B area is very important, and breaking this area could open a long-term position.
📅 USDT.D Analysis
Moving on to the analysis of Tether dominance, this index is dealing with an important resistance in the area of 5.53, and breaking this area would be akin to breaking the 965B in Total2.
☘️ For confirmation of a long position, 5.41 is suitable.
❌ Disclaimer ❌
Trading futures is highly risky and dangerous. If you're not an expert, these triggers may not be suitable for you. You should first learn risk and capital management. You can also use the educational content from this channel.
Finally, these triggers reflect my personal opinions on price action, and the market may move completely against this analysis. So, do your own research before opening any position.
TradeCityPro | RUNE: Decoding Its Descent in DeFi Markets👋 Welcome to TradeCity Pro!
In this analysis, I want to discuss the RUNE coin, which was requested in the comments of yesterday's analysis. This project is one of the DeFi projects, with a market cap of $383 million, ranking 118th.
📅 Weekly Timeframe
In the weekly timeframe, as you can see, it has started a downward leg from the peak of 6.894 and is moving downwards, reaching the area of 1.110.
✔️ Currently, it seems that the downward momentum has slightly decreased, and the price is moving downward more slowly. The RSI oscillator is also near the 30 area, ready to enter into Oversell and introduce a new downward momentum into the market.
💫 If this occurs and the price consolidates below 1.110, the next support will be 0.816, which is a very important floor, and if this area breaks, the last support the price will have is 0.386.
🔑 On the other hand, if the price is supported at 1.110 and breaks the trend line that the price has, we can confirm a trend change and the start of a new upward trend. The main trigger will still be 6.894.
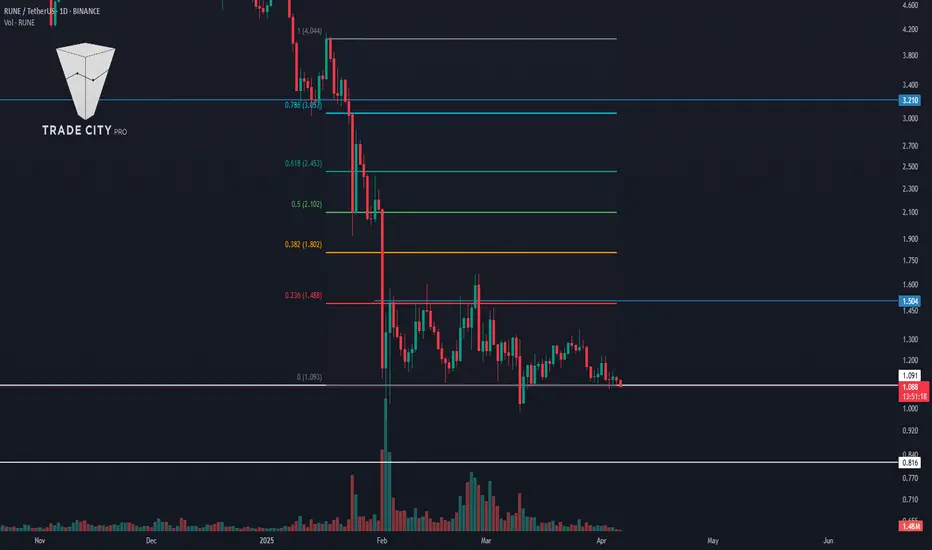
📅 Daily Timeframe
In the daily timeframe, the price has a range box between 1.091 and 1.504, and after the downward leg following the break of 3.210, it has now entered a ranging phase and is ranging in this area.
🔽 For a short position, given that the price has hit a lower high compared to 1.504, the likelihood of breaking the floor of the box is high, and with the break of 1.091, we can enter a short position.
📊 An important point is that the market volume in this range box has decreased significantly and keeps decreasing. With the entry of volume in any direction, the market can start moving in that direction.
📈 If buying volume enters the market, the first long trigger is the break of the 1.504 area. This area overlaps with the 0.236 Fibonacci, and breaking this area, the next important levels are 0.382, 0.5, and 0.618 Fibonacci.
📝 Final Thoughts
This analysis reflects our opinions and is not financial advice.
Share your thoughts in the comments, and don’t forget to share this analysis with your friends! ❤️
TradeCityPro | Bitcoin Daily Analysis #52👋 Welcome to TradeCity Pro!
Let's delve into the analysis of Bitcoin and the key cryptocurrency indices. Today, we have a detailed analysis on hand, and I want to start from scratch by drawing all the lines for Bitcoin and other indices so we can get informed about the higher time frames without drawing unnecessary lines.
🔍 Let's get into the analysis, where the charts will be examined in weekly, daily, and 4-hour time frames.
🦁 Bitcoin Analysis
📅 Weekly Time Frame
Let's explore the weekly timeframe. As you can see, the market trend is bullish, and since the price reached the low of 16,000, a bullish structure has formed, and the price has moved upward along a curved trendline. The trendline isn’t very clear on the chart, so I'll put another chart below for you if needed.
✔️ Currently, after two powerful bullish legs that occurred after breaking 31,000, the price has reached the resistance of 104,000 and has entered a corrective phase. The price was moving up with high momentum and no divergence until it reached 71,000, but the next peak at 104,000 was accompanied by divergence, and now the RSI is near triggering this divergence.
⚡️ Overall, the price is in a very critical and sensitive area, and breaking the 44.83 area on the RSI could activate the divergence, and simultaneously, the price may also break the curved trendline, which is not a good sign for the bullish trend and could indicate a trend reversal.
🔼 We must consider that the last bullish leg from 54,000 to 104,000 was much shorter compared to the leg from 31,000 to 71,000. However, I personally see the trend as bullish until the price drops below the 71,000 area, and until a lower high and low are seen below this area, the trend will remain bullish.
📊 If the price sharply falls, breaking 54,000 will confirm a trend change. However, we can get confirmation of a trend change sooner in lower time frames, which I will discuss in the continuation of the analysis.
💥 But everything is set for Bitcoin to rise. The RSI oscillator is at its main bottom, and in this bullish cycle, each time the RSI reached this area, the next bullish leg started. On the other hand, the price has reached the curved trendline, and there is positive news like Bitcoin's strategic reserves in the US, so conditions are ripe for a rise.
📈 Thus, with a break of 104,000, we can confirm the next leg and buy Bitcoin targeting a new ATH.
🎯 To find the target, we can use Fibonacci Extension. As you see, the price has moved up to the 0.618 Fibonacci level and reached the 104,000 area, currently in a corrective phase to 0.382. If it can rise above 0.618 again, the next targets are 0.786, 1, and 1.272, which correspond to areas 123,000, 154,000, and 204,000, respectively.
👀 Let’s go to the daily timeframe to observe the price details more closely.
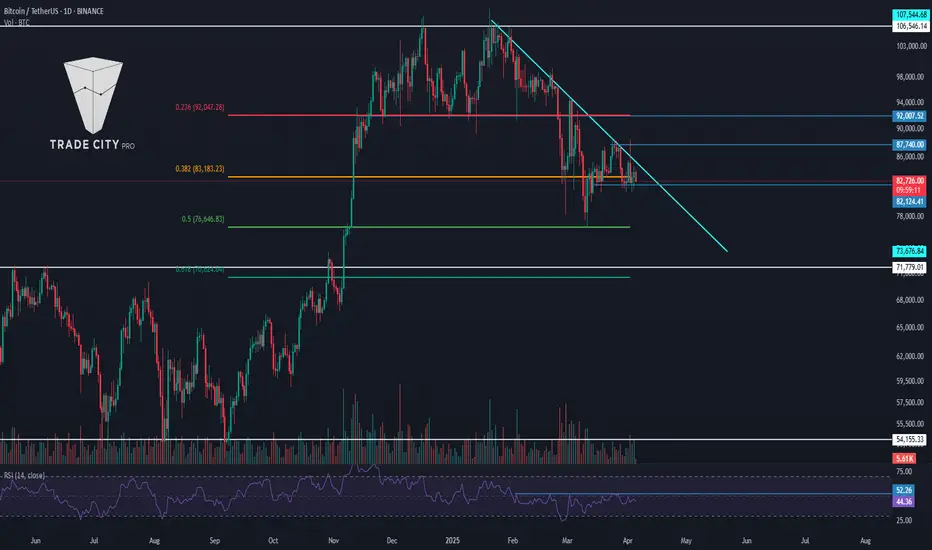
📅 Daily Timeframe
In the daily timeframe, as you can see, in the bullish leg that occurred after breaking 71,000, the price moved upward and reached 106,000 and, after breaking the 0.236 Fibonacci overlapping with 92,000, went into a deeper correction to 0.5.
⭐ In this corrective leg, the price has created a descending trendline that has been touched several times by the price and is now still engaging this area. If it can break this trendline, the correction will end, and we could see a price increase again.
🧩 In the RSI oscillator, a resistance has formed at 52.26, and breaking this area could bring bullish momentum into the market, which increases the likelihood of breaking the trendline and activating its trigger.
⚡️ There is also a temporary support in the area of 82,124, and if the price gets rejected from the trendline, the likelihood of breaking this support increases, and the price could undergo another bearish leg down to areas 76,000 or 71,000.
🛒 Currently, for buying Bitcoin in spot, the first trigger is the breaking of 87,740, which is a trendline trigger and will be activated after the trendline is broken. The main trigger will be after breaking 106,546, which is the ATH, and a new bullish phase could start.
☘️ The next trigger for Bitcoin is further falls and reaching lower support areas. If the price reaches areas 76,000 or 71,000 and forms a structure there, with the break of the ceiling of the structure, we can carry out a spot purchase, and if this happens, I will specify its triggers in future analyses.
⏳ 4-Hour Time Frame
Let's go to the 4-hour timeframe to review the triggers for Bitcoin futures.
🎲 As you see in this timeframe, a descending triangle has formed, and the price is moving inside it. The dynamic line of this triangle is the daily trendline, and the static line of this triangle is the 81,509 area, which both are important areas and can have a significant impact on the price.
✔️ We are currently in the latter half of the triangle, which is why behaviors and irrational fluctuations have increased, and as you can see, the price has once broken the ceiling of this triangle but couldn’t reach the trendline break trigger and has returned to the triangle.
📈 Currently, for a long position with the break of 84,414, you can enter a position. This position is risky because the trigger is inside the triangle and will be a prelude to breaking the daily trendline. The next main trigger will be after breaking the trendline and activating the 88,344 trigger.
🔽 For a short position, the bottom 81,509 is a very important floor, and with the break of this area, the price can move towards the triangle's target and the 78,620 support.
👑 BTC.D Analysis
📅 Weekly Time Frame
Let's move on to the analysis of Bitcoin dominance. In the weekly timeframe, as you see, a slow and steady bullish trend has been created after breaking 47.33, moving upward along with a bullish trendline, and has once broken this trend from below but has returned above this dynamic area.
🧲 As long as this index is bullish in the bullish legs of the market, Bitcoin will move up more than altcoins, and the increase in Bitcoin dominance causes altcoins to behave very similar to Bitcoin, and it is less likely that the trends of altcoins and Bitcoin diverge.
📚 You can see the impact of this trend inside the Bitcoin and altcoin charts. Bitcoin has registered its previous peak at 106,000 and has recorded a much higher ATH compared to 69,000, but most altcoins in this leg that the market had didn't even reach their previous peaks.
✨ The trend is still bullish without any weakness, and recently, an important ceiling in the area of 60.37 has been broken and has pulled back to it, and now it is moving towards the next resistance, namely 71.43.
💥 But I think dominance will fall before it reaches 71.43 because the dominance is very high right now, and any correction that Bitcoin has causes very severe falls inside the chart, and well, when altcoins fall enough, whales and major investors will enter the altcoin market, which naturally causes Bitcoin dominance to fall.
🔑 So to know when major investors and whales enter altcoins, we have to wait until Bitcoin dominance falls, and this event is currently happening in the weekly timeframe after breaking the trendline and confirming a trend change below this trendline, and until then, Bitcoin will be the capital for better purchases.
📅 Daily Timeframe
Let's move to the daily timeframe. As you can see, after breaking the resistance of 60.37, dominance created a box between 60.37 and 62.16, and now with the break of the box's ceiling, a new bullish leg of dominance has started.
✔️ I usually analyze dominances only with simple tools like support and resistance, but now because I can't get any targets out for dominance, I took help from Fibonacci, and as you see, the potential resistances of dominance are 63.31, 65.15, and 66.49.
🔍 Currently, there is no sign of weakness or trend change in this timeframe, but if for any reason dominance falls and returns below 62.16, we will take the main confirmation of trend change from 60.37.
😎 Let's go to the 4-hour timeframe to find suitable triggers for these dominance futures.
⏳ 4-Hour Time Frame
In this timeframe, we have a temporary ceiling in the area of 63.02, and if it is broken, the price can continue its bullish movement.
💫 For dominance to fall, we currently don't have any triggers in this timeframe and have to wait for a bearish structure to form.
📈 Total2 Analysis
📅 Weekly Timeframe
Let's move on to the analysis of Total2. In this chart, we can very clearly see the impact of Bitcoin dominance on altcoins.
👀 As you can see, the conditions of Total2 are very similar to Bitcoin and are converging, but Bitcoin in the last bullish leg it had registered a new ATH, and Total2 could not do this. On one hand, Bitcoin has just reached its curved trendline and is reacting to it, but Total2 has broken this trend line and has performed a bearish leg. For example, Bitcoin has not yet reached the 71,000 area, but Total2 has long broken 1.21T and is moving towards the bottom of 816B.
🔑 The reason for all these events is that Bitcoin dominance is bullish and causes more money relative to altcoins to enter Bitcoin, and this also makes the bullish trend of Bitcoin more powerful than this index.
🛒 For buying altcoins, the triggers of Total2 are areas 1.21T and 1.61T, but until Bitcoin dominance falls and its trendline is broken, do not pay attention to these triggers and enter the market with Bitcoin triggers while dominance is bullish.
📅 Daily Time Frame
Let's move to the daily timeframe. Concurrent with the fall of Total2, a descending channel has formed, which in Bitcoin was a descending trendline, but here, as you can see, Bitcoin is involved in breaking the trendline and starting an upward wave, but Total2 has long been rejected from the trendline and is involved in breaking the middle line of the channel, which overlaps with the 961B area, and with the break of this area, the next price leg can start.
⚡️ This is another example of the impact of Bitcoin dominance on the market. I mentioned these examples to get you to take dominances seriously and know how important they are and can help us in analysis.
🔽 The trigger for the fall and bearish turn of Total2, as I said, is the breaking of 961B, and if this area is broken, the price can move to the static supports of 816B and 683B. The dynamic support is the bottom of the channel, which can act as a support to prevent the price from falling.
📈 For bullishness and buying spot, breaking 1.1T is suitable. Again, I remind you that until Bitcoin dominance falls, these triggers are not very useful and do not initiate the trend of altcoins.
⏳ 4-Hour Time Frame
Let's move to the 4-hour timeframe to review the triggers for futures.
⭐ In this timeframe, I don't have much to say, and I just want to specify the triggers for you. For a long position, the area of 1.02T is suitable, but it is better that this happens after breaking the channel, which would turn it into a better trigger. The main long position will occur after breaking 1.1T.
📉 But for a short position, we have a very good and important trigger in the area of 961B, and I suggest that you definitely have a short position on an altcoin if this area is broken.
✔️ USDT.D Analysis
📅 Weekly Time Frame
In the weekly timeframe, Tether dominance has created a large box between 3.78 and 6.21 and has been moving between these two areas since early 2024.
💥 On the other hand, it has a descending trendline that the price has touched twice, and now it has reached it for the third time. A trendline that has been reacted to twice is not a very reliable trendline, but if the price returns from this area this time, we can confirm that this trendline exists and is a dynamic supply area.
☘️ Currently, with the range box that has formed, we have a very easy job for Tether dominance. With the break of 6.21, we confirm bullishness, and with the break of 3.78, we confirm bearishness.
📅 Daily Time Frame
Let's move to the daily timeframe, where we can witness more details.
🎲 As you can see, the price is very close to the trendline that was evident in the weekly timeframe and can activate its trigger.
⚡️ If the trendline is broken, a very important trigger exists in the area of 5.68, and with the break of this area, we can get confirmation of the bullishness of dominance at least until the ceiling of 6.34.
🧲 On the other hand, if dominance is rejected from this trendline, with the break of 5.03, dominance can create another bearish leg down to 5.37 or 3.78.
💣 I have nothing else to say about Tether dominance because its trend is ranging, and its situation is clear for now, let's move to the 4-hour timeframe to review the triggers for futures.
⏳ 4-Hour Time Frame
In this timeframe, we can change the trigger for bullishness a bit and bring it to the area of 5.56. If this area is broken, dominance can start a bullish leg.
🧩 For Tether dominance to fall, we also have a riskier trigger in the area of 5.43, and the main trigger will still be the area of 5.03.
🚨 This was a complete analysis of Bitcoin and the indices. It had been a while since we had looked at the higher timeframes, so I decided to review all the symbols in three timeframes. I hope this helps you and you can use this analysis.
❌ Disclaimer ❌
Trading futures is highly risky and dangerous. If you're not an expert, these triggers may not be suitable for you. You should first learn risk and capital management. You can also use the educational content from this channel.
Finally, these triggers reflect my personal opinions on price action, and the market may move completely against this analysis. So, do your own research before opening any position.
Skeptic | Gold Gears Up: Battle Between 3075.66 & 3128Welcome back, guys! 👋 I'm Skeptic.
Today, we're diving deep into XAU/USD (Gold) , breaking down the current structure and upcoming trade opportunities. 🔍
📊 Daily Structure:
The major trend remains bullish , with Gold showing strong upward momentum. If you've been following my previous breakdowns, you’ll remember I gave long triggers at 2955.31 , 3004.48 , and recently 3057.26 —all of which have played out well. Even if you entered based on your own signals in line with the trend, you should be sitting comfortably in profit.
🕒 1H Structure – What’s Next?
After that strong uptrend, Gold has entered a correction phase on the 1H chart.
📰 News Impact:
The recent announcement from President Trump imposing sweeping tariffs (10% baseline and up to 54% on China) has created major volatility across markets, including Gold. This geopolitical tension has added momentum to the asset, and we’re seeing it clearly on the chart.
📈 Bullish Scenario (Long Setup):
• Trigger: Break & close above 3128
• Since this aligns with the trend, larger targets and longer hold times are justified.
📉 Bearish Scenario (Short Setup):
• Trigger: Break & hold below 3075.66
• Manage risk carefully here—use tighter stop-losses and secure profits quickly since this is counter-trend.
⚠️ Key Notes:
🔹 Fundamentals: Heavy economic news flow today = High volatility expected.
🔹 Risk Management: Don’t overleverage. Only enter on confirmed breaks.
Stay skeptical, trade smart, and I’ll catch you in the next analysis! 👽📈

TradeCityPro | BNB: Analyzing Its Position in the Crypto Titans👋 Welcome to TradeCity Pro!
From today, we're returning to our usual routine on the channel, where we will provide two altcoin analyses and one Bitcoin analysis daily.
🔍 In this analysis, I want to review the BNB coin for you. It's one of the most important cryptocurrencies, with a market cap of $84 billion, ranking 5th in CoinMarketCap.
👀 This coin is officially for Binance exchange and is part of the projects that are profiting from the crypto space with a positive balance sheet. Let’s technically analyze this coin as well.
📅 Weekly Timeframe
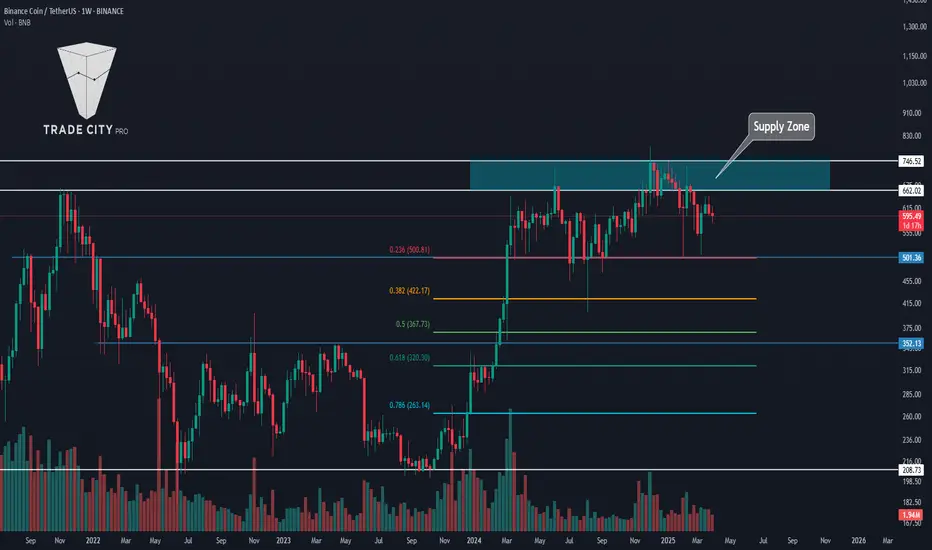
In the weekly timeframe, as you can see, there is a very large range box from 208 to 662 where the price has been moving since 2021.
💫 Currently, in the last leg where the price moved, it was supported at the area of 208 and began to form a base, then after breaking 352, it started an upward movement up to the resistance area of 662 to 746.
✔️ After reaching this area, a corrective and resting phase of the price began, and a box has formed between this area and the 501 area. The 501 area overlaps with the 0.236 Fibonacci, making it a very important PRZ for BNB.
❌ If you already own BNB, you can set your stop loss if the price consolidates below the 501 area because if this area is broken, the next significant support the price has is the 352 area, which is the most crucial support in this trend and overlaps with the golden Fibonacci area, and a fall to this area could happen.
🛒 For buying in spot, first of all, you must wait until buying volume enters the market so that the price can move upwards. The main trigger for spot is the break of 746, and if this area is broken, the main upward trend can start because the box that the price has built since 2021 will also be broken.
💥 Let’s move to the daily timeframe to analyze the price movement in the short term.
📅 Daily Timeframe
In this timeframe, we also have a range box from 484 to 750, and in this leg, an expanding triangle has formed, which causes the market volatility to increase and the price to show less reaction to static areas.
⭐ On the other hand, because we have a range box and the price is ranging, we can't rely much on indicators and oscillators because they give us incorrect data.
🎲 In this market condition, we shouldn't check too much data and unnecessarily clutter the chart. For a long position, you can enter with the break of the 638 area. It would be better if this break occurs simultaneously or after the triangle break, allowing for more risk.
🔼 The main trigger for buying in spot, as mentioned in the weekly timeframe, is 746, which becomes 750 in this timeframe, and you can proceed with your spot purchase if this area is broken.
📉 For short positions and in general for a bearish scenario, the first trigger is 569, which is a very risky trigger, and in my opinion, we should wait for the price to react to it to be sure of the exact place of this area.
✨ The next triggers are 531 and 484, where 531 is a logical trigger and 484 is the main trigger for a trend change in the large market cycle.
📝 Final Thoughts
This analysis reflects our opinions and is not financial advice.
Share your thoughts in the comments, and don’t forget to share this analysis with your friends! ❤️
BTC Weekly Chart Update📉 CRYPTOCAP:BTC Weekly Chart Update
It looks like a double top pattern is clearly forming on the BTC weekly chart — and honestly, doesn't it remind you of a similar structure we’ve seen before? 👀
Patterns like these often signal potential trend reversals, so this is definitely a chart to watch closely.
Do you see the similarity with the previous one? Let me know your thoughts in the comments 👇
🔴 Bearish scenario could continue unless we break above key resistance.

TradeCityPro | APTUSDT The Beginning of a New Downtrend!👋 Welcome to TradeCityPro Channel!
Let's go back to the day when Trump imposed tariffs on the United States again, causing stocks and cryptocurrencies to fall and gold to rise. Let's take a look at our attractive altcoin chart
🌐 Overview Bitcoin
Before starting the analysis, I want to remind you again that we moved the Bitcoin analysis section from the analysis section to a separate analysis at your request, so that we can discuss the status of Bitcoin in more detail every day and analyze its charts and dominances together.
This is the general analysis of Bitcoin dominance, which we promised you in the analysis to analyze separately and analyze it for you in longer time frames.
📊 Weekly Timeframe
APT remains inside its large, volatile range, frequently bouncing between its highs and lows. However, this time, it has formed a lower high, which is not a positive sign.
Additionally, after breaking $7.78, sellers completely engulfed the weekly candle, and for the past five weeks, all candles have been red with high selling volume, confirming the downtrend.
There is no buy trigger at the moment, and I cannot recommend a buying opportunity until the market forms a new structure.
For selling, if APT drops below $4.97, it makes sense to exit and accept the loss instead of holding onto a losing position.
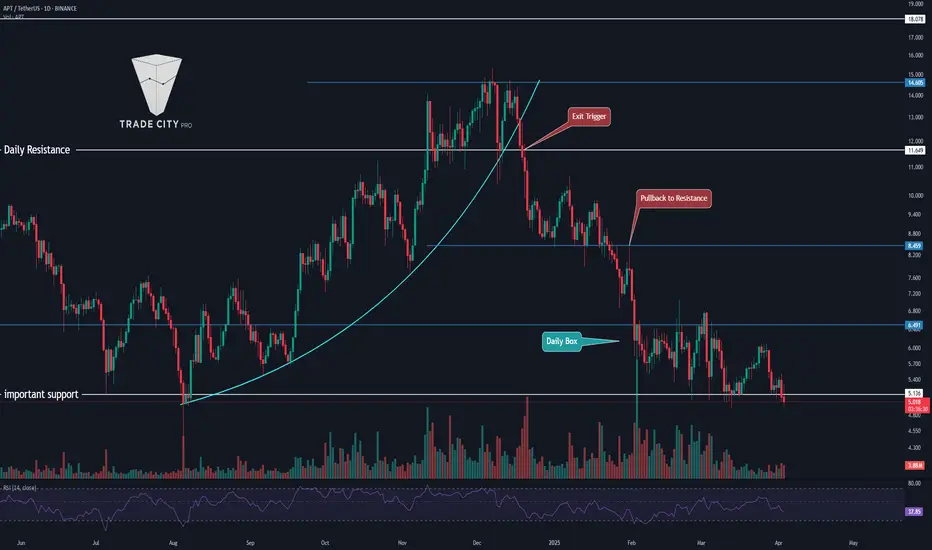
📉 Daily Time Frame
In the daily time frame, the power is in the hands of the sellers! After the parabolic line broke, we experienced a Sharpe decline, accompanied by the formation of a lower ceiling and floor, which has continued our downward trend.
The parabolic movement itself is a very rapid and bullish movement, and every time the price hits it, it quickly returns to its trend and is supported, but when this line is broken, that trend is practically over and we suffer, or we experience a Sharpe decline like this chart!
After the drop and the formation of a box between 5.136 and 6.491, the selling force was clearly evident in this space, because the last time we moved towards the ceiling of 6.491, we could not reach this ceiling and we were rejected earlier.
This rejection made us return to this support faster with a number of red candles, unlike the previous attempt where we moved up with a larger number of candles. Yesterday's daily candle also engulfed the previous 3 candles and is exactly ready to break 5.136.
If today's daily candle closes in the same way, the probability of a drop in the coming days will increase and increase. If you are a holder of this coin, it is logical to sell and after returning to the box and breaking its ceiling, buy with the same number of Tethers and reduce the probability of a drop and loss of capital for yourself!
✍️ Final Thoughts
Stay level headed, trade with precision, and let’s capitalize on the market’s top opportunities!
This is our analysis, not financial advice always do your own research.
What do you think? Share your ideas below and pass this along to friends! ❤️
Skeptic | EUR/USD at a Crossroads: Breakout or Reversal?Welcome back, guys! 👋 I'm Skeptic.
Today, we're diving deep into EUR/USD , analyzing key levels and potential triggers.
🔍Recap & Current Structure:
As mentioned in our previous analysis , after the previous uptrend, EUR/USD entered a consolidation phase. Our short trigger at 1.07124 played out well, reaching an R/R of 2—if you followed the idea, you saw the results!
Now, we’ve formed a new structure , which is more visible on the 1H timeframe. After breaking the descending trendline and pulling back , we've now created a higher high , indicating a potential move toward the top of the box at 1.09453 .
With DXY weakening, the expectation leans towards an uptrend continuation, but we remain flexible—if our short trigger activates, we'll take it as well because we approach the market with a two-sided, skeptical view rather than a fixed bias.
📈 Bullish Scenario (Long Setup):
Trigger: Break & close above 1.08454
Confirmation: 7 SMA below the candle during the breakout + RSI entering overbought
]Invalidation: Rejection + close back below 1.07666
📉 Bearish Scenario (Short Setup):
Trigger: Rejection at 1.08278 + drop below 1.07666
Confirmation: RSI entering oversold
⚠️ Key Notes:
Fundamentals: This Friday is NFP day—a crucial event for the markets.
Given the recent uptrend in EUR/USD, a pullback is likely, so stay prepared for both triggers.
Risk Management: Avoid overleveraging—wait for confirmed breaks before entering.
Stay sharp, and I’ll see you in the next analysis!
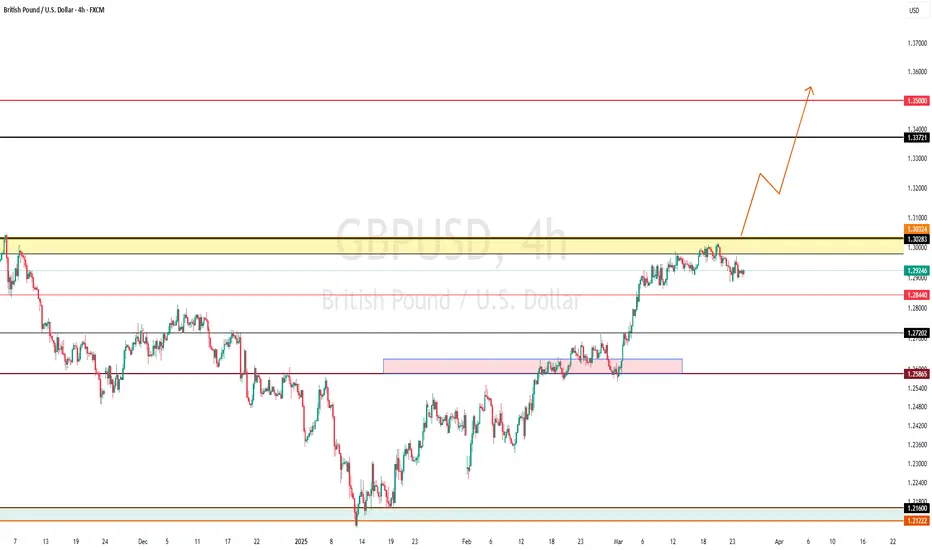
Skeptic | GBP/USD Deep Dive: Major Trend, Trade Setups!Hey guys, welcome back! 👋 I'm Skeptic.
Let’s dive into GBP/USD , a pair that’s been in a strong uptrend and has the potential for another solid price jump. We’ll break it down across multiple timeframes , do a deep analysis , and at the end, I’ll share high-probability long & short setups with clear triggers—so stick around!
Daily Timeframe Analysis
As you can see, GBP/USD has been respecting an uptrend channel , reacting well to both the upper, lower, and midlines —a key characteristic of a strong trend. Each time price makes a jump, it enters a range box (re-accumulation phase) before breaking out to continue the trend.
Currently, we’re inside another range between 1.28720 - 1.29883 . A breakout in either direction can give us a trading opportunity, but given the major trend is bullish , I prefer trading in the direction of the trend unless we get a clear reversal signal.
4H Timeframe Analysis
The uptrend channel remains intact , and we’re still within the Consolidation phase . We recently saw a fake breakout , which could mean that the next breakout might happen with stronger momentum.
Trade Setups
✅ Long Setup:
- Entry: After a confirmed breakout of 1.29883
- Confirmation: RSI breaking above 65.33 (which acts as an overbought signal in this case)
- Preferred Order: Stop Buy above resistance to catch momentum
❌ Short Setup:
- Entry: After a confirmed break of 1.28682
- Risk Management: Since this is against the trend, take quick profits and use a tighter SL to manage risk efficiently.
What are your thoughts on GBP/USD? Drop your opinions in the comments! Let’s grow together, not alone. 🚀🔥

TradeCityPro | Bitcoin Daily Analysis #51👋 Welcome to TradeCity Pro
Let's move on to the fiftieth analysis of Bitcoin and key crypto indices. In this analysis, as usual, I want to review the New York futures session triggers for you.
⏳ 1-hour timeframe.
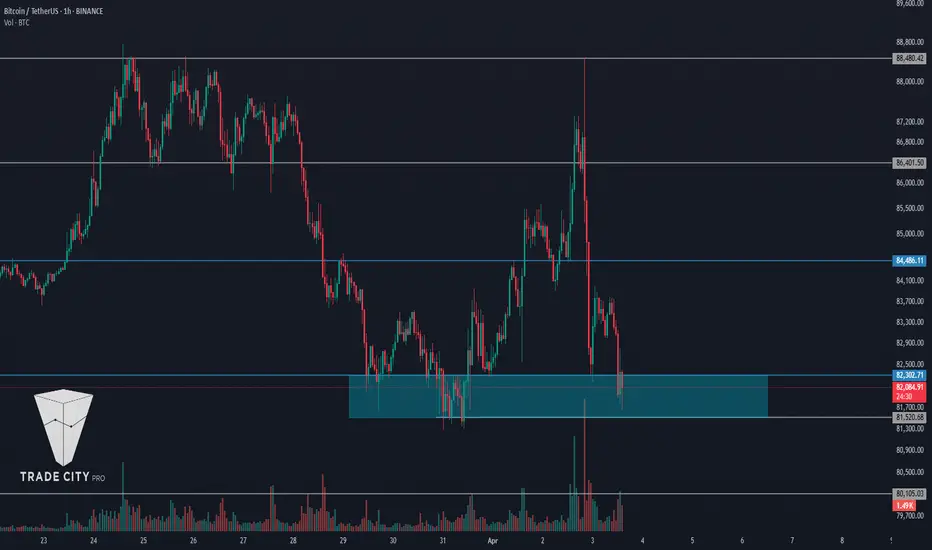
As you can see in the 1-hour timeframe, after the news of US tariffs, the market experienced a drop to the support zone, and now, for the second time, it has penetrated this area.
🔍 If this range between 81520 and 82302 is broken, the price could start the next bearish leg, but another important support is located at 80105, which might prevent further decline.
🔽 For a short position, breaking this range is suitable. For a long position, it's better to wait until a new structure forms.
👑 BTC.D Analysis
Moving on to Bitcoin dominance, the 62.64 zone has also been broken, and dominance has pulled back to it and is now moving upward.
💫 I cannot determine a resistance level at the moment, and we need to wait until the price structure forms new resistance levels.
⚡️ For now, I see Bitcoin dominance as bullish, so it's better to choose Bitcoin for long positions and altcoins for short positions.
📅 Total2 Analysis
Moving on to the Total2 analysis, yesterday the price pulled back to 990 and has now reached 953.
✔️ If this zone is broken, the price could experience a sharp bearish movement and start the next leg. For a long position, like Bitcoin, we need to wait for a new structure to form.
📅 USDT.D Analysis
Moving on to USDT dominance, a very sharp upward move with strong momentum has occurred, and a higher low compared to 5.05 has been formed.
🧩 Currently, there is an important resistance at 5.56, and the price has reached this level. If this zone is broken, dominance will turn bullish.
💥 For a bearish move in dominance, like other indices, we need to wait for a new structure to form.
❌ Disclaimer ❌
Trading futures is highly risky and dangerous. If you're not an expert, these triggers may not be suitable for you. You should first learn risk and capital management. You can also use the educational content from this channel.
Finally, these triggers reflect my personal opinions on price action, and the market may move completely against this analysis. So, do your own research before opening any position.
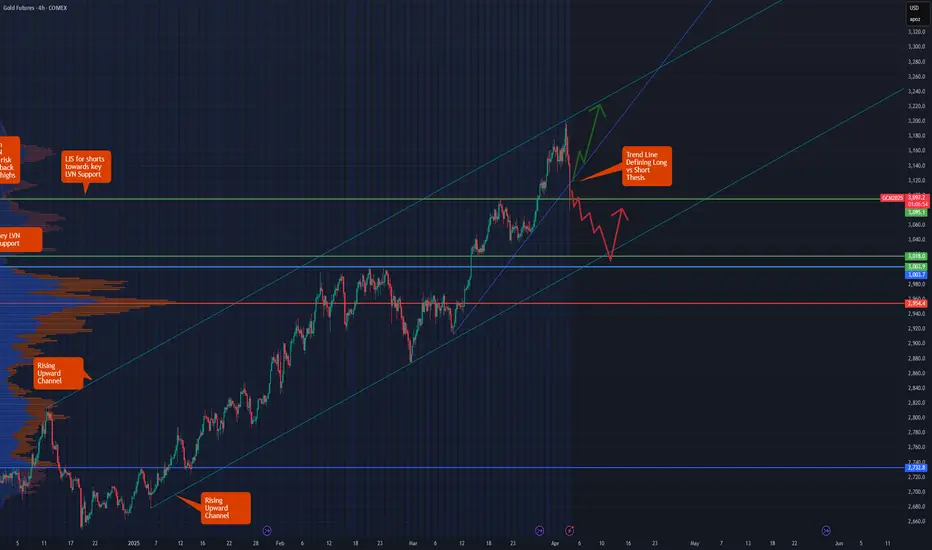
Gold Futures: Flight of the PhoenixCOMEX:GC1!
Gold Futures Analysis:
Gold futures are currently presenting a clearer picture compared to equity index futures. Crude oil futures, on the other hand, have already priced in much of the recent tariff news, with a reversal observed from the 2025 mid-range back towards $65. Despite heightened volatility, the WTI crude oil market remains relatively balanced, with bearish sentiment materializing, if prices drop below and stay below the $65 mark.
Gold futures, however, are offering more defined risk-reward opportunities at the moment. Our analysis shows a macro bullish trend in gold, along with price discovery and market auction trends visible on lower timeframes.
On the 4-hour chart below, we observe a rising upward channel, with key levels identified and reasoning for these levels labeled on the chart.
Key Levels:
• ATH: 3201.6
• HVN (High Volume Node) for long entry: 3115
• LVN (Low Volume Node)/LIS for short entry: 3095.1
• Key LVN Support: 3003.7-3018
Scenario 1: Bearish Continuation
If Gold futures stay below the trend line that defines both our long and short trade ideas, the bearish scenario could materialize. For a short trade to be viable, we would look for a close below the LVN/LIS level (3095.1) and enter on a pullback, targeting the major LVN support zone around 3018.0.
Example trade parameters for Scenario 1:
• Entry: 3095.1
• Stop: 3125
• Target: 3018
• Risk: 29.9 points
• Reward : 77.1 points
• Risk to Reward Ratio: RRR=77.1/29.9 ≈2.58
Scenario 2: Bullish Reversal
In the event that Gold futures push back towards all-time highs due to heightened uncertainty and a flight to safety, we expect initial profit-taking by shorter timeframe traders to provide a pullback. This could present a long opportunity towards the all-time highs.
Example trade parameters for Scenario 2:
• Entry: 3115
• Stop: 3095
• Target: 3200
• Risk : 20 points
• Reward : 85 points
• Risk-to-Reward Ratio: RRR= 85/20 = 4.25
Important Notes:
• These are example trade ideas, and traders are encouraged to do their own analysis and preparation before entering any positions.
• Stop losses are not guaranteed to trigger at specified levels, and actual losses may exceed predetermined stop levels.
GBPUSD - near to his very expensive region, what's next??#GBPUSD... market just trade in range just below is most expensive region and that is market swing region as well.
keep close that region and only only buy above that region.
means don't holds your shorts above that region.
upside we have long leg if market clear that region.
good luck
trade wisely