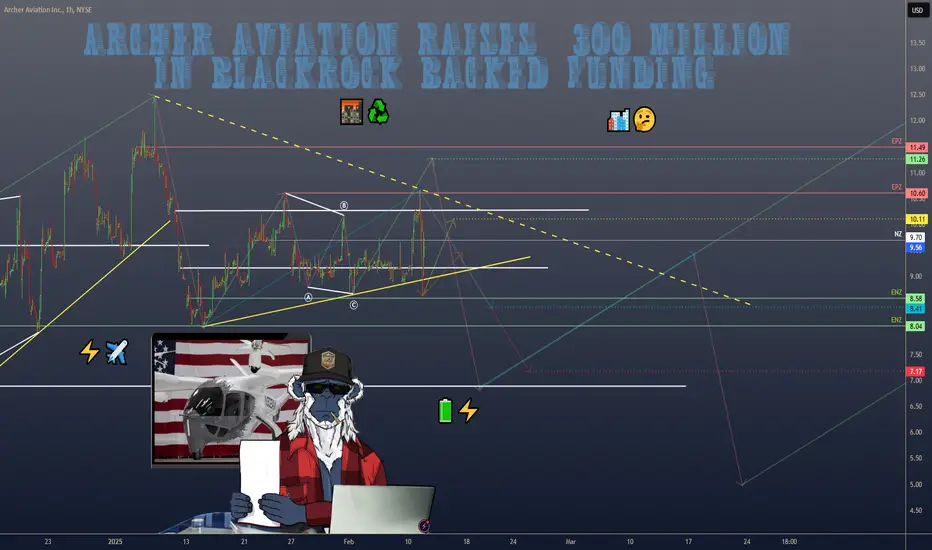
$ACHR ARCHER AVIATION SCORES 300M BOOST BLACKROCK JOINS THE RIDEARCHER AVIATION SCORES $300M BOOST—BLACKROCK JOINS THE RIDE
1/7
🚀 $300M just landed in Archer Aviation’s pocket! Major institutional investors like BlackRock are backing Archer’s quest to dominate the eVTOL game. Ready to see why this funding is a big deal? Let’s go! ⚡️✈️
2/7 – WHAT’S ARCHER BUILDING?
Midnight Aircraft: Designed for short urban flights (~20 miles) with rapid turnarounds.
Targets commercial operations by 2025, battling congestion & pollution. 🌆
Hybrid Approach: Electric + other propulsion to boost range and expedite FAA certification.
3/7 – BLACKROCK’S INVOLVEMENT
Big Vote of Confidence: World’s largest asset manager sees serious potential. 💪
Aligns with green investing—eVTOLs can slash emissions compared to helicopters. ♻️
Could draw more partnerships and capital to Archer’s runway.
4/7 – WHY COMPOSITES & BATTERIES MATTER
Composites: Lighter & stronger materials = extended range & higher efficiency. 🏋️♀️
Batteries: High-energy density is critical for flight duration & payload. 🔋⚡️
Archer’s push here signals they’re tackling the industry’s biggest hurdles head-on.
5/7 – FINANCIAL & STRATEGIC IMPACT
Stronger Balance Sheet: $300M for R&D, testing, manufacturing. 💼
Timing is key: Archer eyes FAA approval soon—this cash could speed up that process. ⏱️
Competing with Joby, Vertical Aerospace, Lilium—the race is on! 🏁
6/7 Are eVTOLs the future of urban travel?
1️⃣ Absolutely—Game-changer for city traffic! 🏙️
2️⃣ Maybe—Need more proof and better tech. 🤔
3️⃣ Nope—I’m still skeptical about costs & safety. ❌
Vote below! 🗳️👇
7/7 – INDUSTRY CONTEXT
Market could hit $1.5T by 2040 (Morgan Stanley). 💰
Key markets: US, UAE, Japan, India—Archer is eyeing them all. 🌏
eVTOLs promise faster, greener commutes, but hurdles remain: regulations, infrastructure, battery tech.
Strengths: Archer’s recent $300 million funding, strategic partnerships, and regulatory progress position it well to compete in the eVTOL market. Its focus on composites and batteries aligns with industry needs.
Weaknesses: High R&D costs, limited manufacturing capacity, and lack of commercial revenue highlight financial and operational challenges.
Opportunities: The growing eVTOL market, international expansion, and defense applications offer significant growth potential.
Tradingview
TradeCityPro | Bitcoin Daily Analysis #2👋 Welcome to TradeCityPro!
Let’s analyze Bitcoin and identify suitable futures triggers for the New York session.
⌛️ 1-Hour Timeframe
If you entered a position yesterday on the price pullback to the 97218 zone, you're now in profit. If your position has a risk-to-reward ratio of 2 or higher, I recommend securing some profits. Otherwise, if you want to keep your position open, watch the 98903–99946 range, and if the price gets rejected from this area, secure your profits.
🔍 We also have new trade setups for today, with two triggers for long and two for short, either of which could activate. For a long position, a breakout of 98903 or 99946 is suitable. The 98903 breakout is riskier since we’d be entering a long position within a resistance zone, while the 99946 breakout may be difficult to enter as it might not provide a strong confirmation candle but is a safer long entry.
🔼 The key resistance above these two triggers is 101819, which can be used as a target. A breakout above 64.74 in the RSI would also serve as a momentum confirmation.
📉 For short positions, the first trigger is a breakdown of 97218, which has acted as a strong minor support. If we see a reaction here, this level will be confirmed, and on a second test, we can enter a short position. A breakdown of the 50 level in the RSI would confirm this setup. However, this is a risky trade, so it should be taken with minimal exposure.
✔️ The next key level is 95797, which has seen multiple price reactions. If the price forms a lower high below 101819, the chances of breaking this level increase. The target for this short setup is 92700.
👑 BTC.D Analysis
Yesterday, I mentioned that if Bitcoin dominance stabilized below 61.34, long positions on altcoins would be more logical, which played out as altcoins outperformed Bitcoin.
✨ Today, if BTC.D remains below 61.06, it could indicate a trend shift in higher timeframes. Conversely, if it reclaims 61.34, Bitcoin could once again be the better choice for long positions in a bullish market.
⌛️ Total2 Analysis
Total2 triggered its setup alongside Bitcoin and is now testing the 1.24 zone. The only long trigger at the moment is a breakout of 1.24. However, keep in mind that the primary trigger was at 1.22, and the next major trigger is at 1.28, making any long entry now quite risky. Personally, I wouldn’t take this trade.
💫 For short positions, wait for the price to drop back below 1.22, then use Dow Theory and a break of the newly formed low as a short entry trigger.
⌛️ USDT.D Analysis
Now, let’s analyze USDT.D. This index began its decline after breaking 4.51 and retesting it. The next trigger is at 4.41, and if it breaks, we can expect a further drop to 4.22.
🧩 On the other hand, if it reclaims 4.51 and moves toward 4.64, it could increase the likelihood of Bitcoin’s 97218 short trigger being activated. If USDT dominance rises, the target will be 4.64.
❌ Disclaimer ❌
Trading futures is highly risky and dangerous. If you're not an expert, these triggers may not be suitable for you. You should first learn risk and capital management. You can also use the educational content from this channel.
Finally, these triggers reflect my personal opinions on price action, and the market may move completely against this analysis. So, do your own analysis before opening any position.

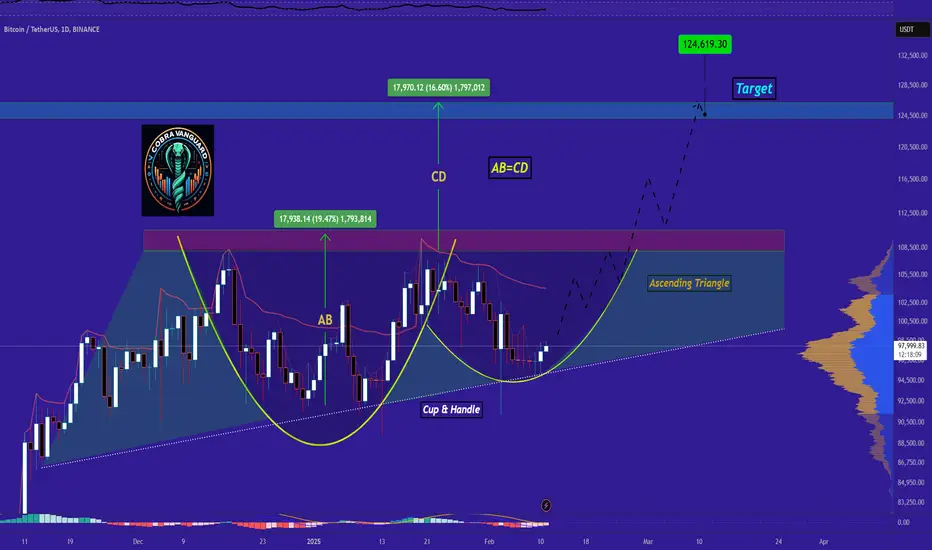
BITCOIN - Time to buy again!As you can see, the price is forming two bullish patterns on the daily timeframe, If my view is correct, btc will rise to 120k .
And if this pattern is correct and breaks, higher targets are possible.
Give me some energy !!
✨We spend hours finding potential opportunities and writing useful ideas, we would be happy if you support us.
Best regards CobraVanguard.💚
_ _ _ _ __ _ _ _ _ _ _ _ _ _ _ _ _ _ _ _ _ _ _ _ _ _ _ _ _ _ _ _
✅Thank you, and for more ideas, hit ❤️Like❤️ and 🌟Follow🌟!
⚠️Things can change...
The markets are always changing and even with all these signals, the market changes tend to be strong and fast!!
GOLD - single supporting area, holds or not??#GOLD. perfect move in Tokyo and Asian session as per our video analysis and now market again near to his major supporting area that is around 2898 to 2901
keep close that region because if market hold it in that case we can see again bounce from here otherwise not at all.
so keep in mind that below 2898 we will go for cut n reverse on confirmation.
good luck
trade wisely

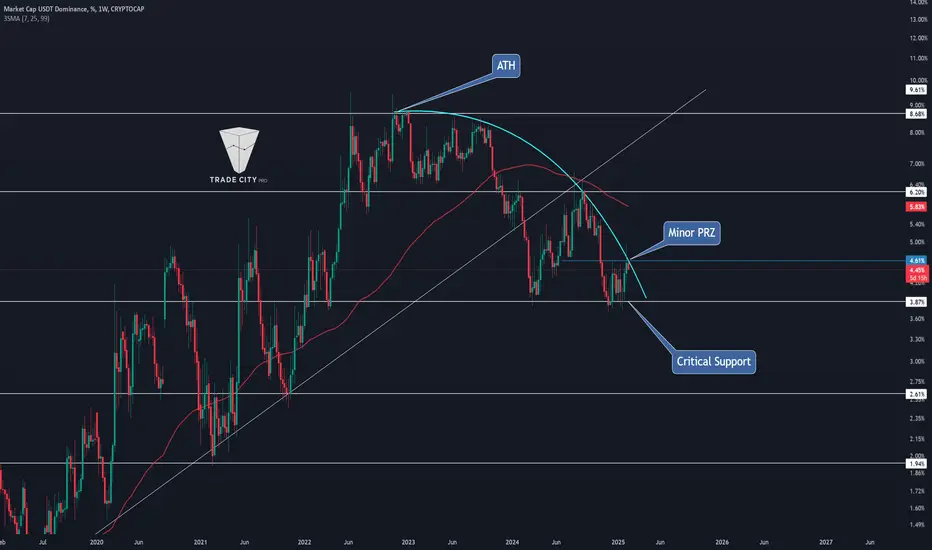
TradeCityPro | USDT Dominance Key Levels & Market Impact👋 Welcome to TradeCityPro!
In this analysis, I will break down USDT.D, one of the most critical indicators in crypto, which reflects the amount of money held in Tether dominance.
🔑 The higher the dominance, the more altcoins are being sold and converted into USDT. Conversely, when dominance decreases, USDT is being sold and converted into other cryptocurrencies. As a result, this chart usually moves inversely to Total2 and other crypto assets—when USDT dominance rises, Total2 typically declines, and vice versa.
📅 Weekly Timeframe
In the weekly timeframe, we observe an uptrend that followed an ascending trendline. However, after getting rejected at the 8.68 resistance, the trendline was broken, initiating a bearish leg that closely followed a descending curved trendline, reacting strongly to it. After reaching 3.87, the price made a deep pullback to the previous ascending trendline. Given the PRZ formed by the confluence of the trendlines, the 6.20 resistance, and the SMA99, the next bearish leg began.
🔍 Currently, the price has once again reacted to 3.87 and pulled back to the curved trendline. If this zone holds as resistance, the probability of 3.87 breaking on the next test increases significantly, potentially triggering the next bearish leg. This leg could extend down to 2.61, although considering the current liquidity in USDT, such a deep drop seems unlikely but remains technically possible.
🔼 If the curved trendline is broken and the trigger activates at 4.61, the price may form a consolidation box between 3.87 and 6.20. Upon breaking 4.61, we could see a movement toward the top of the range. The SMA99 has been a strong dynamic resistance, with multiple price reactions to it, so it could play a key role if USDT dominance increases.
📅 Daily Timeframe
In this timeframe, we see an accumulation box forming between 3.87 and 4.36, which was broken a few days ago. If the price stabilizes above 4.36, a move toward 4.99 is likely, with the ultimate target at 6.20, as mentioned in the weekly timeframe.
📉 If the price re-enters the accumulation box and this breakout turns out to be a fake move, strong bearish momentum could enter the market, significantly increasing the probability of a 3.87 breakdown.
✨ There are no other notable points in the daily chart—this timeframe has provided clear triggers. Now, let’s move on to the 4-hour timeframe for futures trade triggers.
⌛️ 4-Hour Timeframe
In this timeframe, we can see the recent price movements in more detail. As shown, the price has formed a key resistance at 4.60, which could be a decisive level. If this area is broken, it will confirm the accumulation box breakout, increasing the likelihood of a move toward 4.99.
✔️ On the other hand, if the price drops below 4.44 and re-enters the accumulation box, the entire upward move will be invalidated. In that case, breaking 4.23 could trigger further declines, leading to a test of the bottom of the accumulation range.
📝 Final Thoughts
This analysis reflects our opinions and is not financial advice.
Share your thoughts in the comments, and don’t forget to share this analysis with your friends! ❤️
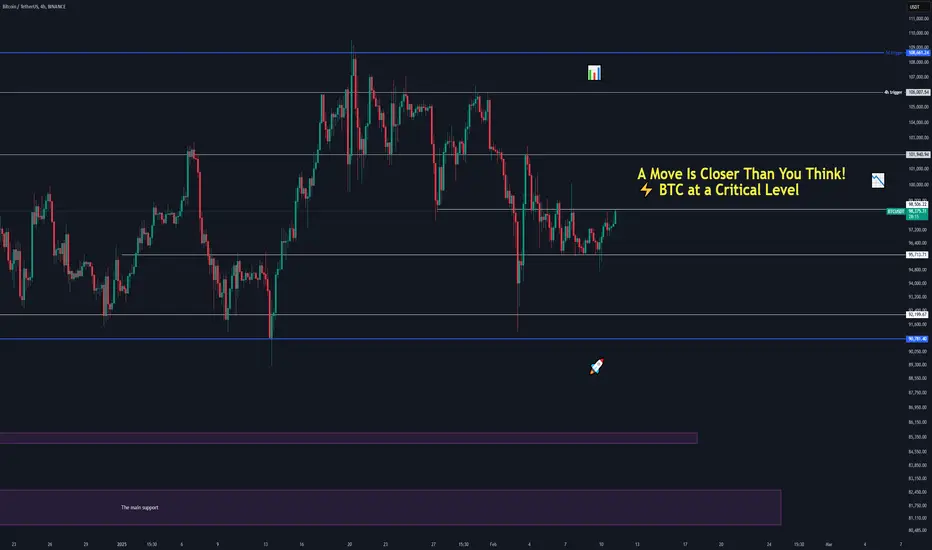
Daily Market Outlook: BTC & Forex Setups (#1)From today, I’ll be sharing daily BTC & Forex market breakdowns, covering key levels, potential trade setups, and insights into market psychology. These won’t just be standard analyses—I’ll also include the setups I personally take and why.
Let’s get straight into today’s breakdown. 🔥
📌 BTC Daily & 4H Analysis
BTC has held the $95K support zone well, but volume remains extremely low. The doji candles forming on the daily indicate market indecision and lack of strong buying or selling pressure.
📊 Key Takeaways:
Order books are thin, meaning any slight increase in volume could trigger a sharp, volatile move.
I’m favoring long positions, as they align with the higher timeframe trend.
Key Levels to Watch:
🎯 High-Risk Entry: $98,506 – Offers high R/R and a chance to hold the trade longer toward a potential breakout of $107K.
✅ Safer 4H Entry: $106K – More conservative but ensures confirmation.
Major Daily Breakout Trigger: $108,660 – Expect high momentum, so it’s better to anticipate the move rather than react late.
📌 DXY Analysis – Key to Forex Market Movement
The Dollar Index (DXY) remains in a major uptrend, but momentum is weakening, making its movement more uncertain.
📊 Key Levels:
If 107.288 - 107.443 fails as support, expect a deeper correction.
Otherwise, DXY remains bullish, which could pressure risk assets.
📌 GBP/CHF 4H – Breakout Play
GBP/CHF is currently ranging on the daily timeframe, but on 4H, we have a clear range box.
📊 Potential Trade Setups:
Long above 1.13121 🎯 – If resistance breaks, target higher levels.
Short below 1.12326 🔻 – If support fails, expect further downside.
Bias: Since the previous fake breakdown failed, I see a bullish breakout as the more likely scenario.
📌 JP225 – Channel Uptrend Setup
JP225 is trending within an ascending channel and recently faked a breakdown before reclaiming higher levels.
📊 Trade Plan:
Breakout of 38,949 → Go long if confirmed.
Major Risk Event: US Inflation Data (Wednesday) – Could bring major volatility, so trade with caution.
📌 Market is in a decision-making phase—don’t FOMO, wait for confirmation.
📌 Wednesday’s CPI data could be a key volatility trigger.
📌 Stick to your trading plan & manage risk properly.
🔔 See you tomorrow for the next breakdown! Stay sharp.
SONIC - Time to buy again!The price has formed a Triangle on the 4h time frame, and if it breaks out, it can drive the price up to around $0.40.
Give me some energy !!
✨We spend hours finding potential opportunities and writing useful ideas, we would be happy if you support us.
Best regards CobraVanguard.💚
_ _ _ _ __ _ _ _ _ _ _ _ _ _ _ _ _ _ _ _ _ _ _ _ _ _ _ _ _ _ _ _
✅Thank you, and for more ideas, hit ❤️Like❤️ and 🌟Follow🌟!
⚠️Things can change...
The markets are always changing and even with all these signals, the market changes tend to be strong and fast!!

TradeCityPro | TOTAL2 BullRun Trigger Identified!👋 Welcome to TradeCityPro Channel!
Let's go together to examine and analyze the Total 2 chart in the Dominance section, which includes all cryptocurrency coins except Bitcoin in its chart.
🌐 Overview Bitcoin
Before starting the analysis, as usual, we wanted to take a look at Bitcoin in the one-hour time frame, but we made an interesting decision with the team guys and decided to analyze Bitcoin for you every day with a poll that we posted in Telegram. Today's analysis was also uploaded before the start of the New York session and you can see it from the link below.
📊 Weekly Timeframe
In the weekly time frame, we were rejected from our ceiling, which is an important point of $1.62 trillion, and this makes the ceiling more and more important for us than ever.
Let me also tell you a teaching point that I just pointed out to you on a candle on the chart, and these candles are mostly made at the market ceiling or a place where At least we are going to get rejected from it and it is an important resistance for us and they are usually red and have a longer shadow than the body from below. I suggest you watch them for a while so I can teach you.
Also, if you are looking for an entry trigger for bull runs and spot purchases and anything else, your best trigger will be on the weekly time frame at 1.62 and after the break, good money will enter the market and our new primary trend will be formed and I will definitely enter myself.
We also had another entry with the resistance level of 662 billion and it was mostly Ethereum, Solana and Link that we tried very hard to break 662 and be with it and I will try just as hard to break 1.62 and enter it. We are currently at the support of 1.13 and in case of a deeper market correction, we will move to the levels of 974 and 817.
📈 Daily Timeframe
On the daily time frame, the total two is very good and this shows that Alt Coins above rank 30 did not make a very deep correction, and if you look at the charts that you see had a deep decline, they are still correcting, and the main reason for the chart being this way is Solana, XRP, BNB, and SUI.
Also, after breaking our good daily trend line and breaking the 974 billion box ceiling, we experienced a very good upward movement and moved to the 1.55 level and the important ceiling, and we actually suffered a heavy rejection, but because it was because of FOMO, we could not count on its resistance, but the pullback and future rejection formed the important resistance price of 1.55.
After forming a daily range box of 1.32 to 1.55, which we had been suffering for a while, and the recent series was very weak, and it caused us to suffer a rejection halfway through and break the 1.32 support in a sharp manner and come to the 0.5 Fibonacci support, which is very important both in terms of Fibo and also in terms of Dow. 50% correction is very important and this could be the place where the price rises
We will probably stay on this support for a while and suffer and then move up and if we lose 1.17 we will go for lower levels like 1.09 and 974 billion but the most important support that should not be lost is 797 billion but there is a long way to go
📝 Final Thoughts
Stay calm, trade wisely, and let's capture the market's best opportunities!
This analysis reflects our opinions and is not financial advice.
Share your thoughts in the comments, and don’t forget to share this analysis with your friends! ❤️

xausd key areas to watch with detailed analysisHere's an analysis of XAU/USD at 2,861 as of February 10, 2025, incorporating technical and fundamental insights from the search results:
Current Context
Gold (XAU/USD) is trading near 2,861, a critical juncture given recent market dynamics. This level aligns with forecasts and technical patterns discussed in the search results, offering insights into potential bullish or bearish scenarios.
Key Technical Levels
Immediate Support:
2,861: Coincides with the lower bound of February 2025’s forecasted range (2,861.25–2,991.30). A hold here could signal bullish resilience.
2,746–2,695: Deeper support zones if a correction occurs, based on Fibonacci retracement levels and trendline analysis .
Resistance Levels:
2,868–2,900: The next psychological and technical hurdles, with 2,868.56 (R2) noted as a swing high target .
2,991–3,000: Upper bound of February’s projected range and a key breakout target .
Long-Term Trend:
Gold remains in an ascending channel (up ~27% since 2024), supported by geopolitical uncertainty and central bank demand .
The 100 SMA is above the 200 SMA on the 4-hour chart, indicating underlying bullish momentum .
Bullish Scenario
Triggers:
Fed Policy & Inflation: Continued dovish signals from the Fed (e.g., rate cuts) and persistent inflation could drive gold higher .
Geopolitical Risks: Escalating tensions (e.g., Middle East conflicts, U.S.-China trade policies) may boost safe-haven demand .
ETF Inflows: Positive gold ETF flows, as seen in late 2024, could reignite upward momentum 3.
Technical Outlook:
A bounce from 2,861 could target 2,900–2,991, aligning with February’s forecast .
A break above 2,991 opens the path to 3,000+, with institutions like JPMorgan forecasting $3,150 by year-end .
Bearish Risks
Triggers:
USD Strength: A stronger dollar (e.g., from robust U.S. data or hawkish Fed rhetoric) may pressure gold .
Profit-Taking: Overbought signals (RSI at 57) and resistance at 2,868 could trigger short-term pullbacks .
Reduced Safe-Haven Demand: Easing geopolitical tensions or risk-on sentiment might reduce gold’s appeal .
Technical Outlook:
A breakdown below 2,861 could test 2,746–2,695 (Fibonacci and trendline support) .
Sustained selling might invalidate the uptrend, risking a drop toward 2,625 (critical 100-day SMA).
Macro Drivers to Watch
U.S. Economic Data: Non-Farm Payrolls (NFP), CPI, and Fed rate decisions will influence USD and gold .
Geopolitical Events: Developments in Ukraine, Middle East, and U.S. trade policies under Trump .
Central Bank Activity: Continued gold purchases by central banks (e.g., China, India) may stabilize prices
Short-Term Forecast
Base Case: Consolidation near 2,861–2,900 as markets digest recent gains and await catalysts.
Upside Bias: Favored if gold holds above 2,861, targeting 2,991–3,000 .
Downside Risk: A close below 2,861 could trigger profit-taking toward 2,746
Conclusion
At 2,861, XAU/USD is at a pivotal level. While the broader trend remains bullish (supported by inflation, geopolitics, and central bank demand), short-term volatility from USD fluctuations and technical resistance could dominate. Traders should monitor 2,861 as a key support and watch for breaks above 2,900 or below 2,746 to confirm directional bias.
support and resistance for short term:
Resistance:
2872
2885
2894
2900
2911
2920
these resistance points can be used as bullish targets
Support:
2855
2851
2841
2833
2830
2819
2800
2782
these support points can act as bearish targets
LIKE BOOST AND SHARE US SUPPORT US

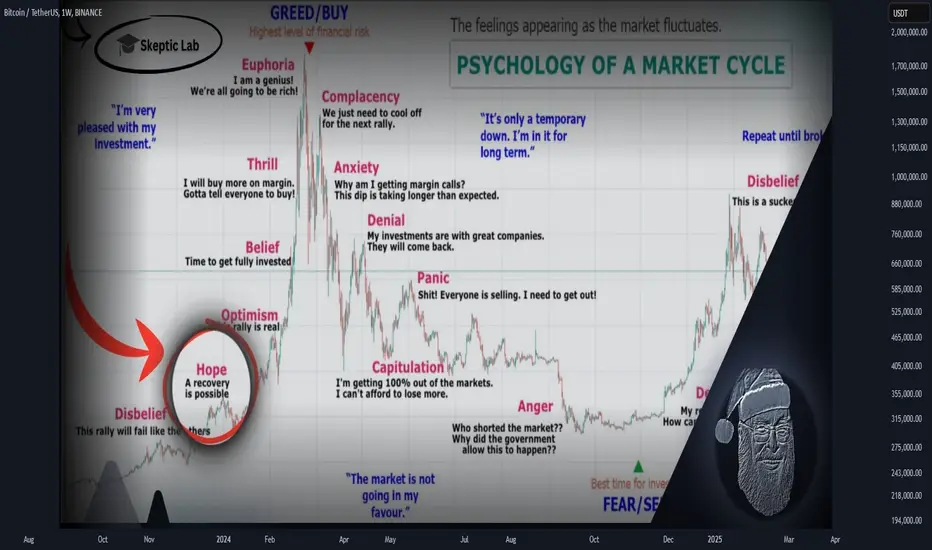
Crypto Bull Run Is Over? Or Just Another Market Trap?Have you lost faith in the bull run? Think the trend has shifted bearish? Not sure what to do with the BTC you’re holding?
I’m Skeptic , and if these questions are on your mind, stick with me until the end of this analysis. Let’s dig deep into the real state of the market!
1️⃣ Is the Bull Run Over? Let’s Analyze the Big Picture
To answer this, let’s break down key parameters:
✅ Major Trend Analysis (Weekly Timeframe)
Imagine looking at the BTC weekly chart as if it were a 15-minute chart—does it look weak? Is it bearish?
Most traders would say NO . The overall structure is still in an uptrend, and right now, we’re simply experiencing a time-based correction (sideways movement). Even if this turns into a price correction, dropping to $80K-82K, it’s still within the healthy range of a bull cycle.
🔹 Rule of Trend Structure:
As long as we don’t break a lower low on the weekly timeframe, and BTC.D doesn’t turn bearish, we are still in a macro uptrend.
2️⃣ Signs That We Are Still in a Bull Run
Ironically, most traders only believe in a bull run at the top and lose faith in it during corrections. But let’s look at the real signs:
🔹 Bitcoin Dominance (BTC.D) is Rising – This happens when the market rotates capital back into BTC before the next big leg up.
🔹 Altcoins are Crashing Hard – This is a classic market reset before the next move.
🔹 Bearish Sentiment & Fear Are High – The moment people start losing faith, is usually when the biggest moves are about to happen.
🔹 Negative News is Everywhere – Historically, corrections come with bearish news, shaking weak hands out before the real rally continues.
This pattern is nothing new. Let’s take a look at the Crypto Market Cycle Stages to understand where we are now.
3️⃣ Understanding Market Cycle Stages 🔄
Every crypto cycle moves through distinct psychological phases:
1️⃣ Disbelief (Accumulation Phase)
This happened between 52K and $72K, when people thought BTC wouldn’t rise again.
2️⃣ Hope (Early Bull Stage)
We are here right now—BTC has broken out, but many still doubt it.
3️⃣ Optimism (Strong Rally Begins)
Coming next, when BTC starts pushing new highs, and retail traders begin FOMO-ing in.
4️⃣ Euphoria (Market Peak & Bubble Zone)
This is where everyone is convinced BTC will go to $500K+ and institutions dump on retail traders.
Right now, we are in the HOPE stage, and many are expecting instant results. But real gains in the market take years, not days—just like they always have.
4️⃣ Market Patience: Lessons from the Past
📌 Remember the $72K BTC Range?
Before BTC hit $100K, it spent 6 months in a sideways range. Everyone was frustrated, saying the bull run was over. But what happened next? A massive rally.
📌 When BTC Hit $100K, Many Had Already Left
By the time BTC made its big move, many had already quit or stayed sidelined, only returning when it was too late. Don’t repeat that mistake!
Final Thoughts 💡
The market moves in cycles, and corrections are a natural part of every bull run. Instead of fighting reality, embrace it:
✔ As long as BTC holds major structure levels, we’re still in an uptrend.
✔ The best opportunities come when fear is high, not when everyone is euphoric.
✔ Patience always wins—those who stay through the tough times are the ones who make it.
💬 Do you think we’re still in a bull run, or do you believe the cycle has ended? Drop your thoughts in the comments!
I’m Skeptic , and I provide market analysis & educational content. If you want to stay ahead of the trends, follow me for more insights! 🤍
TradeCityPro | Bitcoin Daily Analysis #1👋 Welcome to TradeCityPro!
This is the first analysis in the Bitcoin series on the channel, which will be uploaded daily. In this series, we will analyze futures triggers that can provide us with positions on the same day. Therefore, most of the analyses will be conducted in lower timeframes.
✨ However, in today’s analysis, I will also cover Bitcoin in higher timeframes since this is the first analysis and needs to be comprehensive.
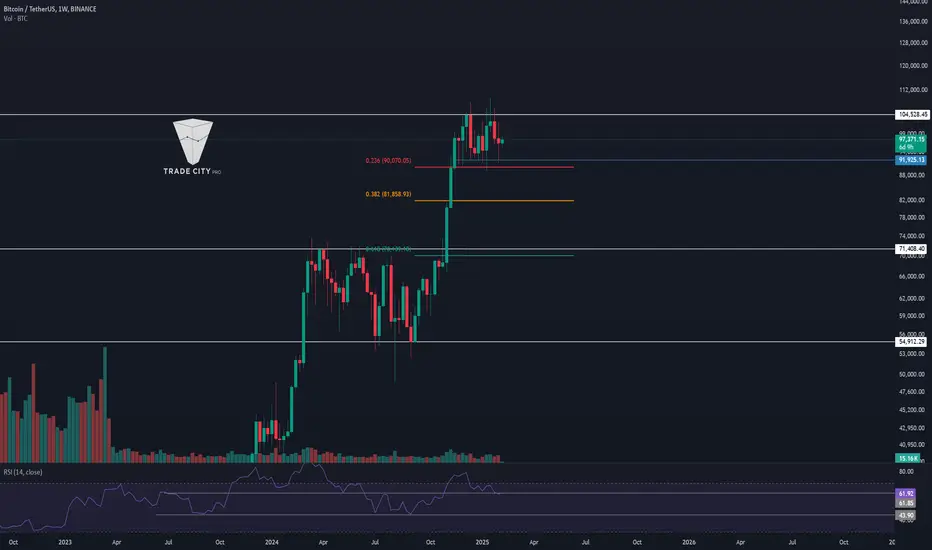
📅 Weekly Timeframe
In the weekly timeframe, we see a strong uptrend where the last leg started from the 54,900 bottom and moved up to the 104,700 resistance. The candle volume has been mostly bullish, aligning with the uptrend.
🔍 Currently, the price is resting below the 104,700 resistance, and the last weekly candle, which closed just yesterday, resembles a rolling pin, indicating indecision among buyers and sellers as the price moved both up and down but ultimately closed in a range.
💥 In RSI, there are two crucial support levels. The first is at 61.85, which RSI is currently near, and if it reacts positively to this level, a new bullish momentum could enter the market. The next support is at 43.90, a critical level for market momentum. As long as RSI stays above this level, bullish momentum remains in the market.
🔼 For the next bullish leg to start, RSI likely needs to enter the overbought zone, attracting more buyers and initiating the next wave. In terms of price action, breaking the 104,700 resistance would be the best trigger for the next move.
⚡️ On the other hand, the price has so far corrected to the 0.236 Fibonacci level near 90,000 and still has the potential for further corrections. If it continues, the next support levels are at the 0.382 and 0.618 Fibonacci zones, which overlap with 81,800 and 70,000, respectively.
📣 Since this series will have daily updates and we will analyze the weekly timeframe after each weekly candle closes, I won’t discuss lower supports or higher resistances until the time is right.
📅 Daily Timeframe
In the daily timeframe, the price is ranging between 91,925 and 106,612. As seen, the price has been rejected from the range high for the second time and has dropped to 96,312.
🧩 Bearish momentum has been decreasing since reaching the 96,312 support, and a rounding formation is gradually forming. A positive aspect is that if Bitcoin establishes a bottom in this zone and moves toward the range high again, it will create a higher low compared to the 91,925 support, increasing the chances of a breakout to the upside.
📊 The volume of the last red candles in the bearish leg has been quite low. In the two recent green candles from yesterday and today, the volume is also very low, meaning the price might soon start its movement. So, it’s best to move to lower timeframes to find a suitable futures trigger.
⌛️ 4-Hour Timeframe
In this timeframe, I won’t analyze much but will instead focus on identifying futures triggers.
🔽 For a short position, the setup is quite clear. There is a solid trigger at 95,798, which the price has tested multiple times, making it a reliable trigger. Since this short position is being opened within the range and near the range low, it should be taken quickly and secured at low risk-to-reward ratios like 2 or 3. It is not an ideal trigger for a long-term trade.
📈 For a long position, the first trigger was the breakout of 97,304, which has already happened, and the price has confirmed above this level. If you haven’t taken a position on this breakout, you can enter on a pullback if a suitable candle forms or if there’s a trigger in lower timeframes. Keep in mind that this trigger is the riskiest, so enter with minimal risk.
✔️ The next long trigger is at 98,937, which is more reliable. If the price stabilizes above this level, we can expect a bullish leg toward the range high.
⌛️ 1-Hour Timeframe
In this timeframe, as seen, the price is pulling back to the 97,304 level while engulfing the previous red candles. RSI is also stabilizing above 64.12. If the candle closes as it is, a long position will be suitable. The key resistance level is at 99,730.
📉 For a short position, the trigger remains similar to the 4-hour timeframe. However, since the price has faked this level in this timeframe, we should wait for another reaction at this area to confirm the actual trigger point.
⭐️ Now, let's analyze the dominance charts. A full dominance analysis will be provided separately. The Total2 analysis will be posted tonight, and the USDT.D and BTC.D analyses will be done tomorrow, but for now, they will be reviewed in the 1-hour timeframe.
⌛️ BTC.D Analysis
In the 1-hour timeframe, we see Bitcoin dominance increasing after reaching the 61.34 bottom, which has contributed to Bitcoin’s recovery following the fake breakdown at 95,798.
👑 If dominance stabilizes above 62%, more money will flow into Bitcoin. In this scenario, if the market moves upward, Bitcoin will rise more than most altcoins, and if the market drops, Bitcoin will decline less than others. The main resistance is at 62.66.
💫 On the other hand, if dominance falls below 61.34, less money will enter Bitcoin. In a bullish market, Bitcoin will underperform altcoins, and in a bearish market, Bitcoin will drop more significantly.
⌛️ Total2 Analysis
In the 1-hour timeframe, the 1.22 level in Total2 overlaps with 97,304 in Bitcoin. However, as seen, Total2 is still below this support and hasn’t confirmed above it yet. The reason is the increasing Bitcoin dominance, causing altcoins to move less than Bitcoin.
☀️ The main resistance in Total2 at this timeframe is 1.28, which is also the key long trigger.
🔽 For a short position, Total2 offers a better trigger than Bitcoin. If Total2 breaks below 1.16 while Bitcoin dominance increases, shorting altcoins will be a better option than Bitcoin.
⌛️ USDT.D Analysis
As seen, the candle has closed below the 4.51 support in this index, and it has more overlap with Bitcoin than Total2.
✔️ The trigger for an increase in USDT dominance is 4.64, which would lead to a market decline. The alignment of this trigger with the short triggers in Total2 and Bitcoin could provide strong confirmation for those trades.
🔑 For a long position, breaking below the 4.40 support in this index would be a good signal. The main support is currently at 4.22, and if this level is broken, the market could begin its next bullish leg.
📝 Final Thoughts
This analysis reflects our opinions and is not financial advice.
Share your thoughts in the comments, and don’t forget to share this analysis with your friends! ❤️
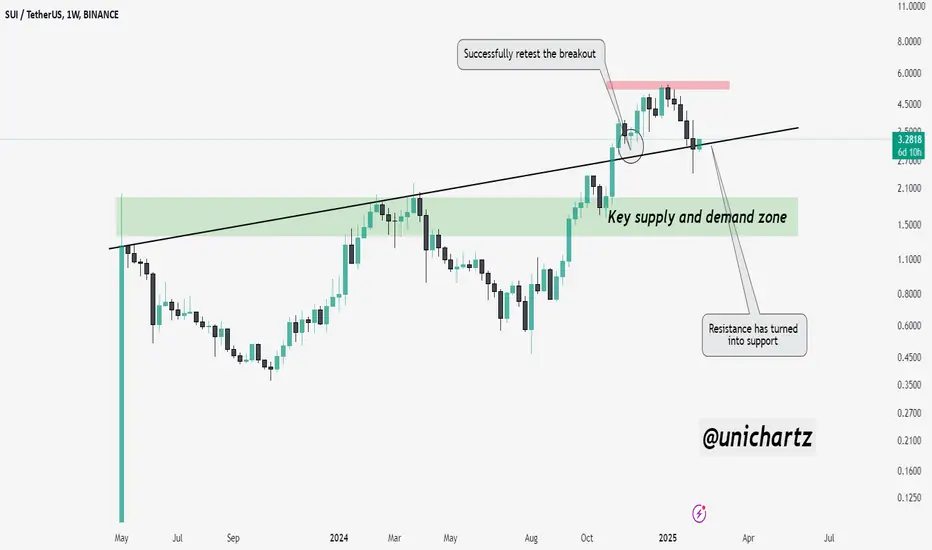
Trendline Flip: Bullish Setup for SUI/USDTSUI/USDT is finding strong support at the trendline, which has now flipped from resistance to support. This trendline, previously acting as a key resistance, has been successfully retested after the breakout, confirming its role as a new support level.
Additionally, the price is holding above the key supply and demand zone, further strengthening the bullish outlook. If this support holds, we could see a potential upward move as bullish momentum builds from this critical level.
DYOR, NFA
SPX WEEKLY PRICE ACTION 10TH FEB 2025This is the price action of SPX at its very best & exclusively for viewers on trading view.
I have discussed in depth price action of SPX and if you have any doubts feel free to leave a message or your comments below.

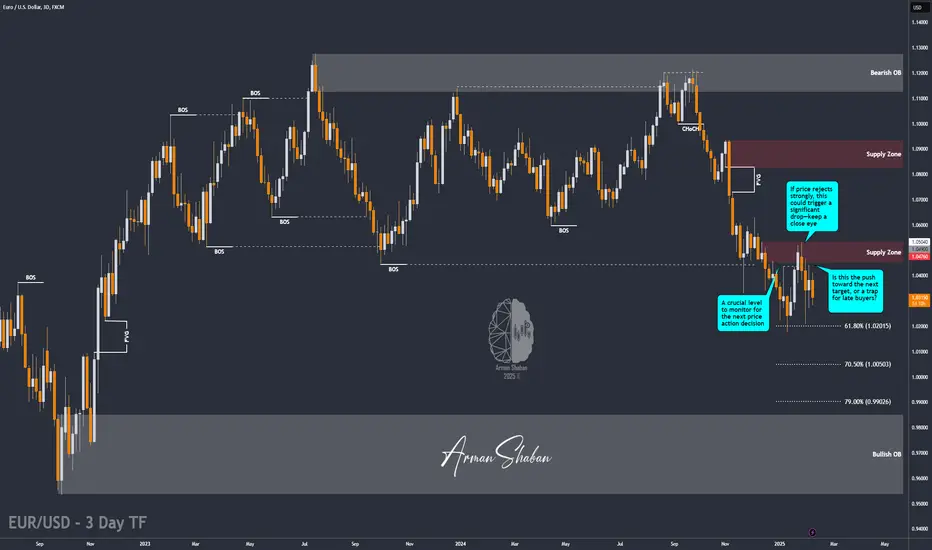
EUR/USD : First SELL, then BUY! (READ THE CAPTION)By analyzing the 3-day EUR/USD chart, we can see that, as expected, the price has resumed its correction and is currently trading around 1.03. I still anticipate further downside movement in this range.
The key demand zones are 1.02, 1.005, and 0.99. So, the strategy remains: first, look for SELL opportunities, and then wait for a solid BUY trigger at these levels! 🚀
Please support me with your likes and comments to motivate me to share more analysis with you and share your opinion about the possible trend of this chart with me !
Best Regards , Arman Shaban
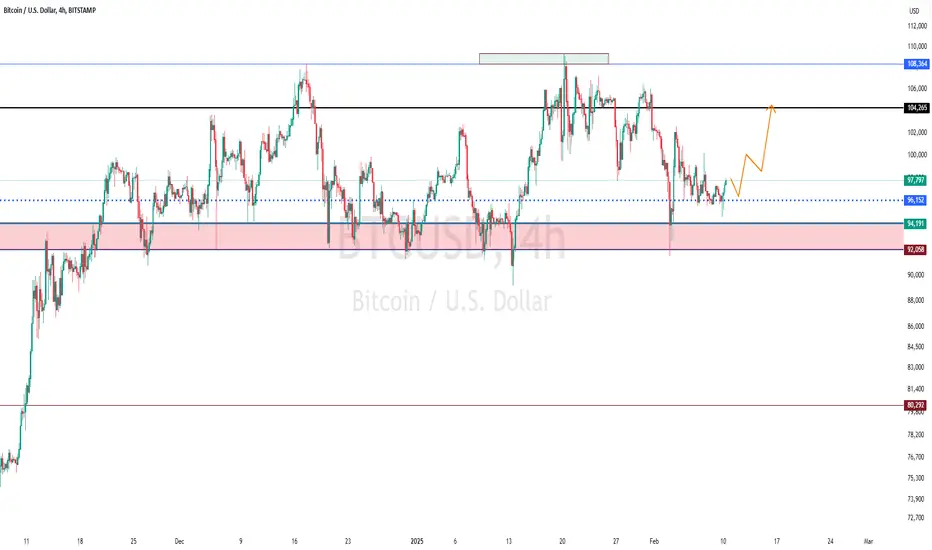
BTCUSDT - only single stuppor , bottom out here??#BTCUSDT - we have only single supporting area in day chart and week chart as well that is 96150 and market very smoothly holds so far.
so keep close that area 96150 and until market trade above that don't short.
good luck
trade wisely
$BP’S COMEBACK? ELLIOTT’S STAKE & UNDERVALUATION BUZZBP’S COMEBACK? ELLIOTT’S STAKE & UNDERVALUATION BUZZ
1/7
BP ( NYSE:BP ) just got a jolt of activist energy ⚡️ as Elliott Management took a significant stake. Shares surged 7% to 464.75 pence—the highest since August. Are we witnessing the start of a big turnaround? Let’s break down the numbers.
2/7 – REVENUE RUNDOWN
• 12-month revenue (ending Sept 2024): $199.1B (↓13.72% YoY)
• Big contrast to 2022’s 51.58% revenue jump
• Post-pandemic swings? The energy rollercoaster keeps rolling. 🎢
3/7 – EARNINGS HIGHLIGHTS
• Q4 2023 net income: $371M vs. $10.8B the previous year 🤯
• Lower refining margins + weaker oil & gas production = big dent
• Still holding a “GOOD” Financial Health score—some resilience under the hood.
4/7 – ELLIOTT’S INVOLVEMENT
• BP’s 2023 performance: -16%—underperforming Shell (-4%) & ExxonMobil (+8%)
• Elliott sees untapped value? Activists typically target companies trading below intrinsic worth
• Market loves it: 7% daily pop signals new optimism. 🚀
5/7 – VALUATION SNAPSHOT
• TTM P/E ratio at 7.89—notably below Shell & Exxon’s multiples
• Some analysts call BP “undervalued” and point to further upside potential
• If Elliott drives restructuring or divestitures, could we see a sustained rally?
6/7 Is BP primed for a major comeback with Elliott on board?
1️⃣ Yes—Activists will unlock hidden value!
2️⃣ No—BP’s challenges run too deep.
3️⃣ Maybe—Need more clarity on strategy.
Vote below! 🗳️👇
7/7 – RISK FACTORS
• Commodity Volatility: Oil & gas prices can swing hard
• Regulatory & ESG Pressure: Green-energy pivot demands big $$
• Debt Levels: ~$20.9B net debt could limit agility
• Competition: Shell, Chevron, & Exxon aren’t standing still. ⛽️
