Beware of a possible "bulls trap" ahead!Suddenly we're now above the major resistance of 0.7385. At least to me this was quite unexpected, since I somehow fixed my mind on a possible move to the downside. But I should have been more careful and should have noticed these two things:
1. Momentum indicators were clearly pointing higher.
2. Gold price made a new high, which is important for Australian economy and for its currency as a consequence.
Still I do believe this bullish move is about to end soon and bring reversal. Here's why:
1. The RBA sees its "ideal rate" at around 0.65.
2. There is a room to the downside: we have a trend line starting back at 2001 to support the price once it gets there.
3. From technical perspective, to call this move an uptrend, we still need to see a move down, which will not be able to go pass the previous lows at around 0.68 and then a move back through current highs. In other words, we need to be able to properly draw an uptrend line. And we are not able to do so quite yet.
4. I'm bullish on U.S. Dollar in the long term. Whatever Fed tells us on March 17 – it has to be positive for American currency.
This leaves us with a possibility for a larger reversal of all major currencies versus U.S. Dollar, as well as Gold and Oil, in the next couple of weeks.
So buy for the short-term, if you want to, but keep a possibility of a reversal in mind.
--
Everything I write about - I buy and sell for myself and my Investors.
Please hit LIKE button if you find this analysis useful, so as I know you do.
Please FOLLOW ME here on TradingView to see what I see, when I see it.
You can also JOIN ME on LinkedIn , Facebook and VKontakte .
Vladimir Vereshchak | Making People Wealthier!
TRAP

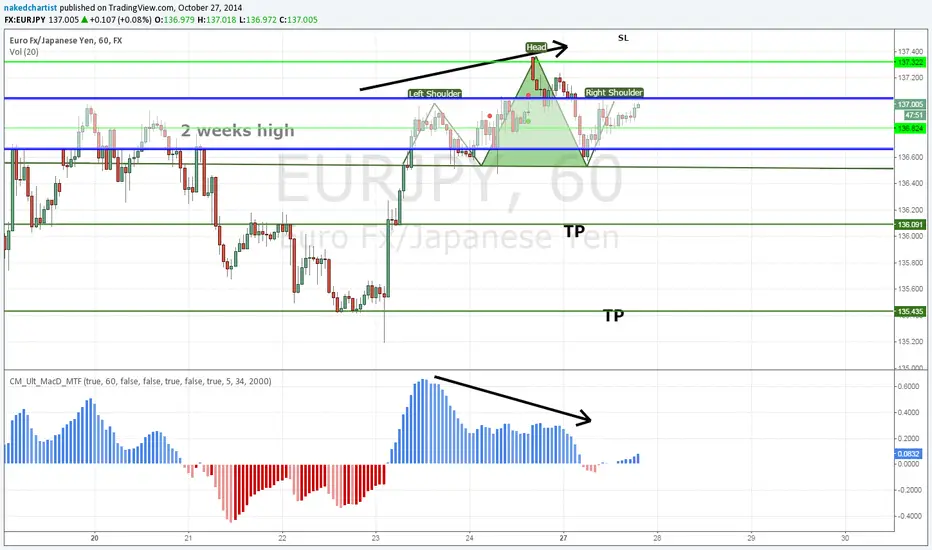
EURJPY potential bull trap over 2 weeks highSpotted a h1 hns chart pattern and with macd divergence. I am interested to see if the pattern will be completed or not , if neckline closes or not. If ti closes , then a flush of 2 weeks high will be done.
What may be against this trade will be the 2 hammers on w1 , but should price do a strong bearish close, It will herald a new wave of bearish move upon smashing the weekly descending triangle neckline.
my TPs as shown, the levels on d1 line chart pivot.
For a better ( but riskier) entry , I may choose to see a test on h1 near the suspected right shoulder and get and entry there, SL for about 40 pips for 120 pips.
If not, then closure below neckline for more confirmation.
I will relate this trade setup with my bearish bias on Nikkei
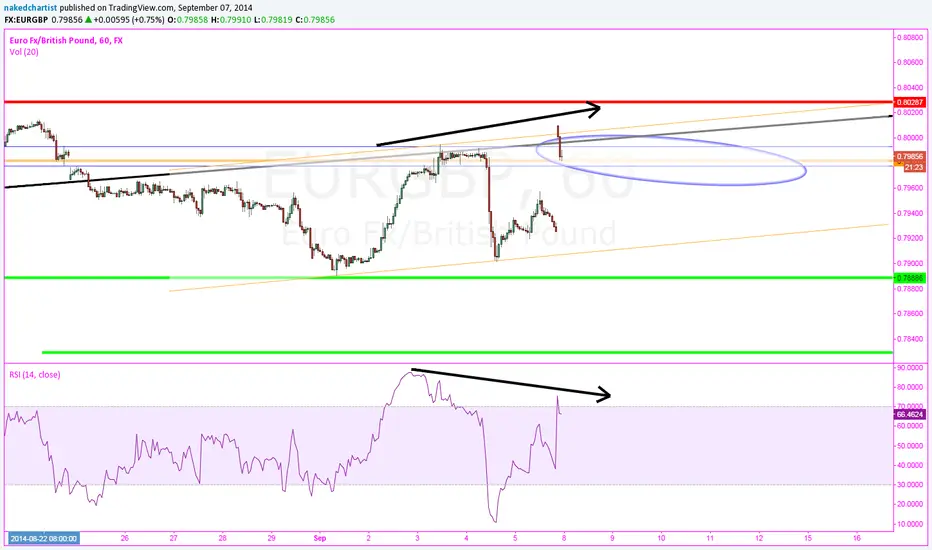
EURGBP shorton monday GBP gapped down, and hence for EURGBP suddenly it spiked up. This happened to almost complete a 4 point ED channel. I am looking to short this on close below a 2 weeks flat high, sort of a bull trap. Still believe EUR is weak and shorting EG is with the trend imo.
RSI shows divergence as well.
If price cab go beyond 7889 first TP, then will look to hold and let it run for next position.