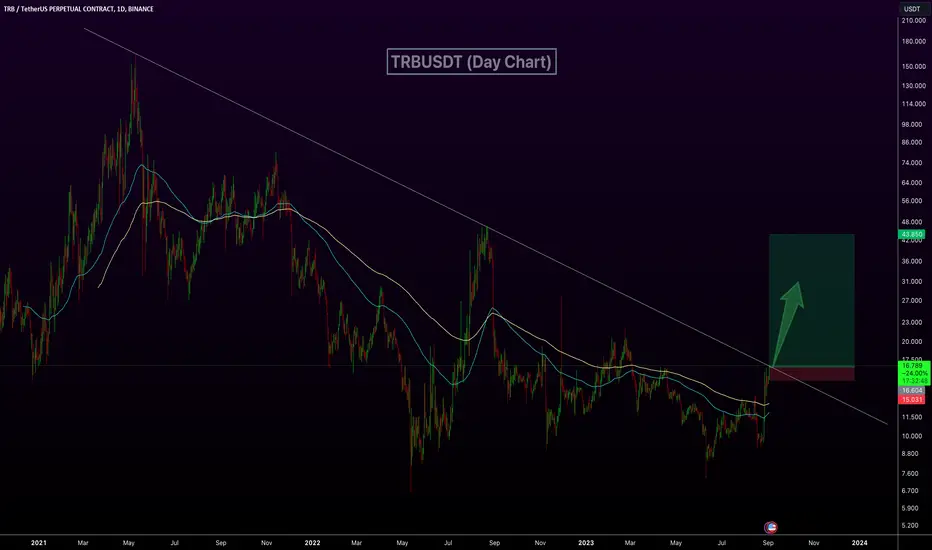
TRB – Break Support and Down You GoTRB broke below the support trendline of the Rising Broadening Wedge.
The 21D EMA and the weekly S/R level at 46.7 is still holding Tellor’s price. As long as these support levels hold it could still try for higher.
If TRB drops below these supports, it could retrace most or all of its gains.
Wait for a retest of the 21D EMA as resistance before taking the trade (Assuming you are interested).
Look for a break below the RSI support as confluence.
A move down to the 200D EMA, at least, is likely, IMO.
Trade Idea:
• Entry: 45.5 (Retest of the 21D EMA as resistance)
• SL: 51 (ATR)
• Target: 13.5
• TP: TP1: 50D EMA, TP2: 200D EMA.
• R: R: For TP1: 1:1.55. For TP2: 1:4.4. For TP3: 1:5.93
TRBUSDTPERP

📊#TRB is close to TP zone, there is still a chance📈🧠Yesterday, I made a purchase myself after breaking through the previous high. As I said yesterday, because there are still unrealized targets above, although we did not come to the support area according to the expected path, because we broke through the previous high, so I have reason to think that it is very reasonable to continue to move higher to the TP zone.
➡️Therefore, the trading logic is determined and the goal is determined, so all that needs to be done is to formulate a trading strategy and execute it.
⚠️Having an opportunity does not mean it will definitely come true, so risk management is an essential part of the trading system.
📝Any transaction is based on a plan to make money, a plan that can achieve stable compound interest in the long term, rather than going long because the price is low or going short because the price is high.📝
💌If you can't grasp the rhythm of futures trading, please follow Wolf king footsteps and print money together.💰🍻

📊There is also an unrealized bull TP zone above #TRB⚠️short⚠️🧠As expected, the TRB reached the expected target zone and made a correction of 18.45%. But we did not continue to fall, because there is still an unachieved target area above us, we do not know whether the target will be achieved, but it is possible, the nature of trading is to exchange risk for income, how to make a trade-off, everyone has different views.
➡️I'm more bullish, so are you bullish or bearish?
👇Let us know in the comments section👇

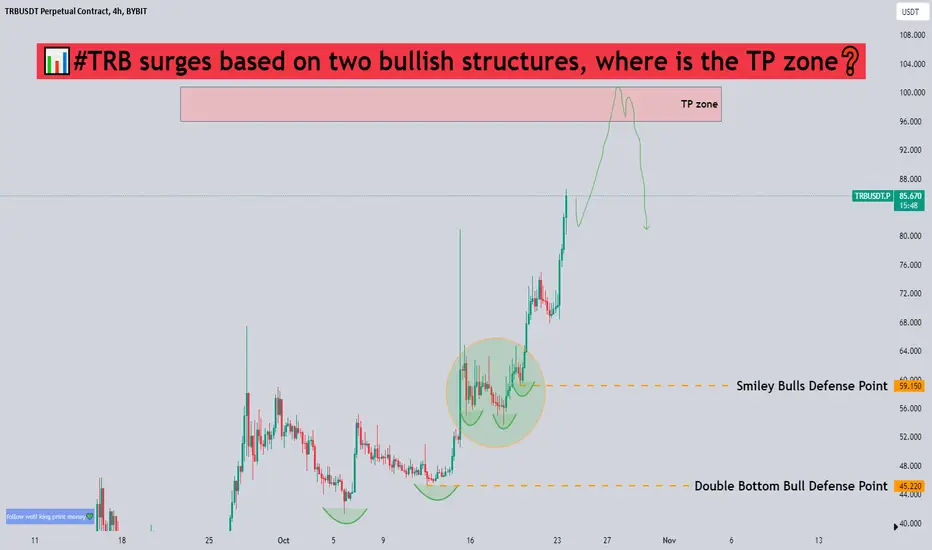
📊#TRB surges based on two bullish structures, where is the TP❓➡️We are in a strong long position in terms of the large structure. Currently, we have a double-bottom bullish structure and a smiley face bullish structure as supporting motivations. While we are strongly bullish, we also need to be wary of a sharp retracement after achieving our goals.⚠️
➡️When we reach the TP zone, the action we should take is to reduce our holdings or take profits.⚙️
🔔If you think my analysis is useful to you, please don't forget to "like" me.✔️💯💪🍻
💕 Follow me so you don't miss out on any signals and analyze 💯
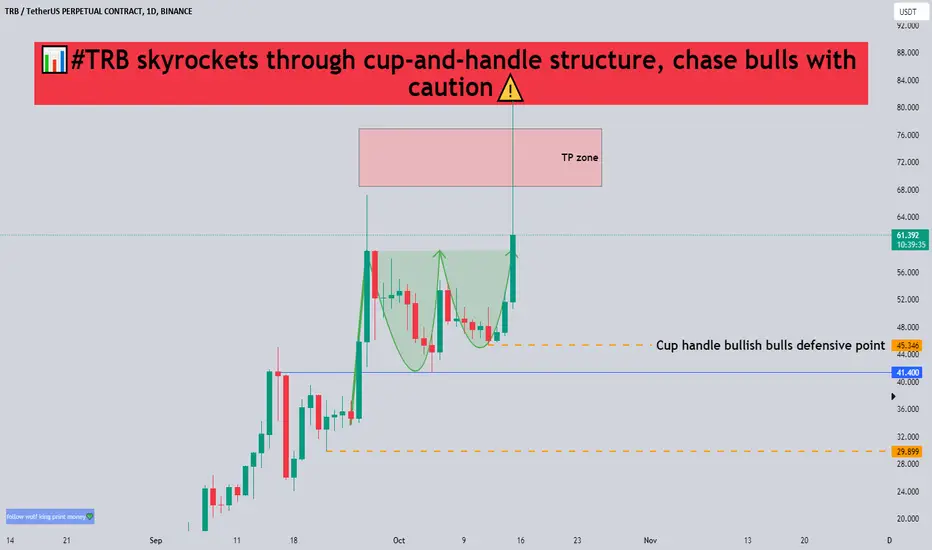
📊#TRB skyrockets through cup-and-handle structure, chase bulls⚠✔️The target area of the bullish structure of the TRB cup has been achieved, whether it will continue to continue the bulls we do not know, but there is certainly a risk of falling back, and it is not recommended that we chase more now.❌
➡️If we want to go long, we need to wait for a new bull structure to form a bullish momentum before it is more secure.✔️
🤜If you like my analysis, please like 💖and share it💬
💕 Follow me so you don't miss out on any signals and analyze 💯
TRBUSDT again. It's time to go Down #TRBUSDT again. It's time to go Down ..Check my previous analysis about #TRB. That time we are Long but this time we want to stop hunt early buyers..
!! Jai Shree Ram !!
Namaste 🙌

📊#TRB double top short target has been achieved⚠️short➡️We seem to be in a long correction after a big rally, but we are still in bull strength overall.📈
➡️The bullish defensive point below is crucial, and if it is broken, then it will start a larger correction. I hope we can hold it successfully.💪
➡️If we choose to continue to rise, then a break through the ultra-short-term bear defense will open the upward path.📈
Let's see👀
🤜If you like my analysis, please like 💖and share it💬

Tellor TRB – Last impulse Before a CorrectionTRB Close to a Peak:
TRB had an amazing run but, IMO, it is almost at its peak. These are the reasons why:
1. TRB’s impulsive wave up, beginning on August 25th, shaped into a Rising Broadening Wedge. According to Murphy (1999), the Broadening wedge is indicative of a market top. The wide price and volume expansion represents emotional traders.
2. There is a pronounced bearish divergence on the daily chart. The divergence signifies that the bulls are close to exhaustion.
3. The RSI value on the weekly chart is more than 87. IMO, this level is unsustainable, and TRB will have to correct for the indicator to cool off.
Current Situation:
Currently TRB cleared a weekly supply zone and, it is trying to break through the weekly resistance level of 47.8.
Next Resistance Level:
The next levels TRB has to face are:
1. weekly supply zone between 59 to 73.
2. weekly resistance at 79.2
Wave count:
I do not consider myself an EW expert. However, this count is, IMO, correct. If anyone reading this has any suggestions or corrections, please share.
According to my count, in this impulsive wave, we completed four waves and now we are at the beginning of wave five. The common target for wave five is the 0.618 extension of waves 1-3 which is at 69.85. This fits nicely with the supply zone and the weekly resistance.
From a trading perspective the count doesn’t change much but it has nice confluence.
Short Trade Idea:
I do not have a specific entry, SL, and target, yet.
I will be watching for a violation of the wedge’s support line or at the resistance lines to enter a short trade.
I am curious to know if anyone else shares my opinion. Please share in the comments
Best Wishes

TRB pump to target in 2days as planSuggest you closing 75% positions here
Below is my TRB analysis 4 days ago(price 33)

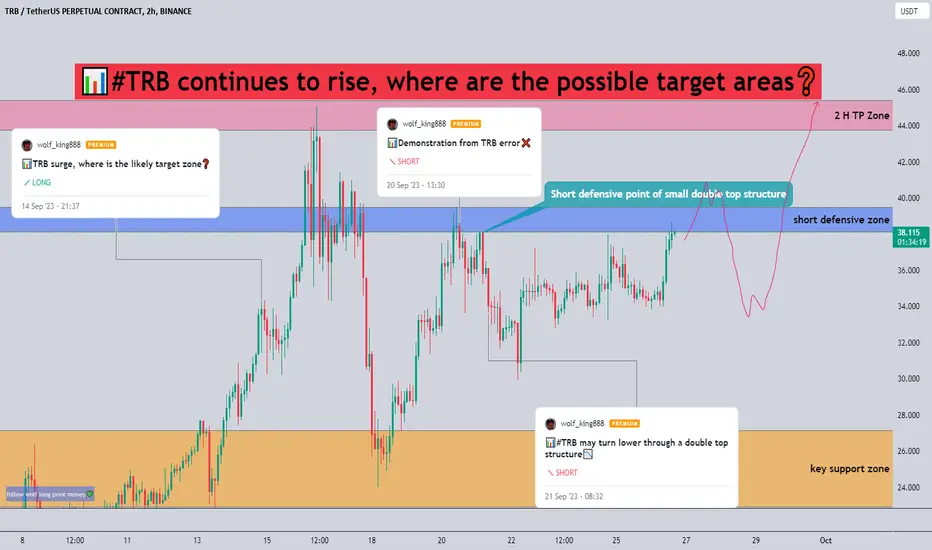
📊#TRB continues to rise, where are the possible target areas❓➡️The TRB experienced a brief correction after a sharp rise, and began to rebound after gaining support at a key support range. As I mentioned in the previous post, our near-term short target has been basically achieved, and we have also informed everyone to leave the market with all profits. 💰🍻
🧠 Now we have reached the short defense zone, and we have broken the short defense point of the small double top structure, if we can break the whole short defense zone, then we can go to the challenge high 💪🏻
Let's see👀
🤜If you like my analysis, please like 💖and share it💬
💕 Follow me so you don't miss out on any signals and analyze 💯
TRB can reach 60 if break out1h time frame
-
TRB has been consolidating for 7 days, this consolidation structure is going to convergence as a triangle structure, which means TRB will appear volatility soon. If breaking out this triangle on upside, this pump momentum can be maintained.
TP: 59.5~65 / 88
SL: 22.3

TRBUSDTBINANCE:TRBUSDT SELL IDEA
⛔"Daily crypto market analyses I provide are personal opinions & not financial advice. Trading carries risks, so do your own research & seek advisor's help.#DYOR"
Don't forget to like and comment

📊#TRB may turn lower through a double top structure📉🍻We are glad that the bears have successfully defended, we have now formed a big double top and a small double top respectively, and may end the short-term rally with wave 5. Now we need to wait for the key support line to be broken to confirm the start of the turn.📉
🧠As long as our short defense point 1 is not broken, then there is still a possibility of turning down, we will generally put SL here. Of course, if you want to make R/R more beautiful, you can put SL in the position of short defense point 2. But it's also easy to sweep away, so set it to your liking.⚙️
🤝I am also very happy to receive your comments and support. Thank you.❤️
➡️The reason why I publish the details of this trading strategy is to review myself, so that I will not make such mistakes in the future and improve my service level.✔️
➡️Second, to remind you not to make this mistake, this was a wrong demonstration, although we were able to make a profit again.😂
👉As the fan commented in the comments, the longer we waited, the more money we had to pay, but fortunately we were light and had a 128% return on target 1, which would have been a staggering 460% or so if we had achieved all our targets🤩💰
Well, let's see if we can accomplish our goal👀
🤜If you like my analysis, please like 💖and share it💬
➡️If you can't grasp the rhythm of futures trading, please follow my footsteps and print money together.
💕 Follow me so you don't miss out on any signals and analyze 💯

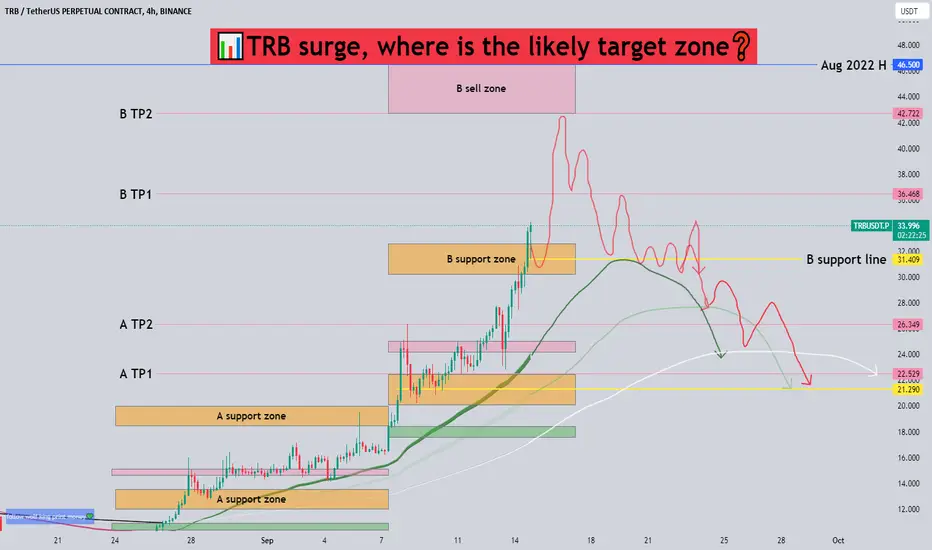
📊TRB surge, where is the likely target zone❓🧐TRB started a 19-day violent rise after returning to the 2022 low again. Many people will regret that they did not seize the opportunity of this rise. But if we enter the market now, there will be countless fears to stop us.
🧠To this end, I have analyzed and sorted out the target areas that may be reached by the rise, and simulated the possible trajectory, hoping to solve everyone's confusion.🍻
‼️Note that if we reach B TP1, then it is possible to go to B TP2. If we stop at TP1, then this simulation trajectory will be invalid. If we break through B SELL ZONE, then this simulation trajectory will also be invalid.❌
let us see👀
👏Welcome everyone’s messages and comments💬
🤜If you like my analysis, please like 💖and share it💬
Short Entry upon Wedge Breakdown for TRBGreetings, Snipers!
TRB has risen over 200% in less than a month during a bear market
The pump and dump forms a rising wedge
In the shorter timeframe, there is a clear diagonal support
We can short once there is a breakdown of this support.
TP1 at $24.4
TP2 at $16.6
Please ensure risk management and stop-loss (trailing $31, $34, $36 for futures) as this coin has a pump-and-dump nature. There is a price discrepancy with TRB futures, so beware of the funding rate.
Happy Sniping!

TRBUSDT Buy Setup!TRBUSDT Technical analysis update
Buy zone : Below $16.80
Stop loss : $15.05
Take Profit 1: $18.30
Take Profit 2 : $22.00
Take Profit 3 : $29.50
Take Profit 4 : $43.50
Thanks
Hexa
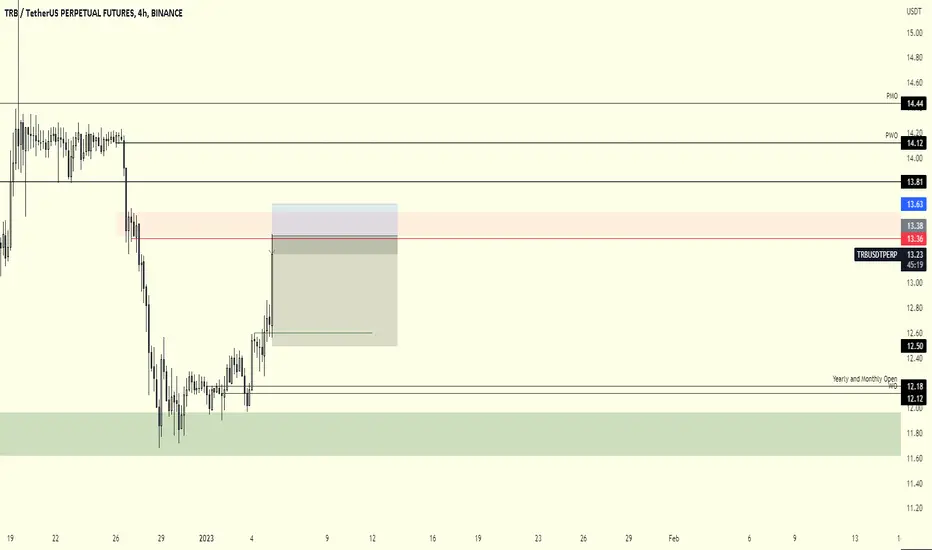
$TRB #TRB | LTF SHORTThe lower bound of red box most probably will work as resistance so i looking at bearish breakers around $13.36 . If the price loses red box, the price may dump more than we expect.
Have a nice week!
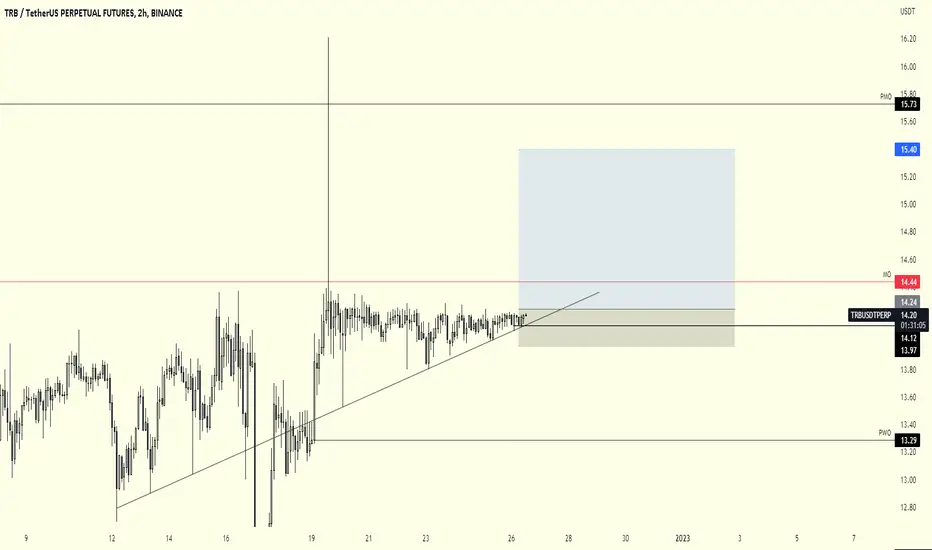
$TRB #TRB | LTF LONGIf the price passes red line, I expect price visits to upper levels like 15.2 & 15.4.
If the price closes below 14.44 , I expect price visits to lower levels like 13.8.
For short-term trading: Focus on 14.17 & 14.21.
Have a nice week!
TRBUSDT - 15M (15.09.2022)TRBUSDT
TF: 15M
Side: Long
Pattern: Falling Wedge
Entry: Between $16.6888 & $18.9769
SL: $16.6888
TP 1: $17.4931
TP 2: $17.7767
TP 3: $18.0059
TP 4: $18.2350
TRB is coiling on 15M TF and getting ready to go on a wild ride.

TRBUSDT quick short scalpingI'll publish a lot of scalping signals with R/R from 1 to 2 and I hope you could enjoy using them. be cautious and don't enter more than 2 % in any trade or position.
happy scalping!


TRBUSDT Future position shortTRBUSDT - open short position in Binance exchange with 1:1.5 risk to reward ratio entry at 41.7 and stop loss at 42.7 and take profit at 40.4.
I don't anyone's financial condition, I'm a day trader open for 2-3 hours.

TRBUSDTPERP Possible Downward MovementTRB completed a dead cat bounce.
Targets and stop loss are on the chart
Risk is high so do proper risk management only you are responsible for your loss...
