This is the end of the bearish run. Confirmed by XABCD, RSI, etcI want to first direct your attention to last year, as most traders have also seen the resemblance between the start of the bullish market and this year. This will also play (due to the blatant resemblance) into the fear of bears that have leverage futures to really drive this metal down.
Technicals :
Second, this is the lowest levels of RSI continuity also recorded on this instrument, displaying bold downward pressure and bulls yielding their positions.
What is rock bottom? Rock bottom started forming on Friday, but I suspect it may not be completely over as of yet. Due to the propensity of market participants to favor current channels and direction as opposed to the proverbial "catching a falling knife".
Bullish XABCD pattern found but not perfect with the harmonic numbers.
Catalyst: The single major catalyst this week will be the FOMC meetings.
More on the Catalyst and trade methodology:
The Fed had recently warned markets that there is a rate coming, the market expects it, and if you look at what the market believes, the likelihood seems to be around 75+%. That type of certainty is what prompted to treasuries on the long end of the curve(i.e. 10Y) selling off so that yields go higher. For those of you who are not as familiar with fixed income - I invite you to learn more. Another thing to note is that there are 3 reasons why this was bad for Gold
1) Higher rates mean that holding Gold is more expensive since the discount rate will be higher. Hence, think of your basic PV = FV/(1+i)^t. So the tradeoff in holding gold is the yield you would otherwise receive if you put your money in bonds.
2) The dollar is also higher with the promise of a rate hike & more importantly the idea that Trump will be good for the US economy.
3) Not surprisingly given the points 1) 2). Valuations also went up on stocks - specifically US stocks. And this is widely documented if you look at capital flows to equities and treasuries vs. Gold - a negative correlation with the latter.
Trade:
So here is what I am doing.
1) expecting that gold is going higher by Feb. and this is around the bottom. Next support will be 1150 and 44.
2) The 75%+ certainty that it will happen is data that looks back to the last 2 weeks. But the buying has continued so we can assume that the certainty of the hike is actually higher.
3) I will not go into too much depth on the math but the market is expecting 25bps this week. And 3 other hikes next year.
So if the fed is even hinting that they will be dovish or if they seem complacent you will see a flight out of the trades that were so profitable in the past few weeks and gold will rise.
If on the other hand they confirm market expectations - you are fine because it is largely priced in.
Hypothesis: In the days before the meeting, some funds will also be careful about this "almost certain" hike and they will take up positions in Gold and other hedge assets and instruments because they don't want to get caught with their pants down, which will give bulls a relief rally.
PS. Also check out: Shiller index PE on google.
Only trade risk capital whether you are long or short. And remember, bull or bear, piranhas will eat you ;)
Good luck and have fun!
The Human Piranha.
Treasury

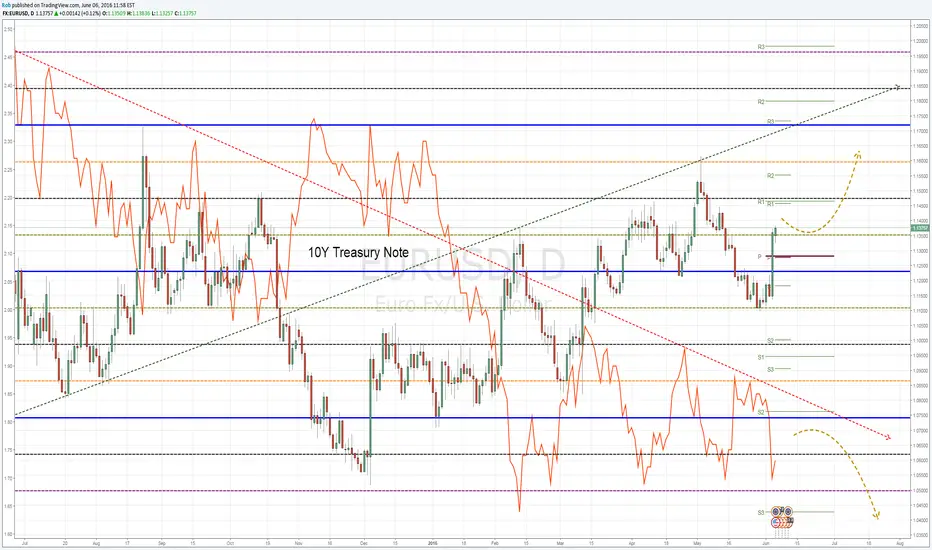
USA 10 Year Treasury Note Yield TNXSerious Traders. All hell break lose at 3% - WHY am I showing you this??? Because it will be the sale of a life time. Money out of stocks and into bonds. Donald Trump HUGE!!!!!!!!! So what's going to happen. The bubble will burst obviously. Keep your eyes open!!!

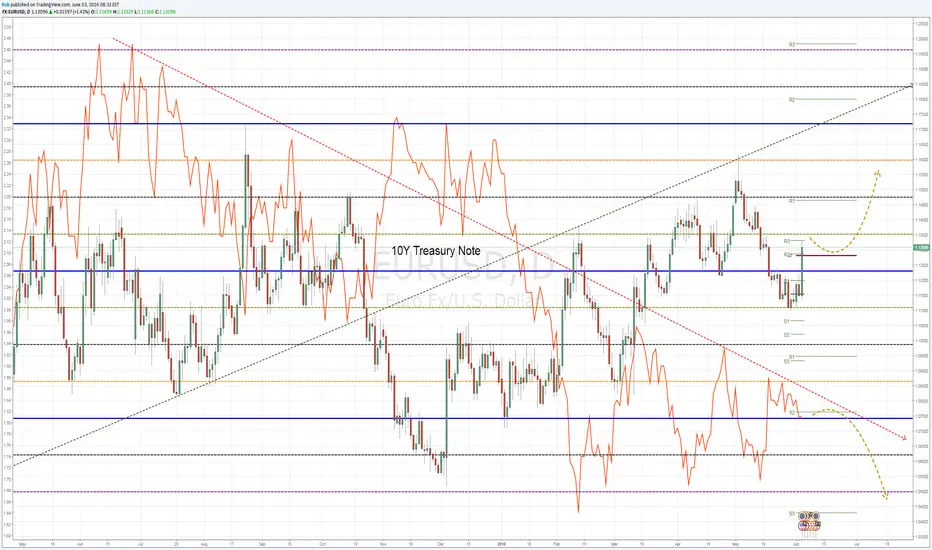
treasury buying slowstreasuries coiling up for another move. momentum on 10y crashing even with feb no-hike odds at 98%. hawkish minutes meeting next month could very well send yields ripping. good watchlist candidate.

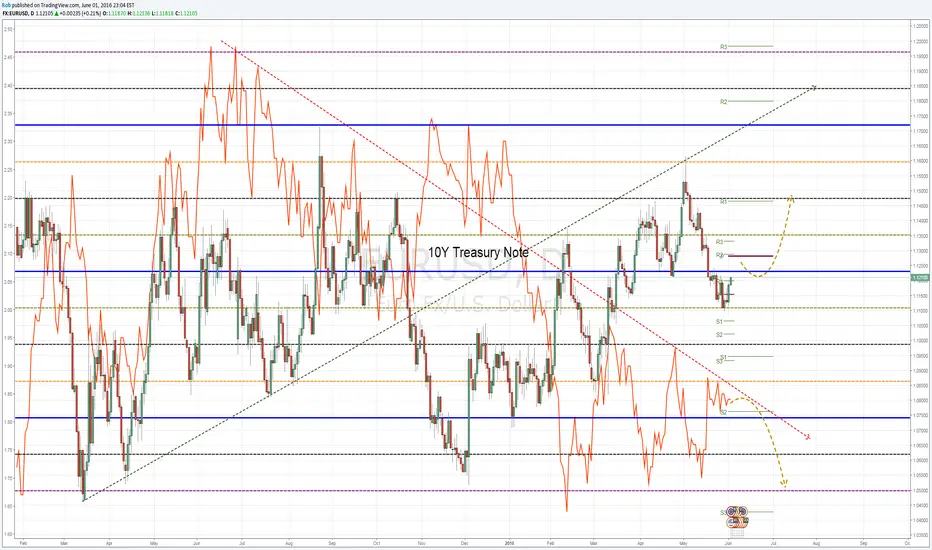
Grab some treasury on a full bus of bears! Despite the bond bubble right now, I believe there's some room for another rally in bonds.
The election of trump have seen stocks driven to record highs, and bonds/treasury/gold crushed. The longest stretch of inflows into US equities since 2014 when the dollar rallied 20%.
Net short in 10 year bonds are currently at record lows: (-500,000)
i.imgur.com (courtesy of zerohedge)
A large covering of shorts could drive bonds much higher in the coming days into Q4 earnings season. I believe a buy at this level is a pretty reasonable risk reward on the backs of the majority in the market... (4% stops, 20% tgt)

Inflation really here?TNX has been rising very rapidly. Now it's above 200-daily moving average. RSI is signaling overbought, but one must remember that it can stay overbought for some time.
Maybe investors are realizing something?
twitter.com

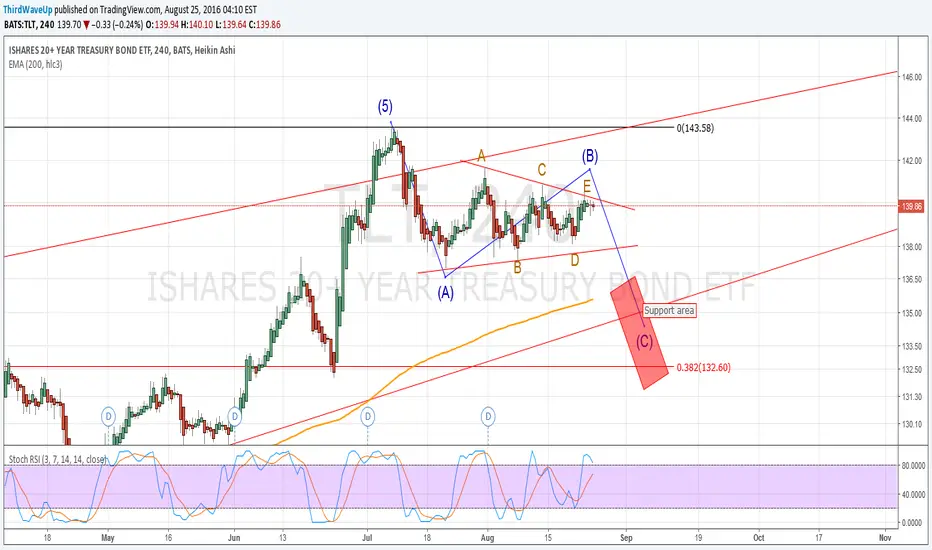
Possible support zone for TLTIf the triangle plays out and TLT swings lower, the red area is where I will be looking the first signs of support. We have 200 mA, a support line and a fib level in this area. A break above 141.72 would invalidate the triangle count.
Short Term Short TLTStill think rates will head lower due for a myriad of reasons, but in the short term, it is plausible that rates will go higher for technical reasons.
Longer-Term Reasons for lower rates (i.e. lower for longer)-
1) Monetary Policy remains accommodative
2) Growth/Inflation expectations remain subdued
3) Foreign buying interest from places with negative yields on rates (see japan, europe)
Near term reasons for the long bond to go up in yield-
1) Hawkish Fed Talk
2) Technicals as seen in the diagram (e.g. long term toppyness, decelerating RSI, declerating CCI, potential MACD bearish cross-over)


TBT / Treasury - Tight area and possible pop outTBT might pop out of this tight area.
See the full newsletter here: forum.marketstockoptions.com

TBT / Treasury - Breakout + Near Support LevelI see TBT almost hitting support level.
See the full newsletter here: forum.marketstockoptions.com

Is the Treasury yield going to lowerBond price seems to be on the way higher after a tight four-month consolidation.

Treasuries/Gold Ratio 4/28/2016These lines help us see how quickly people are switching from Treasuries to Gold.


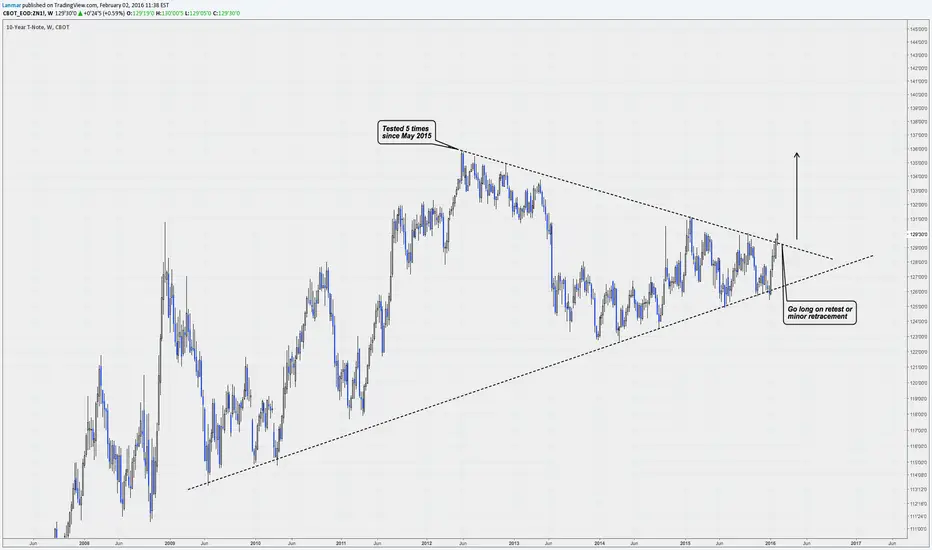
Rut Ro, Notes in troubleThe note's caught people of guard when the bullish pattern failed. Inflation? That dirty word will bring the notes and bonds to their knees and it's happening. We will short all bounces.

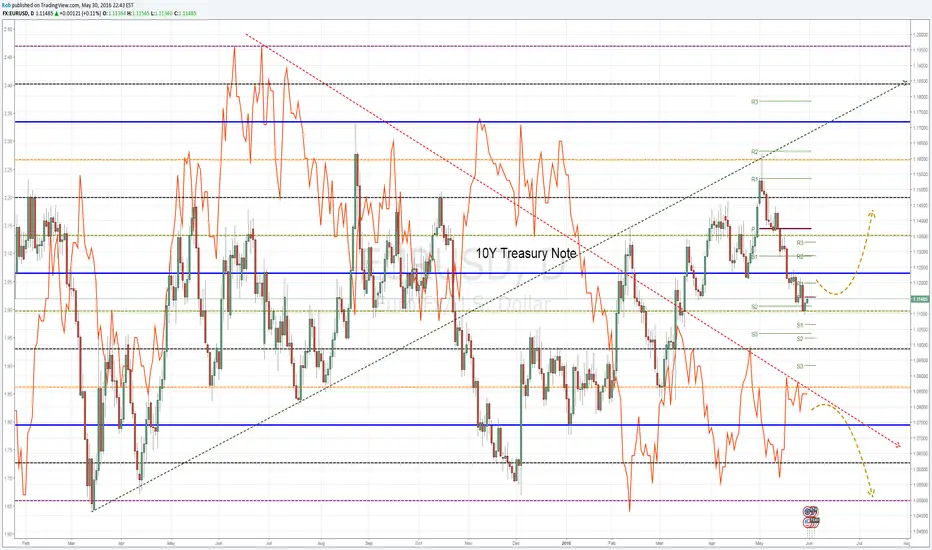
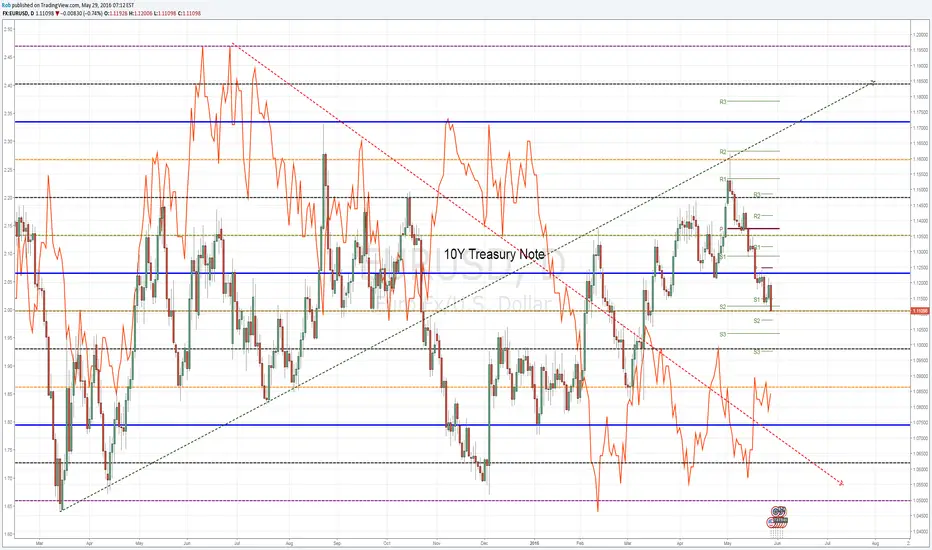
MACRO VIEW: TNX IS ON VERGE OF BREAKDOWN WITH OILThe 10-Year Treasury Note Yield is on the verge of breakdown due to the recent downtrend in oil and consequent lowered inflation expectations.
Despite the anticipated FED rate hike, the Yield can actually go in opposite direction (the famous puzzle outlined by Greenspan, the former FED chairman)
The breakdown in the Yield will be confirmed on quarterly basis, if it trades below 2.17%, which is the lower 1st standard deviation from quarterly (66-day) mean.

DATA VIEW (NOT A FORECAST): US REAL DEBT DOUBLED SINCE 2009US debt to foreign investors has doubled in volume since the start of 2009 (which was the height of the financial crisis). This indicates that despite the fact that the crisis occurred and was initiated in the US, the demand for their debt not only did not vanish - it actually spiked. In mu humble opinion, it is a very strong indicator of the actual strength of US economy.
///
Please note, that the level of debt that US actually owns to the rest of the world is much lower than 100% of GDP. Actually, as long as the debt COST is affordable (and it is affordable now) - debt is not much of a problem.
///
For more detailed info (very interesting stuff), please see: www.treasury.gov
