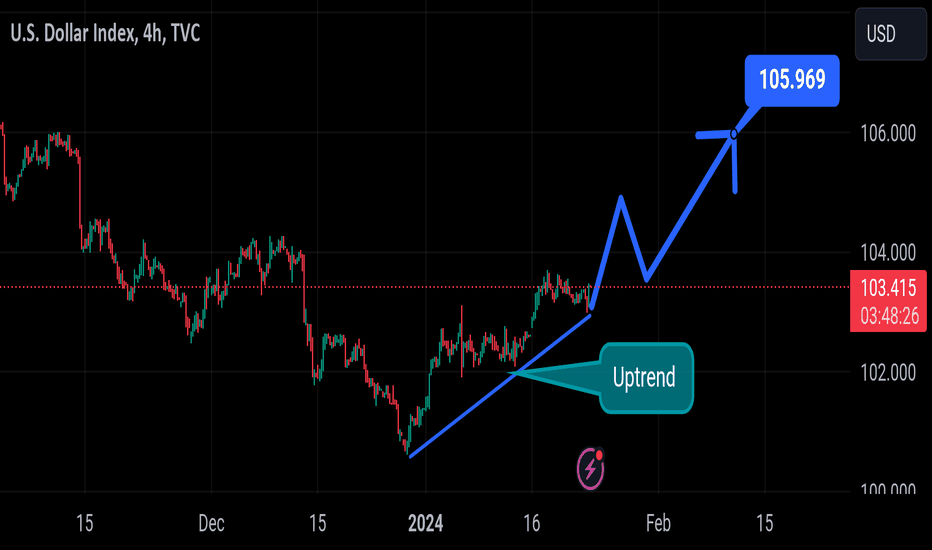
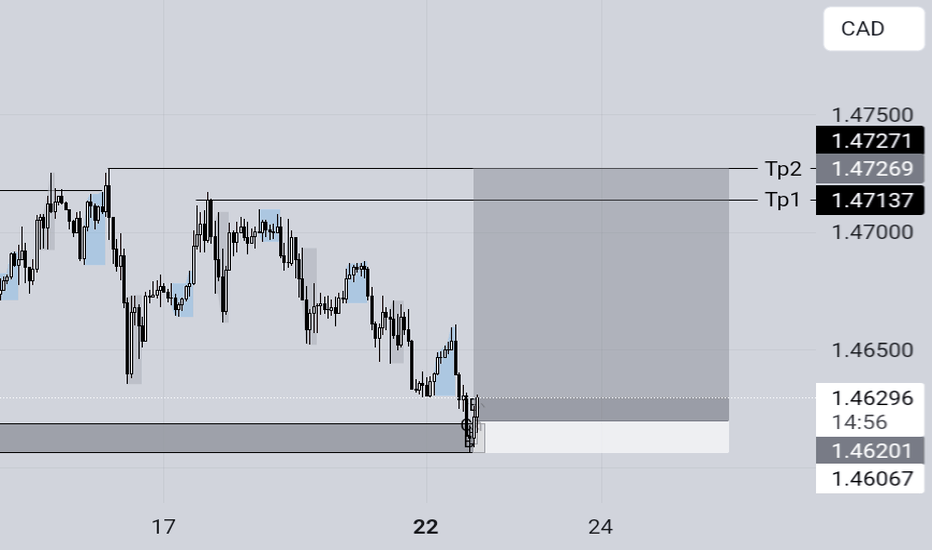
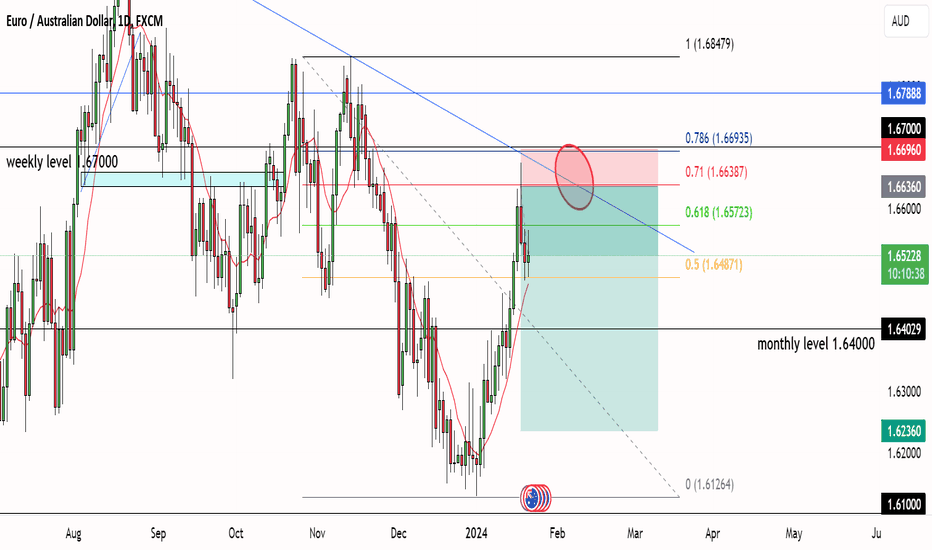
USDJPY shortUSD/JPY One hour trading report overview
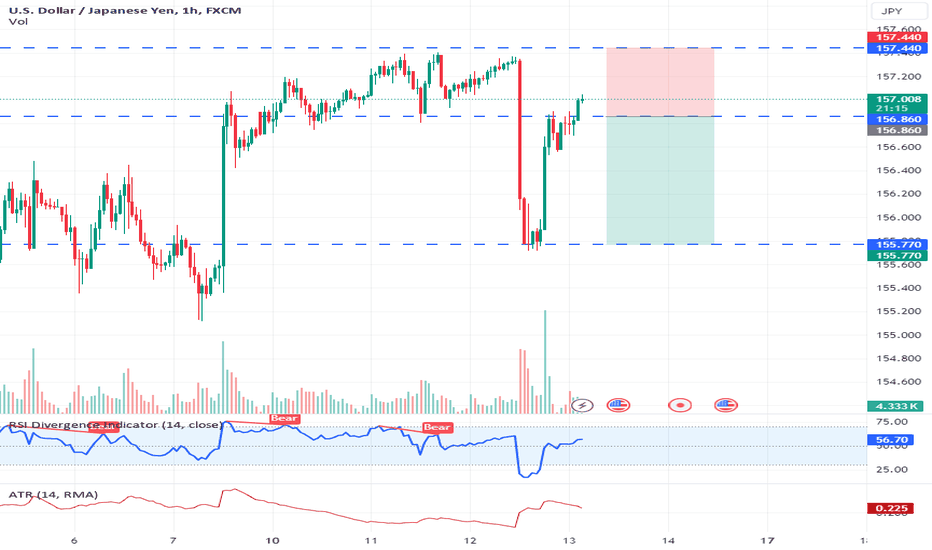
Tickets (EP): 156.86
Reason: Select the 156.86 entry point based on the relative strength index (RSI) and wait for favorable opportunities Opportunities exist during market corrections.This setup suggests the best entry point to capture a potential downtrend.
Stop Loss (SL): 157.44
Rationale: Stop loss is set at 157.44, calculated using average true range (ATR) data.This strict stop-loss setting is designed to protect the trade from any unexpected upside, thereby minimizing potential losses.
Take Profit (TP): 155.77
Reason: Take profit level is set at 155.77 The strategic goal is to maintain reasonable profits when the price is close to the previous support level and to ensure reasonable profits when the price pulls back.
Profit on this trade: 109pips (approximately 1,090usd/lot)
Please note that foreign exchange trading involves risks and the analysis provided is based on the information provided. Market conditions can change rapidly, so it is important to stay current and consider implementing risk management strategies. It is crucial to monitor the market closely and adjust your trading strategy accordingly.
Trend-analysis
NAS100 FORECAST
Overview:
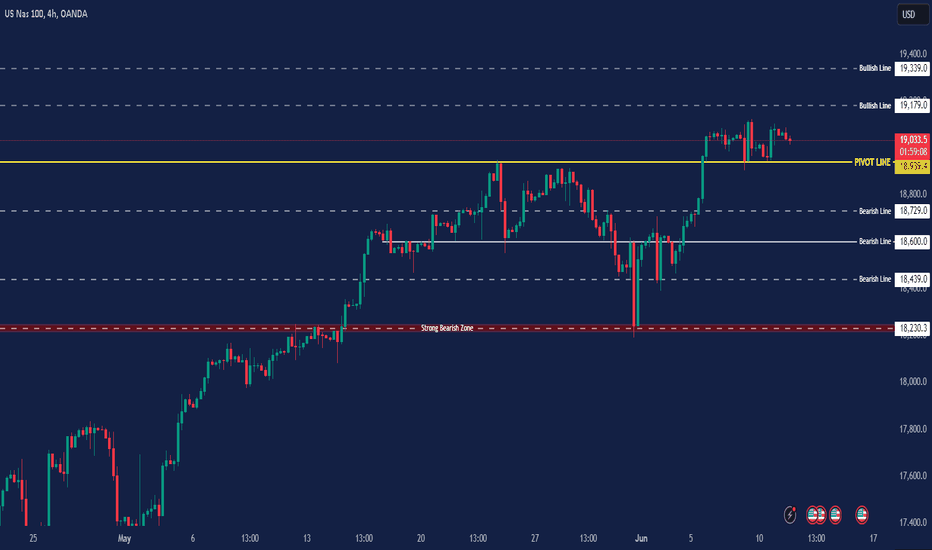
- Current Price: 19019, slightly down by 0.11% (-20.2 points).
- Price Action: The index has been in an uptrend since early May, with a recent consolidation phase.
Key Observations:
1. Trend:
- The overall trend is bullish, with higher highs and higher lows forming since early May.
- There was a significant upward movement around mid-May, followed by a correction and another upward push in early June.
2. Recent Price Movement:
- After reaching a high around 19050, the price has pulled back slightly and is currently consolidating just below this level.
- The consolidation near the highs indicates a potential continuation pattern, suggesting that the market might be gathering strength for another move higher.
3. Bearish and Bullish Levels:
- Resistance: The recent high around 19050 is acting as a resistance level. A breakout above this level could signal further bullish momentum.
- Support: The previous swing low around 18600 can be considered a key support level. If the price breaks below this level, it could indicate a potential trend reversal or a deeper correction.
4. Volume and Volatility:
- The chart does not show volume, but the recent price action suggests that volatility has been relatively low in the consolidation phase. Traders will likely watch for an increase in volume accompanying a breakout or breakdown to confirm the move.
Potential Scenarios:
1. Bullish Scenario:
- If the price breaks above the resistance at 19050 with strong momentum and volume, it could continue the uptrend, targeting new highs.
- In this case, the next psychological levels to watch would be around 19100 and 19200.
2. Bearish Scenario:
- If the price fails to break the resistance and falls below the recent consolidation low around 18900, it could signal the start of a correction.
- In this scenario, the next support levels to watch would be around 18700 and 18600.
3. Sideways Movement:
- The price could continue to consolidate between 18900 and 19050, indicating indecision in the market.
- Traders might wait for a decisive breakout or breakdown from this range to determine the next significant move.
Conclusion:
The US NASDAQ 100 index is currently in a bullish trend with a consolidation phase near recent highs. A breakout above 19050 could continue the uptrend, while a breakdown below 18900 might lead to a correction. Traders should watch for volume and momentum to confirm any potential moves.
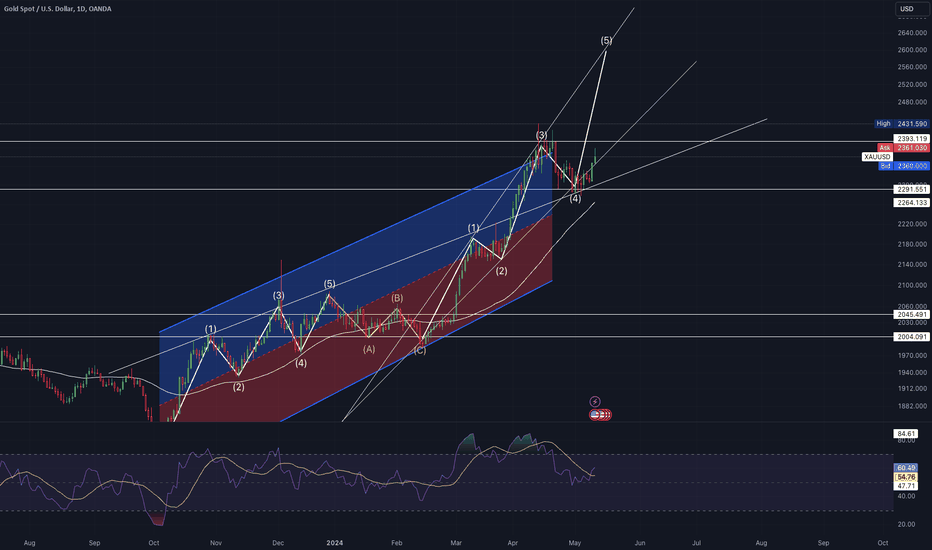
XAU/USD - Q2 Market AnalystBased on current trends and analysis, I forecast that XAU/USD will reach a new all-time high (ATH) this week at the earliest and next week at the latest. Therefore, we should consider taking a Long/Buy Action in the market. Here are the key insights:
Reversal: There was a strong rejection at the 2291 area after experiencing a strong rejection at 2393. This is a sign that the market has the potential to move upward. Additionally, this week, on May 10, 2024, the market closed above the support area.
Correction: The market will undergo a correction around the 2393 area before continuing its bullish trend, as long as there are no adverse news or situations affecting the market.
Please remember, this analysis is a personal interpretation of market trends and should not replace professional financial advice. Always conduct thorough research and consult financial experts before making investment decisions.
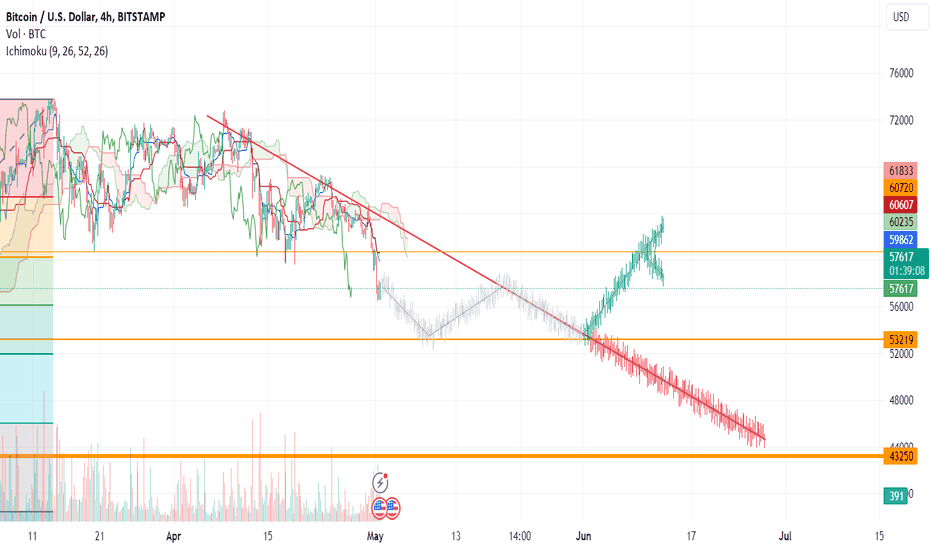
Bitcoin Dump: 54K next support?54K seems to be the most likely support level on the 4-hour chart for Bitcoin/USD.
After that 52K .
A drop to 48K seems unlikely . But possible.
A reminder that this is the 4-Hour Chart. If you zoom out, you will notice that Bitcoin is not yet in a bear market.
Technical Analysis tools used:
Volume, Ichimoku Clouds, Fibonnaci Retracement, Volume Delta, Support Lines.
The Fibonacci Retracement show the next likely support levels which correlates closely with the (orange) support lines.
Price action below the Ichimoku Cloud signals the continuation of a bearish trend.
The new Volume Delta Indicator shows a divergence of sell volume domination over market price, which leads me to believe a trend reversal is coming soon. (around 52-54k)
up-to-date Fundamental Analysis:
Good news to consider:
Possible ETF unbanning and adoption in China (unconfirmed)
World's largest custodian bank, BNY Mellon reports exposure to BTC ETF
Halvening in effect
First Bitcoin ETF's launched in Asia (Hong Kong)
Bad news to consider:
CEO of Binance sentencing (30. April 24)
Prominent Bitcoin Figures arrested
Government crackdowns in US/UK/EU on centralized elements of the cryptocurrency ecosystem (CEX, Custodial Wallets, etc.).
Asian Bitcoin ETF's flopped due to low volumes on opening day.
Psychological Considerations:
must-reach-100k mentality of the Bitcoin community
Community psychological barrier against centralization and regulation
50k support
Disclaimer
The information and publications are not meant to be, and do not constitute, financial, investment, trading, or other types of advice or recommendations.
XAUUSD Bullish Trend - All-Time HighAUUSD (Gold/US Dollar) is currently experiencing a strong bullish trend, marked by consistent upward momentum and robust buying pressure. This bullish sentiment is underscored by the recent attainment of an all-time high price level.
Key Indicators:
Price Action: XAUUSD has been steadily climbing, forming higher highs and higher lows, indicating a clear uptrend.
Moving Averages: Short-term moving averages (e.g., 20-day SMA) are positioned above longer-term ones (e.g., 200-day SMA), signaling bullish momentum.
Volume: Trading volume has been increasing alongside price gains, reflecting heightened investor interest and participation in the market.
MACD: The MACD (Moving Average Convergence Divergence) indicator shows a bullish crossover, with the MACD line rising above the signal line, suggesting upward momentum.
RSI: The Relative Strength Index (RSI) is in the overbought territory, indicating strong buying pressure and potential further upside.
Exxon Mobil Exxon Mobil is going up strong to the all time high,
Expecting strong reaction from that area,
Volume is going down in the last 2 3 weeks witch means bulls are getting weaker,
If we look into the valuation ratios , the company is getting overvalued,
If we look at the 10 Ma on weekly we can see that price is getting away from MA fast witch indicates that the company is getting overvalued quickly,
It will be interesting to see how price will react from that area when it goes up, But overall trend is bullish,
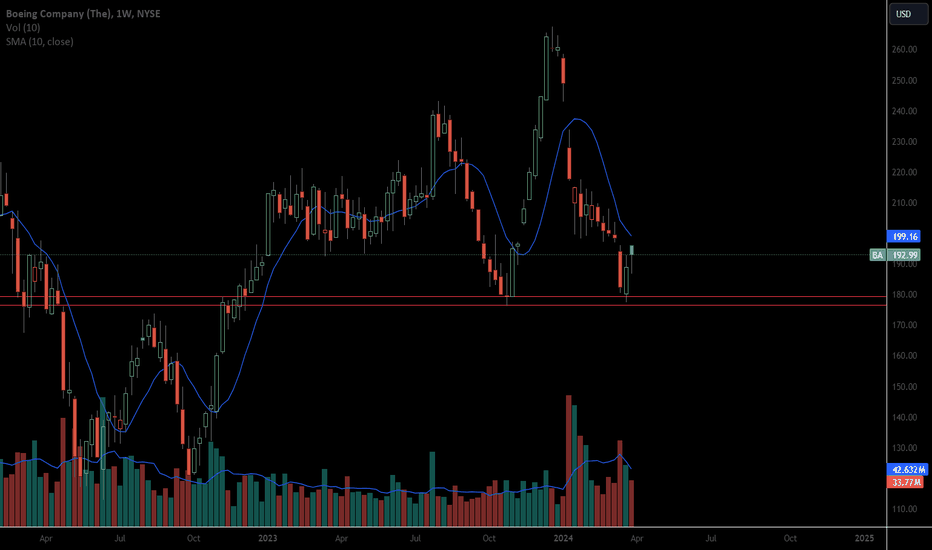
Boeing The company is on massive area of support, but technically the trend is still down and strong , momentum is down and strong too, next quarterly result will be crucial , if price breaks down it will go even further down , The company is not undervalued , but is getting there if you look closely into the valuation ratios. Volume is going down witch indicates that downtrend is losing power. Important weeks ahead for Boeing.
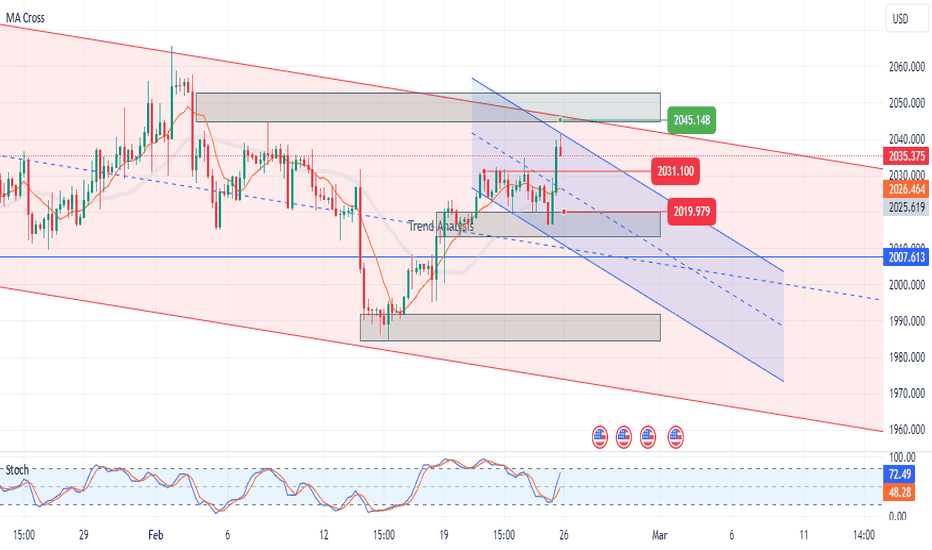
Gold Update Next Week ❤️Hello traders ,what do you think about GOLD? The price of gold is fluctuating between this range. From a technical point of view, there's an anticipation of a potential decline to the designated level of 2030, followed by a subsequent range of 2020-2010. feel free to express your support through likes and comments. ❤️
BITCOIN MOVE UP OR DOWN? WHAT'S NEXTThe current Bitcoin (BTC) price stands at 51,668, and there is an attempt to surpass the resistance at 51,800. If successful, BTC is expected to climb to 52,500, with the subsequent target being 53,200. Conversely, a failure to breach the 51,800 resistance and a drop below 51,400 could trigger a sell-off. In this scenario, the first sell target is set at 50,600, followed by a potential decline to 49,000 if market conditions do not support sustained levels. It is crucial to closely observe the market for any indications of a breakout or a change in established patterns.
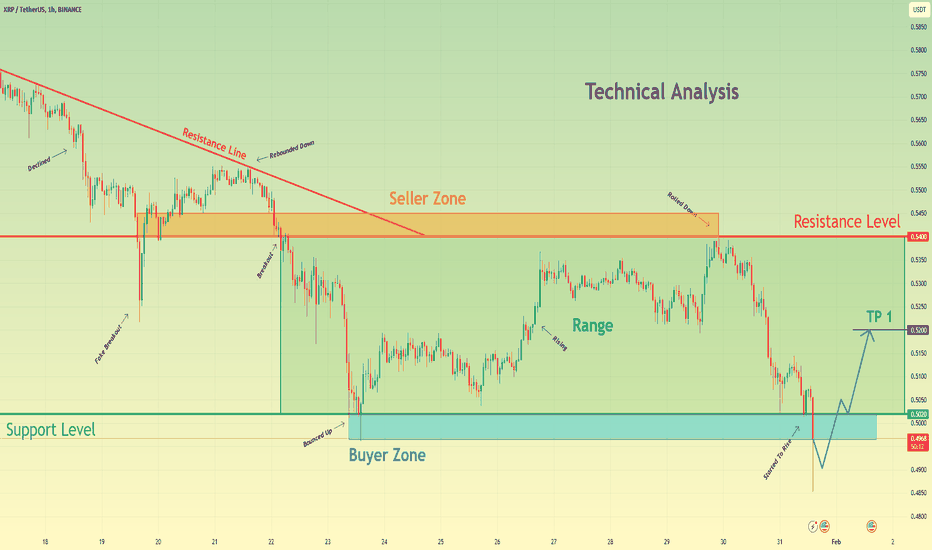
Ripple can decline a little more, after which back up to rangeHello traders, I want share with you my opinion about XRPUSDT. Observing the chart, we can see that the price some days ago price rebounded from the resistance line and started to decline near this line to the 0.5400 resistance level, which coincided with the seller zone. After the price fell to this level, it made a fake breakout of 0.5400 level, after which it turned around and in a short time rose to the resistance line. Then price bounced from this line and made a downward impulse to the support level, thereby breaking the resistance level one more time. Also, XRP started to trades in the range, where soon the price bounced from the 0.5020 support level, which coincided with the buyer zone and started to rise to the top part of the range. When Ripple reached the top part, which coincided with the resistance level, it at once rebounded and in a short time declined to the support level. But a not long time ago, the price bounced from this level and started to rise, but failed and soon declined lower than the support level. So, in my mind, Ripple can decline a little more, after which it turns around and back up to range. After this, the price will make retest and continue to rise. For this case, I set my target at the 0.5200 level. Please share this idea with your friends and click Boost 🚀
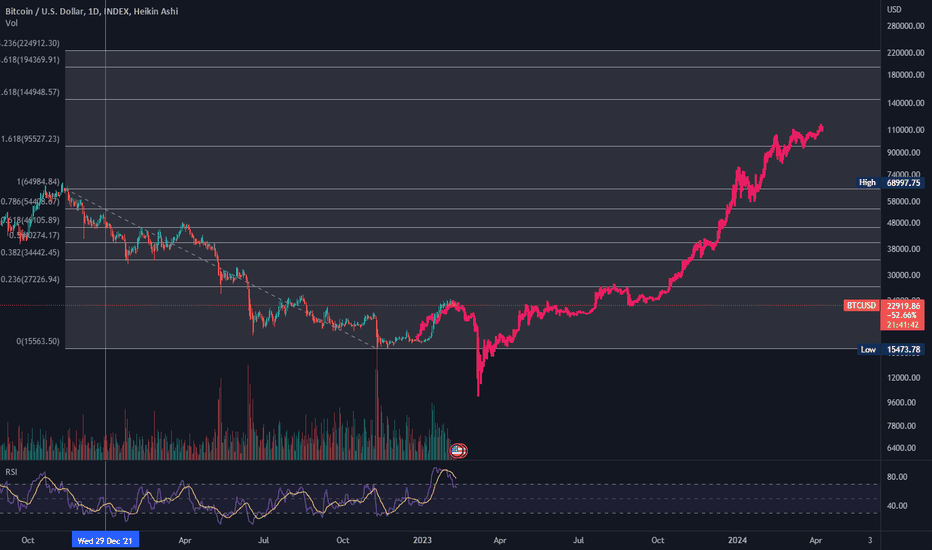
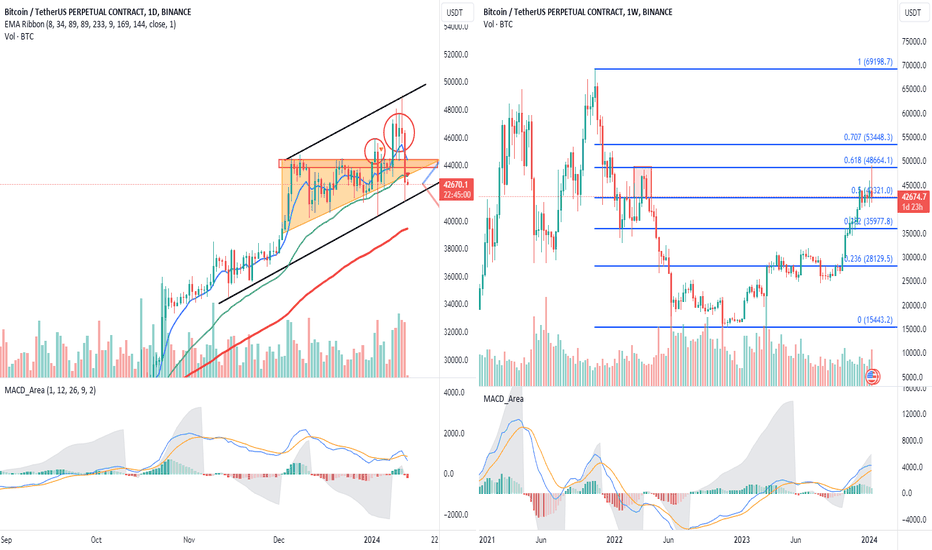
Bitcoin Trend Is About to ReversalAt this point I still think the trend is about to reverse
1. The daily line has diverged
2. Starting from an ascending triangle from December to January last year
In the upper supply range, people are constantly shipping.
Coupled with the subsequent false breakthrough and the upward shock in the following days,
I don’t think retail investors can sell so much goods here.
3. It touches the weekly line of 0.618 and is also the last escape point of the last bull market.
There's no one in the trap here who would be so kind as to free them.
#The cryptocurrency market has high risks, please carefully evaluate operational risks
This analysis is a personal comment and does not constitute any investment advice, so please refer to it with caution.
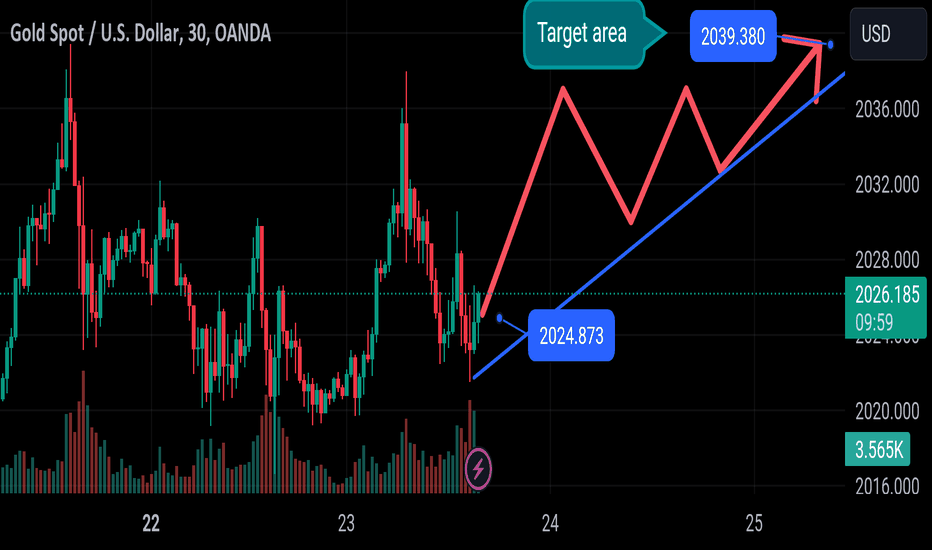
Gold struggle to selling read the caption Gold has bullish it's a good opportunity as it has been widely used as a store of value and medium of exchange. Currently, apart from its shine and usage for jewelry, the precious metal is widely seen as a safe-haven asset, meaning that it is considered a good investment during turbulent times. Gold is also widely seen as a hedge against inflation and against depreciating currencies as it doesn’t rely on any specific issuer or government.
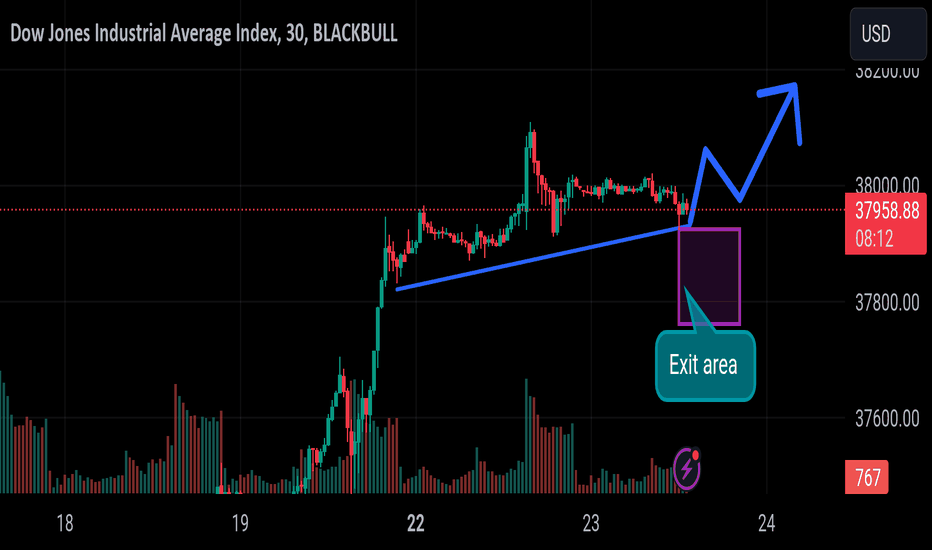
Dow Jones ready to fly read the caption US stocks climbed broadly higher on Monday, etching in fresh all-time highs as last week’s late break into record prices carried over into the new trading week, with tech stocks leading the way higher and sending the Dow Jones Industrial Average (DJIA) over the $38,500.00 valuation for the first time ever.
Dow Jones ready to bullish trend The Standard & Poor’s (S&P) 500 major equity index continues its march towards $5,000.00, ending Monday at $4,800.43 after hitting a new record high of $4,880.05 as investors continue to pile into stock bets.
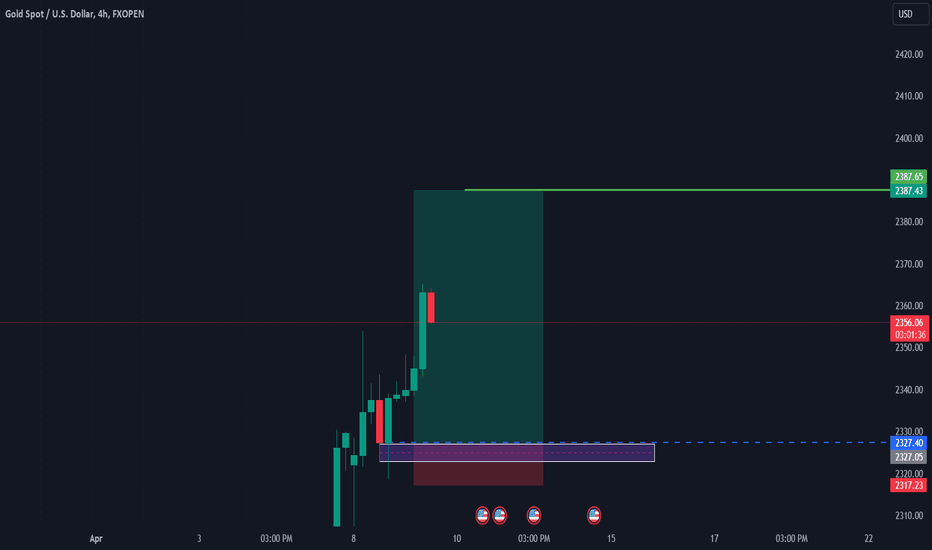
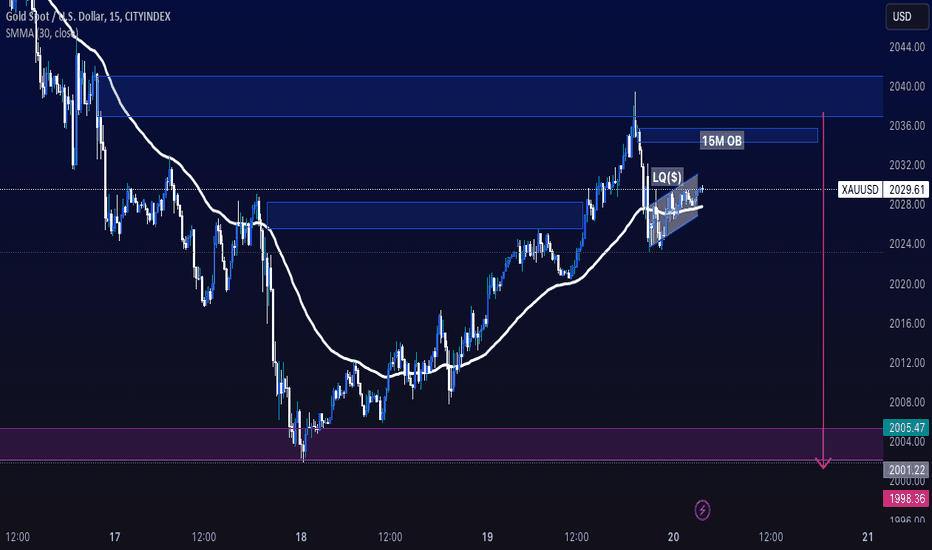
XAU short opportunityxau is bearish in HTF and rejected from a seller POI .and building liquidity below the OB .if it wants to fall from the current point then it should first clear the current liquidity and again retest the lower 15M OB . And in case if it reaches to the top OB prefer high rejection from it.and go for short. if it shows bullish momentum then the setup is invalid.
#AQURISHA
2024 Crypto SUMMER is here! PRICE, TRENDS & FORECASTSIn this video we lay out our short and long-term forecast for the entirety of 2024 Crypto Summer and beyond. Also, we do a little review and take a look at how our forecast stacked up against the eventful 2023 Crypto Spring. As always please feel free to leave your thoughts and ideas in the comments and thanks for watching!
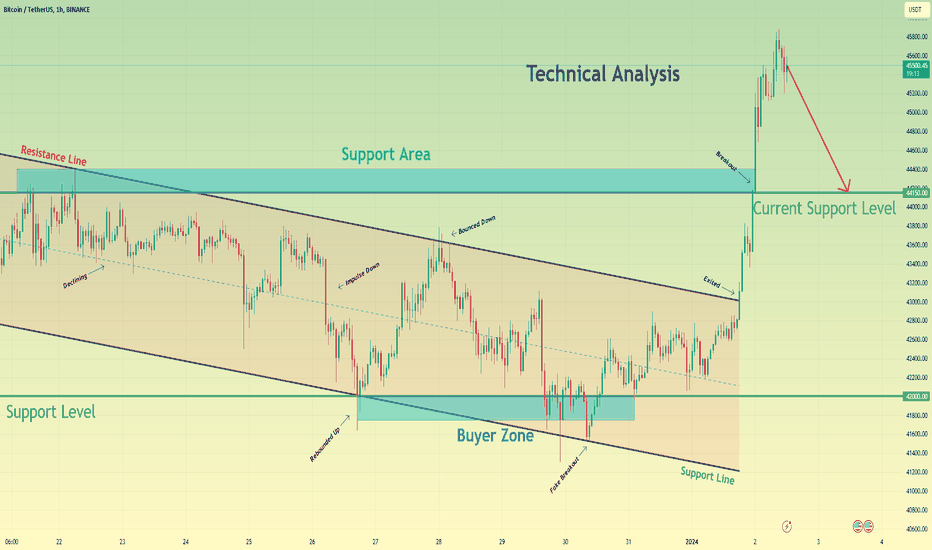
After strong upward impulse, BTC can make correction to 44150Hello traders, I want share with you my opinion about Bitcoin. Looking at the chart, we can see how the price some days ago reached the resistance line of the downward channel, which is located in the support area, but at once rebounded and continued to decline in the channel. Later BTC fell to the support level, which coincided with the support line of the channel and buyer zone, but then the price rebounded and made impulse up to the resistance line. After this, Bitcoin bounced and declined until to support line of the channel, thereby breaking the 42000 level, but soon price rebounded and rose back, making a fake breakout of this level. Next, the price some time traded near the 42000 level and later rebounded up to the resistance line of the downward channel. In a short time, BTC exited from the channel and made a strong upward impulse to 45900 points, thereby breaking the 44150 level, which coincided with the support area. Recently it started to decline and possibly Bitcoin can make a correction to a current support level. For this case, I set my target at this level - 44150. Please share this idea with your friends and click Boost 🚀
